ANOMALY BASED INTRUSION DETECTION IN WLAN
USING DISCRIMINATION ALGORITHM COMBINED WITH
NAÏVE BAYESIAN
CLASSIFIER
1P.KAVITHA, 2M.USHA
1Assistant Professor, Department of Information Technology,Adhiyamaan College of Engineering,Hosur,
Tamilnadu, India
2
Professor , Department of Computer Science and Engineering,Sona College of Technology,Salem, Tamilnadu, India
E-mail: 1[email protected], 2 [email protected]
ABSTRACT
The role of Intrusion Detection System (IDS) has been inevitable in the area of Information and Network security – especially for building a good network defense infrastructure. Due to the wide popularity of Wireless Networks tremendous applications are emerging and Wireless Local Area Network (WLAN) has gained attention by both research and industry communities. The wide spread deployment of WLAN has also brought new challenges to security and privacy. We need to distinguish anomalies that change the traffic either abruptly or slowly. Anomaly based intrusion detection technique is one of the building blocks of such a foundation. In this paper, the attempt has been made to apply correlation coefficient based learning approach for detecting anomalies in wireless Local area network. While a good amount of research has been done for fixed wired networks, not much research has been done in this area for wireless networks due to lack of a good dataset. Hence we developed a discrimination algorithm using correlation coefficient to detect anomalies combined with Naïve Bayesian classifier in the Wireless traffic and demonstrated the effectiveness using Kyoto 2006+ datasets. An experiment is carried out in order to evaluate performance based on accuracy, detection rate and false positive rate of the classification scheme. Results and analysis shows that the proposed approach has enhanced the detection rate with minimum false positive rates.
Keywords: Intrusion Detection, Anomaly Detection, Correlation Coefficient, Naïve Bayesian Classifier,
Wireless Network.
1. INTRODUCTION
A wide range of attacks and threats are increasing day by day along with rapidly growing
network technologies and the Internet.
Uncontrolled databases and web servers have been constantly targeted by intruders. In this context, Intrusion Detection System (IDS) has been established as the most important component of the whole network security and defense system. IDSs can detect serious security threats as well as unwanted activities like gaining unauthorized access to files and network resources. While an IDS is also capable of sending early alarms upon risk exposure caused by any attack, at the same time it has also potential to generate high volume of false alarms. In recent years, data mining approaches have been proposed and used as detection techniques for discovering anomalies and unknown attacks. These approaches have resulted in high accuracy and good detection rates but with moderate false alarm on novel attacks. In addition, some attacks and normal connections are
not detected correctly. Hence, there is a need to detect and identify such normal instances and attacks accurately in an interconnected network [3]. This paper has mainly reviewed the research works that have adopted from data mining approaches to detect novel attacks.
detect unknown attacks, but anomaly detection may detect previously unknown attacks. The training of the normality model for anomaly detection may be performed by a variety of
different techniques like clustering based,
statistics based etc. and many approaches have been evaluated.
The rest of the paper is organized as follows. In Section 2, we reviewed related work. Section 3 describes about Wireless LAN standards and various types of wireless attacks. Section 4 illustrates about data collection section 5 gives a detailed study on Discrimination algorithm and Naïve Baseyan Classifier Section 6 discusses the Experiment and analysis and section 7 describes about the Performance measures. The last section summarizes the whole work.
2. RELATED RESEARCH WORK
Dokas ,Ertoz kumar ,Srivasta[3] developed algorithms using outlier detection schemes. They conducted experiments on KDDCUP 99 dataset and concluded that LOF approach was the most
promising technique for detecting novel
intrusions. Zhang and Lee[4] first presented a distributed intrusion detection and response architecture for wireless ad hoc networks, which provides an excellent guide for the later works. M Thottan et. al.[5] proposed a proactive network anomaly detection model. They defined a set of proactively detectable anomalies in terms of management information base variables and the time series data obtained from these variables when they are analyzed by a signal processor. This work is shown to be amenable to distributed implementation and is a promising approach to self-managed networks. A data mining approach to network intrusion detection provides an opportunity to learn the behaviours of network users by mining the data trails of their activities. While recent research e.g., Clustering, MADAM ID , ADAM , MINDS , have investigated data mining for intrusion detection, considerable challenges remain unexplored. This involves intrusion detection models for wireless networks not requiring hard-to-get training data in wired network environment, as well as intrusion detection that has no prior knowledge of relationships between attack types and attributes of the network audit data. One of the most recent wired IDS by Zhong et al[4].Multiple centroid based unsupervised Online K-Means clustering algorithm for intrusion detection, with a simple yet effective self-labelling heuristic for detecting
attack and normal clusters of network traffic audit data. Some of the drawbacks of this Zhong et al. work are: they used only metrics available in the recorded wireless logs rather than all that are theoretically required to model common wireless attacks. While these methods can detect anomalies that cause unpredicted changes in the network traffic, they may be deceived by attacks that increase their traffic slowly. Our work can detect anomalies regardless of the speed of the network traffic.
The primary contributions of this study are:
• A detailed survey of possible WLAN
attacks illustrates the need of IDS
• Wireless network traffic data collection
using Wireshark demonstrates the
volume of network traffic data.
• Implementation of Correlation
Coefficient based discrimination
algorithm followed by Naïve Bayesian classification describes similarity of normal traffic and abnormality in the traffic which helps to detect anomalies in the wireless network
3. 802.11 STANDARD AND VARIOUS WIRELESS ATTACKS
IEEE 802.11 defines the wireless LAN (WLAN) standard. Details about this standard can be obtained from (802.11 LAN/MAN 1999). IEEE 802.11 focuses on the Physical and Medium Access Control (MAC) layers of the WLANs. 802.11 standard is designed to support mobility, provide fault tolerance, and allow all network protocols to run over WLAN.
There are three main types of 802.11frames:
• Management frames enable stations to
establish and maintain communications
• Control frames assist in the delivery of
data frames between stations.
• Data frame carries packets from higher
layers, such as web pages, printer control data, etc., within the body of the frame. IEEE 802.11 MAC layer is common for all the three different physical layer spectrums. It can be considered as an interface between the physical layer and the device. Detailed description of each of these fields is provided in (802.11b LAN/MAN 1999). A brief description is as follows:
Frame Control: Gives the protocol version and frame type.
value, which is used for Network Allocation Vector (NAV) calculation.
Address Fields: There can be up to four address fields depending on the ToDS and the FromDS field values. These are defined in the Frame Control Field.
Sequence Control: It is further divided into two subfields, Fragment Number and Sequence Number. Sequence Number defines the frame and Fragment Number defines the number of the fragments in the frame.
CRC: It represents the Cyclic Redundancy Check (CRC). It is a 32-bit field.
3.1.Wireless Attacks
Wireless intrusions belong to four broad categories, namely: (1)Passive attacks (2) Active
attacks (3) Man-in-the- middle (MITM) attack (4) Jamming attacks. A Passive attack (e.g., war
driving) occurs when someone listens to (or eavesdrops) on network traffic. Armed with a
wireless network adaptor that supports
promiscuous mode, the eavesdropper can capture network traffic for analysis using easily available tools, such as Network Monitor.War driving is the act of searching unsecured Wi-Fi networks by a person with a Wi-Fi equipped computer. As long as somebody is sniffing the network packets and trying to discover some useful information from gathered packets (e.g., WEP key used in the network or available open ports), we classify these activities as passive attacks. Once this information is discovered through passive attacks,
then hackers can launch some active
attacks.Active attacks launched by hackers who access the network to launch these active attacks include unauthorized access, Denial of Service (DoS) and Flooding attacks like (SYNchronized) SYN Flood attacks,and (User Datagram Protocol) UDP Flood attacks. DoS attack attempts to engage a host of computer resources so that these resources are not available to other users. DoS is an attack in which the attacker keeps the resource too busy or too full to handle other legitimate requests, and thus, it denies legitimate users access to a machine. The attacker’s IP address is fake and destination IP address is the server victim’s address. Receiving so many packets from attacker prevents victim from accepting new legitimate requests and may crash the victim server.
Man-In-The-Middle(MITM) attack
entails placing a rogue AP (Access Point) within range of wireless stations. If the attacker knows the SSID in use by the network (which is easily
discoverable) and the rogue AP has enough strength, wireless users have no way of knowing that they are connecting to an unauthorized AP.Because of their undetectable nature, the only defense against rogue APs is vigilance through frequent site surveys using tools such as
Netstumbler and AiroPeek, and physical
security.Jamming is a special kind of DoS attack specific to wireless networks. Jamming occurs when spurious RF (Radio Frequency) frequencies interfere with the operation of the wireless network. Intentional and malicious jamming occurs when an attacker analyzes the spectrum being used by wireless networks and then transmits a powerful signal to interfere with communication on the discovered frequencies. Fortunately, this kind of attack is not very common because of the expense of acquiring hardware capable of launching jamming attacks and it leads to a lot of time and effort being expended merely to disable communications. Many researches were done for sniffing the network using open source tools and detecting MAC address spoofing and in our work we try to propose a method to detect active attacks using discrimination algorithms.
A variety of tools have been developed for the purpose of network anomaly detection. Some detect anomalies by matching the traffic pattern or the packets using a set of predefined rules that describe characteristics of the anomalies. The cost of applying these approaches is proportional to the size of the rule set as well as the complexity of the individual rules, which affects the scalability of these approaches. Furthermore they are not sensitive to anomalies that have not been previously defined. Our work is a traffic analysis on the network data which requires little computation.
4.DATACOLLECTION
The general unavailability of benchmark data on wireless attacks (i.e., data with known attack types) calls for the creation of new models for wireless network intrusion detection. Hence we propose the correlation based approach to detect the suspicious traffic.
Fig.1 Simulated Wireless Network Using NS-2
The traces of wireless traffic are observed for a particular fixed period( e.g 3 minutes). The adversary nodes were created randomly.Since the traffic has many Probe request ,response , Association , and Disassociation frames, feature extraction was done on the collected traffic.The correlation between the pairs of traffic data records are calculated .
Real time Wireless traffic of Wi-Fi Lab with 120 nodes and 10 Access points are captured using Wireshark(Figure.2). Three weeks of the traces are observed and the extracted features are used for anomaly detection.
Fig.2.Wireless Network Traffic Collection
4.1.Selection Of Data
The Entire experiment is carried out using the data sets collected in Wireless Lab using Wireshark ,Simulated datasets of NS-2 and Kyoto 2006+ bench mark data set.
Selection of experimental data set:
• 3 -weeks traces of Real time
wireless network
• Data sets of NS-2
• 2009 July 1, 8, 15 and 22 with
500865 records
4.2.Data Pre-Processing
A few simple and basic data pre-processing techniques like sampling and filtering are applied for the sake of easy and smooth operation of the experiments. Samples with known and unknown attacks are merged together so as to render two types of data only viz. Normal and Attack data. The categorical attributes of the data are treated differently for clustering They are converted into numerical values e.g. {REJ, S0, RST0, SF} is encoded as {1,2,3,4}.
4.3. The Experimental Procedure
Among the selected Kyoto2006+ dataset, a number of different sized data samples are extracted. Using every data samples, one by one,
both Correlation based Clustering and
Classification programs are executed. The number of true positive, true negative, false positive and false negative values of the programs are recorded and used in the performance evaluation.
We propose an anomaly detection method similar to the work of Yu,Zhou,Jia,Guo et al. The Algorithm is modified to suit for the wireless traffic. The feature extraction was done on the attributes of network traffic records. This model is proposed to detect all the active attacks such as Man-in-The Middle attack, Denial of Service and Packet modification.The correlation coefficient based discrimination algorithm is shown in detail in Algorithm 1.
The detailed discussion of correlation relationship calculation on traffic data are given below: The network traffic flow can be represented by a
data sequence Xi[n], where i (i 1) is the index of
network flows, and n denotes the nth element in a
data sequence. For example, if the length of a
given network traffic flow Xi is N, then the
network flow can be expressed as follows. Xi = { xi[1], xi[2], ... , xi[N] } (1)
where xi[k](1 ≤ k ≤ N) represents the number of
packets that we counted in the kth time interval for
the network traffic flow.The correlation is used to describe the similarity of different data sets.
Let Xi and Xj i ≠ j be two network flows with the
same length N, then the correlation between the two flows is defined as
r Xi, Xj [k]= (2)
where k (k = 0, 1, 2, . . . , N−1) is the position shift of flow Xj. The correlation coefficient of the two data records has been defined as
5. SIMILARITYBASEDDETECTION
METHOD
In this section, we present the similarity based detection method against attacks. Under this framework, the requirement of storage space is very limited and an online decision can be achieved. Our task is to identify whether it is a normal traffic or a suspicious one. According to our proposal, when a possible network start to sample the suspected flows by counting the number of packets for a given time interval, for example, 5 minutes. When the length of a flow N, is suitable, we start to calculate the correlation coefficient between suspected flows.
Suppose we have sampled M network
packets, X1, X2,. . ., XM, therefore, we can obtain
the correlation coefficient of any two network traffic, Xi(1 ≤ i ≤ M)and Xj (1 ≤ j ≤ M,i ≠ j). Let
IXi,Xj be an indicator for the similarity of the traffic
Xi and Xj , and IXi,Xj has been assigned two
possible values: 1 for similar packets [9] and 0 otherwise, be the threshold for the discrimination, then we have
Ixixj = (4)
where 1 ≤ i, j ≤ M, and i ≠ j
In general, we may have more than two suspected flows in a community network. This means we can conduct a number of different pair wise comparisons, and the final decision can be derived from them in order to improve the reliability of our decision. We can therefore find an integrated normal packet data by positive probability as follows.
Pr(IA=1) = (5)
where IA is the indicator for normal packets, and
IA = 1represents positive for normality. We can
set a threshold δ’ (0 ≤ δ’ ≤ 1) for our global
judgement, therefore, we make our final decision with global information as follows.
IA = (6)
The value of has an impact on our detection
accuracy.
For example, if = 0.6, then it is normal packet if at least 60% of the comparisons are positive.
Algorithm : The Correlation Coefficient based Discrimination Algorithm to Cluster the network traffic
Step 1.Packet capturing (pt);
Step 2.Extracting the necessary features by pairing up the MAC address that uniquely
identifies the client with access point to which it is connected;
Step 3: Parameter Initialization ; 3.1. Initialize N and ; 3.2. Xi = Xj = 0 ;
Step 4: Sampling the extracted features, maximum M collected data records;
for t = 1 to M do
Xt ← Samples of extracted features t;
End
Step 5: Calculating Correlation Coefficient for all suspicious pairs of records ;
foreach i, j ∈ M, i ≠ j do
Calculating correlation coefficient for a pair of suspicious features Xi , Xj ;
for k = 1 to N do obtain ρXi,Xj ;
if ≤ρXi,Xj then
Ixi,xj = 1;
break; else
k = k + 1 ;
end end end
Calculating positive probability Pr(IA = 1)
step 4: decision on multiple comparisons ;
4.1 if Pr(IA = 1) ≥ 0.6 then normal packet;
goto step 1; else
4.2.Mark it as Suspicious packet ; 4.3.Create cluster based for the suspicious packet
4.4 Handle the Suspicious packets separately to Classify using Bayesian Classification
End
Anomaly detection assumes that intrusions will always reflect some deviations from normal patterns. The assumption here is fixed based on the observation of the wireless traffic.
5.1.Naïve Bayes Classifier
A Naïve Bayes classifier is a simple probabilistic classifier based on applying Bayes' theorem with strong (naïve)independence assumptions. A Naïve Bayes classifier assumes that the presence (or absence) of a particular feature of a class is unrelated to the presence (or absence) of any other feature.Depending on the precise nature of the probability model, Naïve Bayes classifiers can be trained very efficiently in a supervised learning setting.
P (H|X) = P (X|H) P(H) / P(X) (7)
Let X be the data record, H be some hypothesis representing data record X, which belongs to a specific class C. For classification, we would like to determine P(H|X), which is the probability that the hypothesis H holds, given an observed data record X. P(H|X) is the posterior probability of H conditioned on X. In contrast, P(H) is the prior probability. The posterior probability P(H|X), is based on more information such as background knowledge than the prior probability P(H), which is independent of X. Similarly, P(X|H) is posterior probability of X conditioned on H. Bayes theorem is useful because it provides ways to calculate the posterior probability P(H|X) from P(H), P(X), and
P(X|H).
The Classification Algorithm: -
The overall algorithm consists of two phases – learning phase and classifying (prediction) phase.
Input: D: Data set having n data objects C: Set of classes e.g. {Normal; Attack} X: Data record to be classified
H: Hypothesis (that X is classified into C) Output: The predicted class CNB where X should
be classified into. Pseudo code: // Learning //
For j ← 1 to no. of classes
// Step 1: Calculate prior probabilities of C //
Cj_count ← no. of Di where Di.class_label = j;
P(Cj) ← Cj_count / n;
// Step 2: Calculate prior probabilities of X // For each attribute value Xl in X
Xl_count ← no. of Xl in Cj;
P(Xl |Cj) ← Xl_count / Cj_count;
EndFor
// Step 3: Calculate posterior probability of X //
P(X) ← average (P(Xl |Cj));
Endfor
// Classifying //
// Step 4: Determine required Naïve Bayes probability //
For j ← 1 to no_of_classes
P(Cj|X) ← P(Cj/H) * P(Cj) / P(X) // Using Eqn. 2
// Endfor
// Step 5: Get the class with maximum probability //
CNB = max(P(Cj|X))
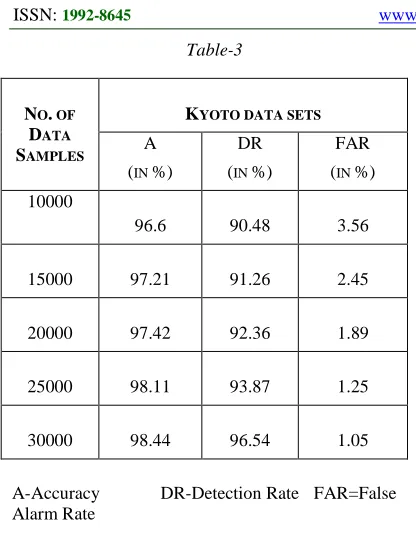
6.PERFORMANCE MEASURES
The performance evaluation of the experiment is carried out in terms of Accuracy (A), Detection Rate (DR) and False Alarm Rate (FAR) by using the following equations:-
A = (TP+TN) / (TP+TN+FP+FN) DR = (TP) / (TP+FP)
FAR = (FP) / (FP+TN) Where,
TP = True Positive (attack detected as attack) TN = True Negative (normal detected as normal) FP = False Positive (normal detected as attack) FN = False Negative (attack detected as normal)
The followings tables represent the results showing accuracy, detection rate and false alarm rates of the proposed approach.
Table -1
Table-2
NO. OF
DATA
SAMPLES
WIRELESS LAB DATA SETS
A
(IN %)
DR
(IN %)
FAR
(IN %)
10000 82.33 87.41 9.89
15000 93.21 87.66 6.45
20000 94.56 89.23 5.12
25000 96.47 89.54 2.91
30000 97.20 92.23 1.82
NO. OF
DATA
SAMPLES
SIMULATED DATA SET (NS-2)
A (IN %)
DR (IN %)
FAR (IN %)
10000 95.82 89.25 3.82
15000 96.23 90.28 2.33
20000 96.82 92.45 2.24
25000 97.22 92.65 1.69
Table-3
A-Accuracy DR-Detection Rate FAR=False Alarm Rate
Table -1,2,3 Shows the comparison of Accuracy, Detection Rate, False Alarm Rate of various datasets.
In this work the size of data samples may also be considered as a contributing factor for the overall enhancement. From the above analysis we observed that the accuracy and detection rate are improved whereas False Alarm Rate gets decreased when the number of data samples are increased. Accuracy and Detection Rate increase remarkably when the size of the data samples exceeds a certain value and remain almost constant thereafter.
7. SUMMARY AND CONCLUSION
In this work, we tried to discriminate the normal and abnormal (anomaly) pattern in the wireless network traffic which is a tough and open problem for researchers. Handling large volume of data to detect the minor deviation in the network traffic is a tedious and a most challenging problem. We found that the normal flow posses higher similarity compared with that of active attack flow. Generally, it has been observed that the application of Correlation based clustering, followed by Naïve Bayesian classification method is better in terms of the Detection Accuracy as well as in increasing the Detection Rate by reducing the False Alarm Rate in the mean time. It is also learnt that the betterment of the proposed approach becomes more remarkable in case of large datasets. Naïve Bayes Classification is a basic classification scheme and works fine with
good data distribution. But the data distribution model of network intrusion data differs from environment to environment and hence is very hard to predict.
REFERENCES
[1] ShuiYu,Wanlei,Weijia,Song uo,Yong,Feilong
Tang, ”Discriminating DDOS Attack from Flash Crowds using Flow Correlation Coefficient “IEEE Transactions on Parallel and Distributed Systems,Vol 23,No.6,June 2012
[2] P.Kavitha, M.Usha,”Classifier Selection
Model for Network Intrusion Detection using Data Mining”,CiiT International Journal of Data Mining and Knowledge Engineering,Vol 3,No.12 ,2011.
[3] P.Kavitha, Usha.M,”Detecting Anomalies in
WLAN using Discrimination Algorithm” 4th International Conference on Computing,
Communication and Networking
Technologies - ICCCNT 2013,July 2103
[4] Tarek S. Sobh,”Wired and wireless intrusion
detection system : Classification, good
characteristics and state-of-the-art .”
Elsevier, 2005
[5] Ertoz, L., Eilertson, E., Lazarevic, A., Tan, P.,
Srivastava, J., Kumar, V., Dokas, P.: The MINDS – Minnesota Intrusion Detection System, Next Generation Data Mining, MIT Press, 2004.
[6] R Xu, J Li, F Zhang, R Levy, W
Lee,“Agent-based cooperative Anomaly detection for Wireless Ad hoc Networks, - Parallel and Distributed,2006
[7] Anomaly Detection Approaches for
Communication Networks MarinaThottan, Guanglei Liu, Chuanyi Ji.2009
[8] Khoshgoftaar, T.M., Nath, S.V., Zhong, S.,
Seliya, N, “Intrusion detection in wireless networks using clustering techniques with expert analysis”, in proc. of the ICMLA 2005:Fourth International Conference on Machine Learning andApplications, pp. 120-125, 2005.
[9] Zhong, S., Khoshgoftaar, T.M., Nath, S.V., “A
clustering approach to wireless network intrusion detection”, in proc. Of the International Conference on Tools with Artificial Intelligence, ICTAI 2005, pp. 190-196, 2005.
[10] Zhong, T. M. Khoshgoftaar, and N. Seliya”
Clustering based network intrusion
detection” International Journal of
NO. OF
DATA
SAMPLES
KYOTO DATA SETS
A
(IN %)
DR
(IN %)
FAR
(IN %) 10000
96.6 90.48 3.56
15000 97.21 91.26 2.45
20000 97.42 92.36 1.89
25000 98.11 93.87 1.25
Reliability, Quality, and Safety Engineering,2007.
[11] M. Balazinska and P. Castro” Characterizing
mobility and network usage in a corporate wireless local-area network” In The 1st Int. Conf. Mobile Systems, Applications, and Services, 2003
[12] Gianluca Papaleo Wireless network intrusion
detection system : Implementation and Architectural issues,2006.
[13] T. Velmurugan and T. Santhanam,
“Computational Complexity between
k-Means and k-Medoids Clustering
Algorithms for Normal and Uniform Distributions of Data Points”, Journal of Computer Science, 6 (3): 363-368, 2010.
[14] Yang Su, Gwo-Jong Yu, Chun-Yuen Lin A
real- time network intrusion detection system for large scale attacks based on an incremental mining approach ,Elsevier 2008.
[15] M. Xue and C. Zhu, “Applied Research on
Data Mining Algorithm in Network
Intrusion Detection,” International Joint Conference on Artificial Intelligence, 2009.
[16] Tarek S. Sobh,”Wired and wireless intrusion
detection system : Classification, good
characteristics and state-of-the-art .”
Elsevier, 2005
[17] C. F. Tsai, and C.Y Lin, “A Triangle
Area-Based Nearest Neighbors Approach to Intrusion Detection,” Pattern Recognition, 43(1): 222-229,2010.
[18] Y. Li and L. Guo, “An Active Learning Based
on TCM-KNN Algorithm for Supervised Network Intrusion”, Computer and Securtiy, 26: 459-467, 2007
[19] R. Luigi, T.E. Anderson, and N. McKeown,
“Traffic Classification using Clustering Algorithms”. ACM SIGCOMM Conference
on Applications,Technologies,
Architectures, and Protocols for Computer Communications, Pisa, Italy, ACM Press, pp. 281-286, Sep. 11-15,2011.
[20] B.A. Nahla, B. Salem, and E. Zied, “Naïve
Bayes vs Decision Trees in Intrusion Detection Systems”, ACM Symposium on Applied Computing,Nicosia, Cyprus, 2004.
[21] Xiang, C., M.Y. Chong and H.L.Zhu, “Design
of Multiple-Level Tree Classifiers for
Intrusion Detection System”. IEEE
Conference on Cybernetics and Intellligent Systems (CCIS 2004), Singapore, pp: 873-878, 2004.
[22] An intrusion detection Model, Dorothy E.
Denning, IEEE 1986.
[23] UCI KDD. The Third International Knowledge
Discovery and Data Mining Tools
Competition Dataset KDD Cup 1999 Data,http://kdd.ics.uci.edu/databases/kddcup 99/ kddcup99.html, 1999.
[24] Traffic Data from Kyoto University’s
Honeypots. http://www.takakura.com/Kyoto data/
[25] C.H. Tsang, S. Kwong, and H. Wang,