Thesis by
Michael Andrew Pahre
In Partial Fulfillment of the Requirements
for the Degree of
Doctor of Philosophy
California Institute of Technology
Pasadena, California
1998
c
° 1998
Michael Andrew Pahre
Abstract
A near–infrared imaging survey of 341 nearby early–type galaxies, combined with optical
imaging and spectroscopic data from the literature, are used to construct the global scaling
relations for this population of galaxies. These data demonstrate a number of important
features of the early–type galaxy sequence: (1) the slope of the Fundamental Plane (FP)
correlations systematically increases with wavelength; (2) the slope of these FP correlations
deviates from the virial expectation at all wavelengths, implying a breakdown of either or
both of the assumptions of constant mass–to–light ratio and homology; (3) the intrinsic
scatter of the FP correlations is small but resolved at all wavelengths, implying a small
cosmic scatter of early–type galaxy properties at any position in the galaxy sequence and
contradicting any model in which various stellar populations parameters “conspire” with
each other to keep the correlations thin at optical wavelengths; (4) there is no
correla-tion among residuals of the metallicity–independent near–infrared FP and the metallicity–
sensitive Mg2–σ0 relation, implying that both age and metallicity variations contribute to
the cosmic scatter of both correlations; and (5) the effective radii systematically decrease
with increasing wavelength, fully consistent with the general presence of stellar populations
gradients in early–type galaxies. A comprehensive and self–consistent model is described
which simultaneously explains these and other global properties of the early–type galaxy
sequence. This model demonstrates that age, metallicity, deviations from a dynamically
homologous family, and populations gradients are all contributing to the form of the global
scaling relations; the latter two effects are the least constrained by the observations and
model, respectively.
Additional constraints on the role of age in the global scaling relations is obtained
by observing early–type galaxies at higher redshifts. This has been studied using three
approaches: color evolution, evolution of the slope and intercept of the K–band FP cor-relations, and evolution of the absorption line strengths. The galaxies in each cluster are
identified in a systematic way using two color (three bandpass) imaging—sampling
galaxies. The bluing trend in color is 0.05±0.03 mag atz= 0.2, 0.12±0.04 mag atz= 0.4, and ∼ 0.23±0.05 mag at z = 0.54. Using stellar population synthesis models from the literature, this color evolution is fully consistent with the galaxy population as a whole
having formed at 1< zf <5.
The FP correlations are studied for 128 galaxies in eight rich clusters at 0.1< z <0.6 using moderate dispersion spectroscopy (110 of the measurements are new) and imaging
in the near–infrared K–band. These data more than quadruple the data in the literature which can be used to study the FP at high redshift. The near–infrared FP is constructed
at high redshifts for the first time. The intercept of the FP on the surface brightness axis
is observed to dim with redshift, as expected for the Tolman signal in an expanding world
model. A small amount of luminosity evolution ∆K≈ −2.5 log(1+z) mag is detected on top of the Tolman signal, which is consistent with the passive evolution of a stellar population
that formed at high redshift. The slope of the near–infrared FP is observed to flatten with
redshift, implying that the least luminous galaxies are evolving faster than the luminous
galaxies. This is strong evidence that low luminosity ellipticals have a stellar content that
is up to a factor of two times younger than high luminosity ellipticals, but age spreads much
larger than this appear to be excluded, and age spreads somewhat smaller than this are
still allowed depending on the choice of nearby galaxy sample used in the comparison.
The absorption line strengths of the galaxies are observed to evolve slowly with redshift:
the Mg2 and hFei indices weaken while the HβG index strengthens. The latter effect in
particular is another strong indication that the mean age of the stellar populations in
early–type galaxies formed at redshifts 3< zf <5. All of these properties are moderately
consistent with the models derived above based on the samples of nearby galaxies, implying
that age is an important physical parameter underlying the global scaling relations for
Acknowledgments
For a thesis like this one, in which a large quantity of data is collected from many sources,
it is difficult to fully acknowledge every person who has made a significant contribution
along the way towards this final product. Professor George Djorgovski provided timely
advice, wonderful encouragement, marvelous amounts of money for traveling to meetings
and observing runs, tall back scratcher drinks on the coast of Hawaii, large quantities of
powdered drugs from Colombia (the dark brown variety), observing time galore, and many
a not–so–gentle shove to finish some of the many projects we started. Above all, he showed
patience in allowing me to run amok designing the various surveys reported here. Many
thanks also go to that special woman for her moderating influence.
I have spent many a night, cloudy and clear, shooting the breeze and sharing a mug
of java with the night assistants of the Palomar and Las Campanas Observatories and the
Observing Assistants of the Keck Observatories. The efficient professionalism of the staffs
of these observatories has made the collection of all those ExaByte tapes proceed smoothly
and resulted in beautiful data. The cooks of Palomar and Las Campanas Observatories are
thanked for making even a cloudy run pleasurable. The directors of these observatories,
and the Time Allocation Committees, have my highest gratitude for granting large blocks
of observing time to pursue this thesis project. I pray that in the end they will find the
product well worth the considerable investment.
The year spent among the Santa Barbarians of Carnegie building a near–infrared camera
was memorable due to their collective enthusiasm and remarkable scientific insights. I now
hold an even greater respect for the wide–ranging abilities possessed by the instrumentation
teams at OCIW, and wish them great luck on their Magellanic expedition. It was a joy
learning first–hand from Drs. Eric Persson, David Murphy, and Anand Sivaramakrishnan
the right way to build an instrument.
Professor Jeremy Mould deserves special appreciation for getting me started in infrared
observing and surface brightness fluctuations, and for his super–human patience and
persis-tence in our continued collaborations. Many of the things I know about elliptical galaxies
sors Roger Blandford, Judy Cohen, Shri Kulkarni, Keith Matthews, Mark Metzger, Gerry
Neugebauer, Tom Soifer, and Chuck Steidel; post–doctoral researchers John Blakeslee, Chris
Clemens, Laura Ferrarese, and Ian Smail; and graduate students Chris Fassnacht, John
Gizis, David Hogg, and James Larkin. Laura Ferrarese also read an early version of several
chapters of this thesis and provided insightful comments. Many office mates have shown
patience with the ever–expanding masses of papers, folders, and tapes which occupy the
surfaces of my desks. Martin Shepherd has proved to be a highly valuable source for all sorts
of “nawk–ing.” Finally, my thesis committee—George Djorgovski (chair), Roger Blandford,
Andrew Lange, Eric Persson, Steve Shectman, and Chuck Steidel—have shown great
en-couragement and offered excellent advice, comments, and six unique perspectives on this
ambitious project.
My family has shown great support and encouragement not only while I have spun
deeper and faster into this black hole, but also all along my various routes which eventually
led to Caltech. And Suzanne, the most complicated and fascinating person I have ever had
the pleasure to know, to you I owe gratitude for your patience with my crazy work and
travel habits, your unbridled enthusiasm for science and me, your excellent proofreading
ability, and your constant love and affection. Ah yes, and many thanks to the support from
Contents
Abstract iii
Acknowledgments v
1 Introduction 1
1.1 The Standard Paradigm for Elliptical Galaxies . . . 1
1.2 The Fundamental Plane Correlations . . . 2
1.3 Outline of Thesis . . . 4
References . . . 5
2 Near–Infrared Photometry of Early–Type Galaxies in the Local Uni-verse: Global Photometric Parameters 7 2.1 Introduction . . . 8
2.2 Description of the Near–Infrared Imaging Survey . . . 11
2.3 Observations and Data Reduction . . . 17
2.3.1 Palomar 60–inch Telescope Data . . . 17
2.3.2 Las Campanas 1.0 m Swope Telescope Data . . . 18
2.3.3 Las Campanas 2.5 m du Pont Telescope Data . . . 19
2.3.4 Data Reduction . . . 19
2.3.5 Photometric Calibration . . . 20
2.4 Surface Photometry . . . 23
2.5 Seeing Corrections . . . 25
2.6 Measurement of Global Photometric Parameters . . . 32
2.7 Estimation of Internal Uncertainties . . . 34
2.7.1 Aperture Magnitudes . . . 35
2.7.2 Surface Photometry . . . 35
2.7.3 Global Photometric Parameters . . . 35
2.9 Additional Global Properties Drawn from the Literature . . . 48
2.9.1 Photometric Parameters . . . 48
2.9.2 Spectroscopic Parameters . . . 52
2.9.3 Catalogs of Global Photometric and Spectroscopic Parameters for Various Optical Bandpasses . . . 53
2.10 Discussion . . . 55
References . . . 56
3 The Near–Infrared Fundamental Plane of Early–Type Galaxies 59 3.1 Introduction . . . 60
3.2 Description of the Data . . . 62
3.3 Analysis of the Elliptical Galaxy Correlations . . . 64
3.3.1 The Near–Infrared Fundamental Plane . . . 64
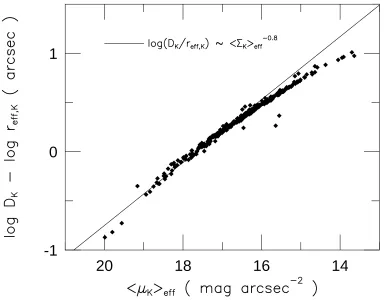
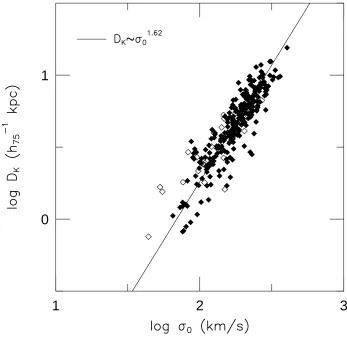
3.3.2 The DK–σ0 Relation . . . 70
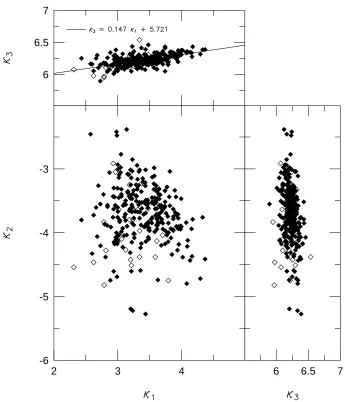
3.3.3 The FP As Seen in κ–Space . . . 72
3.3.4 The Mg2–σ0 Relation . . . 75
3.3.5 The Mg2 Near–Infrared Fundamental Plane . . . 75
3.3.6 The Faber–Jackson Relation . . . 85
3.3.7 The Modified Faber–Jackson Form of the FP . . . 85
3.3.8 The Kormendy Relation . . . 87
3.3.9 The Radius–Luminosity Relation . . . 89
3.4 Exploring Simple Models for the Origins of the Elliptical Galaxy Scaling Relations in the Near–Infrared . . . 89
3.5 Discussion . . . 93
References . . . 95
4 The Physical Origins of the Fundamental Plane Scaling Relations for Early–Type Galaxies 99 4.1 Introduction . . . 100
4.2 Description of the Data . . . 102
4.4 The Difference in Slope Between the Optical and Near–Infrared FP . . . . 105
4.4.1 The Traditional Method to Measure the Change in Slope of the FP 105 4.4.2 The New, Distance–Independent Method to Measure the Change in Slope of the FP . . . 105
4.4.3 Possible Environmental Effects on the FP . . . 111
4.5 Comparing the Fundamental Plane Among Various Optical Bandpasses . . 113
4.6 General Constraints from the Elliptical Galaxy Scaling Relations . . . 115
4.7 A Self–Consistent Model for the Underlying Physical Parameters Which Produce the FP Correlations . . . 119
4.7.1 Modeling the Changes in the Slope of the FP Between Bandpasses . 120 4.7.2 Additional Equations of Constraint . . . 121
4.7.3 Solutions to the Physical Quantities in the Model for the Scaling Relations . . . 124
4.7.4 The Relative Roles of Various Constraints on the Model Solution . 127 4.8 Discussion . . . 129
4.9 Summary . . . 136
References . . . 137
5 Color Evolution in the Early–Type Galaxy Population in 26 Rich Clus-ters at 0< z <0.6 141 5.1 Introduction . . . 142
5.2 Observations . . . 146
5.2.1 Calibration . . . 150
5.2.2 k–corrections . . . 150
5.2.3 Galactic Extinction . . . 155
5.3 Object Detection and Measurement of Colors . . . 158
5.4 The Color–Morphology Selection Criteria to Identify Cluster Ellipticals . . 159
5.4.1 Summary of Selection Criteria Used . . . 159
5.4.2 Abell 665 (z= 0.182) as a Worked Example . . . 159
5.4.3 Comparing the Effects of Each of the Selection Criteria . . . 161
5.5.1 New Spectroscopy of Galaxies from These Complete Samples . . . . 166
5.5.2 Comparison to Redshift Surveys from the Literature . . . 172
5.5.3 The Exclusion of K+A Type Galaxies . . . 173
5.6 Color Evolution in the Early–Type Galaxy Population in Rich Clusters of Galaxies . . . 173
5.7 Summary . . . 182
References . . . 184
6 Global Spectroscopic and Photometric Properties of Early–Type Galax-ies in Eight Clusters at 0.1< z <0.6 187 6.1 Introduction . . . 187
6.2 Selection of Galaxy Sample in Each Cluster . . . 189
6.3 Spectroscopy . . . 193
6.3.1 Observations . . . 193
6.3.2 Data Reductions . . . 207
6.3.3 Stellar Template Spectra . . . 210
6.3.4 Measurement of Velocities and Velocity Dispersions . . . 217
6.3.5 Measurement of Line Indices . . . 223
6.3.6 Spectroscopic Parameters From the Literature . . . 233
6.4 Photometry . . . 235
6.4.1 K–band Imaging . . . 235
6.4.2 Measuring Global Photometric Parameters . . . 238
6.4.3 Optical Global Photometric Parameters . . . 242
6.5 Summary . . . 243
References . . . 244
7 The Evolution of the Fundamental Plane of Early–Type Galaxies for 0< z <0.6 247 7.1 Introduction . . . 248
7.2 Summary of Data . . . 250
7.4 Evolution of the Slope of the FP . . . 254
7.5 Evolution of the Line Strengths . . . 259
7.6 Discussion . . . 263
References . . . 265
8 Summary: The Physical Properties Underlying the Sequence of Elliptical Galaxies 269 8.1 The Sequence of Elliptical Galaxies . . . 269
8.2 Summary of Results in This Thesis . . . 270
8.3 A Picture for the History of Elliptical Galaxies . . . 273
8.3.1 Can These Results be Reconciled with the Line Index Measurements of Trager (1997)? . . . 274
8.3.2 The Formation Epoch for Elliptical Galaxies . . . 277
8.3.3 Hierarchical Structure Formation and Elliptical Galaxies . . . 278
8.4 Future Work . . . 281
References . . . 282
A Tables of Global Photometric and Spectroscopic Parameters for Nearby
List of Figures
2.1 Distribution ofK–band Survey Galaxies in Galactic Coordinates . . . 13
2.2 Comparison of Ks and K Filters . . . 22
2.3 Histogram of the Seeing Distribution for the Survey . . . 25
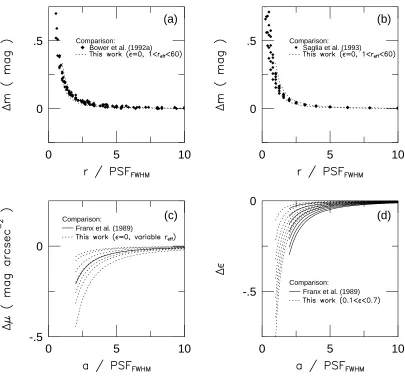
2.4 Seeing Corrections Derived from Model Grid Galaxies . . . 30
2.5 Comparison of Seeing Corrections with the Literature . . . 31
2.6 The Similarity of Curves of Growth for Elliptical Galaxies . . . 33
2.7 Internal Comparison of Surface and Aperture Photometry . . . 36
2.8 Comparison of Global Photometric Parameters Derived from Circular Aper-ture Photometry . . . 37
2.9 Comparison of Global Photometric Parameters Derived from Surface Pho-tometry . . . 38
2.10 Comparison of Aperture Magnitudes with the Literature . . . 43
2.11 Comparison of Surface Photometry with Peletier (1989) . . . 45
2.12 Comparison of Surface Photometry with Silva & Elston (1994) . . . 46
2.13 Comparison of Surface Photometry with Ferrarese (1996) . . . 47
2.14 Histograms of Global Colors for Early–Type Galaxies . . . 50
3.1 The Fundamental Plane (FP) in theK–band for Each Cluster . . . 67
3.2 The FP in theK–band in Edge–On and Face–On Perspectives . . . 69
3.3 The DK–σ0 Relation . . . 71
3.4 The K–band FP Viewed inκ–Space . . . 73
3.5 The Mg2–σ0 Relation . . . 76
3.6 The Mg2 Form of the Near–Infrared Fundamental Plane . . . 78
3.7 The Effects of a 10% Young, 5 Gyr Population on Top of a 90% Old Stellar Population . . . 81
3.8 The Residuals of the Near–Infrared FP Plotted Against the Residuals of the Mg2–σ0 Relation . . . 83
3.12 The Kormendy Relation Between Effective Radius and Mean Surface
Bright-ness . . . 90
3.13 The Relation Between Luminosity and Effective Radius . . . 91
4.1 Comparison of the Effective Radii and Diameters Derived From Optical and Near–Infrared Photometry . . . 104
4.2 Comparison of the Slope of the Optical and Near–Infrared Fundamental Plane . . . 109
4.3 Comparison of the Slope of the Optical and Near–Infrared Dn–σ0 Relation 110 4.4 Comparison of theDV–σ0 andDK–σ0 Relations in Different Environments and Regions . . . 112
4.5 Comparison of the Slope of the Fundamental Plane Among Optical Band-passes . . . 116
4.6 Comparison of the Slope of the Dn–σ0 Relation Among Optical Bandpasses 117 4.7 Comparison of the Slope of the FP Among Various Optical Bandpasses Using the Color Information From Prugniel & Simien (1996) . . . 118
4.8 Comparison of M/LV and M/LK for Four Different Stellar Populations Models . . . 122
4.9 Contours ofχ2/ν for the Self–Consistent Model for the FP . . . . 128
4.10 The Evolution of the FP With Redshift for the Self–Consistent Model De-scribing the FP . . . 133
5.1 Comparison of k–corrections into (U −V)0 Color . . . 152
5.2 Comparison of k–corrections for Solar Metallicity Models Only . . . 153
5.3 Comparison of Galactic Extinction Estimates . . . 157
5.4 Identification of the Early–Type Galaxy Sequence in Abell 665 . . . 160
5.5 Selection Effects Due to the (U−V)0versusVtot,0Color–Magnitude Relation in Abell 665 . . . 162
5.6 Selection Effects Due to the (V−I)0 versusVtot,0Color–Magnitude Relation in Abell 665 . . . 163
5.8 Selection Effects Due to the (U −V)0 versus (V −I)0 in Abell 665 . . . 165
5.9 Field Galaxy Contamination Estimated from Three “Blank” Fields Ob-served in the BRCIC Bandpasses . . . 167
5.10 Field Galaxy Contamination in Abell 665 As Estimated from Three “Blank” Fields . . . 168
5.11 Field Galaxy Contamination atz= 0.12 from Two “Blank” Fields Observed inU V I Filters . . . 169
5.12 Field Galaxy Contamination at z = 0.37 from Three “Blank” Fields Ob-served inBRI Filters . . . 170
5.13 Color–Magnitude Relations for Clusters Observed in (U −V) at 0.062 < z <0.125 . . . 175
5.14 Color–Magnitude Relations for Clusters Observed in (U −V) at 0.129 < z <0.231 . . . 176
5.15 Color–Magnitude Relations for Clusters Observed in (B −R) at 0.171 < z <0.231 . . . 177
5.16 Color–Magnitude Relations for Clusters Observed in (B −R) at 0.308 < z <0.390 . . . 178
5.17 Color–Magnitude Relations for Clusters Observed in (B −R) at 0.402 < z <0.460 and in (V −I) at 0.539< z <0.546 . . . 179
5.18 Color–Magnitude Relations Binned by Redshift . . . 180
5.19 Color Evolution (U−V)0 for the Individual Clusters at 0.024< z <0.546 . 181 5.20 Color Evolution (U−V)0 for the Binned Data at 0.024< z <0.546 . . . . 182
6.1 Finding Chart for Galaxies in Abell 655 . . . 194
6.2 Finding Chart for Galaxies in Abell 665 . . . 195
6.3 Finding Chart for Galaxies in Abell 2390 . . . 196
6.4 Finding Chart for Galaxies in Abell 370 . . . 197
6.5 Finding Chart for Galaxies in Abell 851 . . . 198
6.6 Finding Chart for Galaxies in MS0015.9+1609 . . . 199
6.7 Spectra of Galaxies in Abell 655 . . . 211
6.8 Spectra of Galaxies in Abell 665 . . . 212
6.12 Spectra of Galaxies in MS0015.9+1609 . . . 216
6.13 Fits to Several Galaxy Spectra for Abell 665 Using Stellar Template HD134190
(G7.5 III) . . . 221
6.14 Comparison of Mg2 and Mgb for High Redshift Galaxies Observed . . . 232
6.15 K–corrections for theK and Ks Filters . . . 238
6.16 Comparison of Model Photometric Fits inKandKsFilters for Eight
Galax-ies in MS0015.9+1609 . . . 242
7.1 Detection of the Tolman Surface Brightness Dimming Signal for an
Expand-ing World Model . . . 252
7.2 Detection of Luminosity Evolution from the Near–Infrared FP . . . 253
7.3 Evolution of the Surface Brightness Intercept of the FP in the K–band . . . 255 7.4 The Individual Fits to the Slope of the K–band Fundamental Plane for
Clusters at 0< z <0.6 . . . 257 7.5 The Evolution With Redshift of the Slope and Intercept of theK–band FP 258 7.6 The Relations Between Line Strength and Central Velocity Dispersion . . . 260
7.7 The Evolution of the Mean Line Strengths With Redshift . . . 262
8.1 Comparison of Models From This Thesis With Ages and Metallicities from
List of Tables
2.1 Clusters, Groups and Other Galaxies in theK–band Photometry Survey . . 14
2.2 Model Grid for Calculating Seeing Corrections . . . 27
2.3 Internal Comparison of Global Photometric Parameters . . . 39
2.4 Comparison of Aperture Magnitudes with the Literature . . . 41
2.5 Literature Sources for Global Photometric Parameters . . . 51
2.6 Literature Sources for Spectroscopic Parameters . . . 54
3.1 Fits for Each Cluster or Group for the Near–Infrared FP . . . 66
3.2 Variations in Magnitude and Mg2 for an Old Population With and Without a 10% Young Population By Mass for the Worthey (1994) Models . . . 80
4.1 Comparison of the Slope of the FP in the Optical and Near–Infrared . . . . 108
4.2 Comparison of the Slope of the FP Among Various Optical Bandpasses . . 114
4.3 Variations in Magnitude for Various Bandpasses for the Bruzual & Charlot (1996) and Vazdekis et al.(1996) Models . . . 123
5.1 Summary of Observations . . . 148
5.2 Measurements of (U−V)0 by Cluster . . . 156
6.1 Summary of All Available Data Appropriate for Studying the Evolution of the Early–Type Galaxy Scaling Relations . . . 190
6.2 Photometric Properties for Galaxies in Abell 655 . . . 200
6.3 Photometric Properties for Galaxies in Abell 665 . . . 201
6.4 Photometric Properties for Galaxies in Abell 2390 . . . 202
6.5 Photometric Properties for Galaxies in Abell 370 . . . 203
6.6 Photometric Properties for Galaxies in Abell 851 . . . 204
6.7 Photometric Properties for Galaxies in MS0015.9+1609 . . . 205
6.8 Spectroscopic Properties for Galaxies in Abell 655 . . . 224
6.9 Spectroscopic Properties for Galaxies in Abell 665 . . . 225
6.13 Spectroscopic Properties for Galaxies in MS0015.9+1609 . . . 228
6.14 Photometric and Spectroscopic Properties for Galaxies in ZwCL0024+1652 234 6.15 Photometric and Spectroscopic Properties for Galaxies in MS2053.7-0447 . 236 7.1 Individual Fits to the K–band Fundamental Plane Slope . . . 256
7.2 Evolution of the Line Strengths With Redshift . . . 261
A.1 All Measurements ofK–Band Global Photometric Parameters . . . 287
A.2 Combined Catalog of Global Parameters for All Program Galaxies . . . 296
A.3 Comparisons ofK–band Quantities with B–band Quantities from Faberet al.(1989) . . . 303
A.4 Comparisons of K–band Quantities withB–band Quantities from Dressler et al. (1991) . . . 307
A.5 Comparisons ofK–band Quantities withV–band Quantities from Lucey & Carter (1988) and Lucey et al.(1991a, b; 1997) . . . 308
A.6 Comparisons ofK–band Quantities withR–band Quantities from Smithet al.(1997) . . . 312
A.7 Comparisons ofK–band Quantities withr–band Quantities from Jørgensen et al. (1995a) . . . 313
A.8 Comparisons ofK–band Quantities withU–band Quantities from Jørgensen et al. (1996) . . . 315
A.9 Comparisons ofK–band Quantities withB–band Quantities from Jørgensen et al. (1996) . . . 316
A.10 Comparisons ofK–band Quantities withg–band Quantities from Jørgensen et al. (1996) . . . 317
A.11 Comparisons ofK–band Quantities withI–band Quantities from Scodeggio et al. (1997) . . . 318
A.12 Comparisons ofK–band Quantities withV–band Quantities from Boweret al.(1992a) . . . 320
A.14 Comparisons ofr–band andU–band Quantities from Jørgensenet al.(1995a; JFK95a) . . . 324
A.15 Comparisons ofr–band and B–band Quantities from JFK95a . . . 325 A.16 Comparisons ofr–band and g–band Quantities from JFK95a . . . 326 A.17 Comparisons of r–band Quantities from Jørgensen et al. (1995a) and B–
band Quantities from Faberet al. (1989) . . . 328
A.18 Comparisons of r–band Quantities from Jørgensen et al. (1995a) and V– band Quantities from Lucey & Carter (1988) and Lucey et al. (1991a,b;
1997) . . . 330
A.19 Comparisons ofRC–band Quantities from Smith et al. (1997) and V–band
Quantities from Lucey & Carter (1988) and Lucey et al. (1991a,b; 1997) . . 332 A.20 Comparisons of IC–band Quantities from Scodeggio et al. (1997) and V–
band Quantities from Lucey & Carter (1988) and Lucey et al. (1991a,b; 1997) . . . 333
A.21 Comparisons ofIC–band Quantities from Scodeggioet al.(1997) andr–band
Chapter 1
Introduction
1.1
The Standard Paradigm for Elliptical Galaxies
The standard picture of elliptical galaxies is that they each formed early in the universe’s
history after a monolithic collapse and a massive burst of star formation. When the first
generation of supernovae exploded, the combined output energy of their winds blew the gas
out of these galaxies thus abruptly halting the formation of additional stars. The remainder
of the history of these galaxies up to the present day consisted of the slow stellar evolution,
as the stars began to evolve off the main sequence at progressively lower masses. In this
way elliptical galaxies are said to contain “old” stellar populations, since they have not
experienced star formation since early in the history of the universe. The stellar content
of these galaxies is likewise referred to as “early–type,” which means that the stars the
galaxies contain formed at early times.1 Elliptical galaxies take their name from their
smooth, featureless, ellipsoidal morphology which stands in stark contrast to the composite
of grand spiral arms, dust lanes, bars, disks, and bulges which typify the morphologies of
spiral galaxies.
In this simple picture, elliptical galaxies do not contain gas (molecular or atomic, neutral
or ionized) or dust that typically accompanies the formation of stars, since the interstellar
medium (ISM) of these galaxies was blown out early on by the first generation of
super-novae. They contain uniformly old stars that are nearly as old as the universe itself. Their
shapes are perfectly smooth and regular, such that they can be viewed mathematically as
a homologous family in the distribution of their light and stellar velocities. Finally,
cal galaxies are dynamically “hot,” which means that they are supported by pressure (the
apparently random motions of their stars) rather than by ordered rotation (as in a disk
galaxy).
At first glance, the observable properties of elliptical galaxies appear to provide strong
support for this picture of an extremely homogeneous population of galaxies. For example,
their colors are red, their light profiles are well fit by a two parameter (de Vaucouleurs)
functionI ∝Ieexp h
1−(r/re)1/4 i
such that they are homologous to a scaling by the half–
light radius re, and their distribution of ellipticities appears to imply triaxiality.
Many observations made during the last decade, however, are now showing that elliptical
galaxies are not so simple.2 There appears not to be a single, unimpeachable case for triaxi-ality in a real elliptical galaxy. There are clear and systematic departures of the light profiles
from the de Vaucouleurs shape, such that the galaxies either haveI ∝Ieexp h
1−(r/re)1/n i
,
wheren correlates with galaxy luminosity, or are a composite disk plus bulge:
I ∝Ibexp "
1−
µr rb
¶1/4#
+Idexp · 1− µr rd ¶¸ . (1.1)
Detection of these galaxies at far infrared wavelengths by the IRAS satellite in the 1980s
argues for the presence of a warm dust component to their ISM. Residuals from fits of
smooth models to the two–dimensional light distributions reveal the presence of dust lanes
and disks which have short dynamical times. Ionized gas is detected in the core regions of
these galaxies, as are rings of neutral hydrogen gas at large radii. It is beginning to look
like elliptical galaxies are not such an elegant and pure class of galaxies after all.
1.2
The Fundamental Plane Correlations
Fortunately, all of these departures of real elliptical galaxies from the ideal concept of an
elliptical galaxy are small. The global properties of elliptical galaxies obey simple
correla-tions with very small scatter. A simple (mono-variate) correlation between two variables
appears not to be sufficient to fully describe the properties of elliptical galaxies; instead, the
correlations with the minimal scatter require three observables. These bivariate correlations
are called the Fundamental Plane correlations (FP; Dressleret al.1987; Djorgovski & Davis
elliptical galaxies tightly obey the FP correlations, it is even more remarkable that they do
so despite the many small variations that exist among galaxies in their profile shapes, dust
and gas contents, and even galaxy environment.
The standard form of the FP is the relationship between one quantity which measures
galaxy size (the half–light, or effective, radius reff), another quantity which measures the
luminosity density (mean surface brightness), and a third quantity which measures the
dynamical state (the central velocity dispersion, a measure of the random motions of the
stars in a galaxy). The correlation of these quantities is thus effectively a relationship
between the luminosity, size, and dynamical mass of a galaxy. This thesis will use these
FP correlations liberally as the optimal toolby construction with which to study the global properties of elliptical galaxies.
Since the FP correlations have such small scatter, they are well suited for studying in
detail the way that the early–type galaxy population evolves with redshift. The global
properties of ellipticals are so uniform that they probably comprise the best class of galaxy
for performing some of the neoclassical cosmological tests. One such test will be addressed
in this thesis: the dimming of surface brightness SB with redshift z. Tolman (1934) and Hubble & Tolman (1935) proposed that surface brightness should vary as (1 +z)−4 in an expanding universe, or as (1 +z)−1 in a non–expanding (“tired light”) universe. This signal
is well–detected using elliptical galaxies, as will be shown in Chapter 7; galaxy evolution is
then detected as a small brightening on top of this strong SB dimming due to the
expand-ing world model. The spectral energy distribution of the cosmic microwave background
radiation (CMBR, measured recently by the COBE satellite) is by far the most significant
observation that constrains the world model to be one of expansion. The complementary
constraint imposed by SB dimming of the early–type galaxy population, however, requires
any non–standard cosmological model to explain simultaneously both the CMBR and the
1.3
Outline of Thesis
The basic question that is addressed by this thesis is: What are the underlying physical
properties that vary systematically from one elliptical galaxy to the next along the galaxy
sequence? Subtle effects—such as variations in heavy element abundance, mean solar age,
and so on—can be derived from the exact form of the FP correlations at various wavelengths
and at different redshifts.
This thesis is neatly divided into two parts: studies of nearby early–type galaxies
(Chap-ters 2–4) and three investigations of how this population of galaxies evolves with redshift
(Chapters 5–7).
The thesis begins with a near–infrared imaging survey of 341 early–type galaxies in the
λ = 2.2µm atmospheric window. These data comprise the first large–scale study of its kind since the single element, aperture photometry measurements of Persson, Frogel, and
collaborators in the 1970s. The Fundamental Plane (FP) bivariate correlations among the
properties of these galaxies will be presented in Chapter 3. The systematic variation of
the slope of the FP correlations with wavelength will be described in Chapter 4 using a
distance independent construction of the observables. These correlations and a number of
other global properties of early–type galaxies are then drawn together in Chapter 4, and a
complete and self–consistent model is developed for the first time to explain the underlying
physical parameters which produce the correlations. Chapter 4 ends the first part of the
thesis with predictions based on this model for how the slope of the FP correlations should
evolve with redshift.
The second part of the thesis begins in Chapter 5 with the development of a method of
reliably identifying this same population of early–type galaxies in distant clusters of galaxies
at 0 < z < 0.6. The method is shown to be > 90% effective in identifying galaxies that belong to this population at the target cluster redshift. The remainder of the thesis consists
of using galaxy samples identified in this manner to measure the evolution of early–type
galaxies.
Chapter 5 concludes with the detection of weak color evolution in rest–frame (U −V)0
in the early–type galaxy population for 0< z < 0.6. This is followed by the description of a new study of the global properties of early–type galaxies at these redshifts in Chapter 6.
galaxies are observed to evolve in three ways: the characteristic luminosity (as measured
by the surface brightness intercept of the near–infrared FP) evolves slowly; the slope of
the near–infrared FP relations evolves by flattening with redshift, implying a differential
evolutionary rate among early–type galaxies; and the absorption line strengths in general,
and Hβ in particular, evolve slowly with redshift. Models are compared with all of these evolutionary trends in Chapters 5 and 7 in order to determine if the evolution is passive.
References
Arnaboldi, M., Da Costa, G. S., & Saha, P., eds. 1997, The Nature of Elliptical Galaxies,
Proceedings of the Second Stromlo Symposium, ASP Conf. Ser. Vol. 116 (San Francisco:
ASP)
Djorgovski, S., & Davis, M. 1987, ApJ, 313, 59
Dressler, A., Lynden-Bell, D., Burstein, D., Davies, R. L., Faber, S. M., Terlevich, R. J., &
Wegner, G. 1987, ApJ, 313, 42
Hubble, E., & Tolman, R. C. 1935, ApJ, 82, 302
Tolman, R. C. 1934, Relativity, Thermodynamics and Cosmology (Oxford: Oxford Univ.
Chapter 2
Near–Infrared Photometry of Early–Type Galaxies
in the Local Universe: Global Photometric
Parameters
Abstract
An imaging survey of 341 nearby early–type galaxies in the the near–infrared K–
band atmospheric window (2.2µm) is described. The survey galaxies were primarily
drawn from 13 nearby rich clusters (85%), with additional galaxies in loose groups
(12%) and the general field (3%). Surface photometry was measured for the entire
sample. Detailed corrections were derived from an extensive grid of seeing–convolved
r1/4 models and then applied to the isophotal surface brightness, aperture magnitude,
and ellipticity profiles. Global photometric parameters were derived from these seeing–
corrected photometry. More than 25% of the sample has been observed at least twice,
and these repeat measurements demonstrate the small internal uncertainties on the
derived global photometric parameters. Extensive comparisons with aperture
photom-etry from the literature demonstrate that the photomphotom-etry is fully–consistent with those
photometric systems to≤0.01 mag and confirm the estimates of internal random
uncer-tainties. Additional global parameters (central velocity dispersion, line indices, optical
surface brightness, effective radii, Dn diameters, and aperture magnitudes) are drawn
from the literature in a homogeneous manner in order to construct a large catalog of
galaxy properties: 95% of the galaxies have a velocity dispersion, 69% have a Mg2index,
80% have an optical reff and hµieff, 82% have aDn, and 81% have a derived optical–
infrared color measurement. This large data set provides excellent source material for
investigations of the physical origins of the global scaling relations of early–type
galax-ies, velocity fields in the local universe, and comparisons to higher redshift early–type
2.1
Introduction
Early–type galaxies form a homogeneous population both in their structure (luminous and
dynamical) and stellar content. The bivariate correlations called the Fundamental Plane
(Dressler et al. 1987; Djorgovski & Davis 1987) among their global properties describes a
systematic sequence of galaxy properties within this population; the small scatter of these
correlations implies a similarly small scatter in early–type galaxy properties throughout
that sequence. While it can be argued (Schechter 1997) that there is no such thing as a
“perfect elliptical galaxy,” there appears to be little influence on the global properties of
early–type galaxies caused by such complicating factors as gas (ionized and neutral), dust,
young stars, or the presence of an ordered disk component. Despite the high frequency of
dust features (van Dokkum & Franx 1995) and ionized gas (Goudfrooij & de Jong 1995)
in the core regions of a large fraction of elliptical galaxies, the small scatter of the optical
FP (Jørgensen, Franx, & Kjærgaard 1996), near–infrared FP (Pahre, Djorgovski, & de
Carvalho 1995), and the color–magnitude relations (Bower, Lucey, & Ellis 1992b) all imply
that the global properties of these elliptical galaxies are relatively unaffected.
As a result of this uniformity of global properties for early–type galaxies, the specific
form of these correlations (slope and intercept) provide insight into the underlying
phys-ical properties such as stellar content (age, metallicity, and initial mass function), mass,
radius, and the distribution of stars and velocities within the galaxy. The color–magnitude
relation—more luminous early–type galaxies are redder than less luminous galaxies—could
be the result of systematic variations in metal abundance, or mean stellar age, or both. The
key question to be addressed by any investigation into the global properties of early–type
galaxies is: what underlying physical properties drive these correlations? A related
ques-tion is immediately raised: what is the distribuques-tion of these underlying physical properties
among the family of early–type galaxies?
The stellar content of early–type galaxies is, in general, enriched in heavy elements to
near–solar abundances, so the integrated optical light in the galaxies is sensitive to the
line–blanketing effects of metallicity. For this reason, optical light may not be a good tracer
of the stellar mass in these galaxies. Near–infrared light at 2.2µm, however, is a good tracer of bolometric luminosity, which in turn varies only weakly with metallicity (for example, in
of the stellar populations is simplified in this bandpass. Near–infrared light is therefore a
good tracer of the stellar mass for early–type galaxies.
Large–scale surveys to study the global properties of early–type galaxies have, in general,
utilized optical light for the photometric properties. A limited number studies stand out
against this trend (Frogel et al. 1975, 1978; Persson, Frogel, & Aaronson 1979; Peletier 1989; Bower, Lucey, & Ellis 1992ab; Silva & Elston 1994; Pahreet al.1995; Ferrarese 1996; Mobasheret al.1997). All but the last four studies used single element aperture photometry
as the source data.
The rapid technological advances of the last decade have produced a series of ever larger
near–infrared imaging detectors with high quantum efficiency, small dark current, low
num-bers of dead pixels, and photometric stability. Compared to optical wavelengths, observing
in the near–infrared has the further advantages that the seeing is better on average,
correc-tions for Galactic extinction are smaller and hence less important, the presence of dust in
the early–type galaxies themselves is virtually irrelevant, and the stellar populations effects
are simpler. There is, however, a strong disadvantage to observing in the near–infrared
from the ground: the sky is much brighter than in the optical. For example, while a typical
sky brightness in the V–band is 21.8 mag arcsec−2, the equivalent sky brightness in the
Ks–band on a cold night is 13.5 mag arcsec−2. Early–type galaxies typically have a color
of (V −K)∼3.2 mag (Persson, Frogel, & Aaronson 1979), hence there is a loss of∼5 mag in the ratio of galaxy to sky surface brightness, equivalent to a loss of a factor of ten in
signal–to–noise ratio. Additionally, the near–infrared imaging detectors are much smaller
(256×256 pixel2 is the current standard format) than modern, large format CCD arrays,
which causes problems as many of the larger galaxies overfill the field–of–view (FOV) with
the smaller detector. Nonetheless, substantial portions of the optical data in the
litera-ture (Djorgovski & Davis 1987; Franx, Illingworth, & Heckman 1989; Colless et al. 1993; Jørgensen, Franx, & Kjærgaard 1995) on early–type galaxies have been taken with a FOV
that is similar to that of most of the near–infrared imaging data (2.6×2.6 arcmin2 in-stantaneous, or 3.5×3.5 arcmin2 after dithering) utilized for the survey described in this
paper.
infrared observations of nearby early–type galaxies, it became apparent that a large, new
survey of early–type galaxy properties using imaging detectors was timely. The survey of
327 early–type galaxies described in this paper is larger by more than a factor of two in the
number of galaxies studied than any previous investigation at 2.2µm. The unusually large number of repeat observations in this survey—more than 120—will establish its internal
homogeneity and reliability, as well as provide reasonable estimates of the uncertainties of
each measured and derived quantity. Many previous studies in the near–infrared (Frogelet
al.1975, 1978; Persson et al. 1979; Peletier et al.1989; Silva & Elston 1994) used samples dominated by nearby, luminous, field elliptical galaxies, while the present survey draws
the bulk of the sample from the cores of rich clusters of galaxies—the special environment
occupied primarily by early–type galaxies. A small number of early–type galaxies in the
field and loose groups have been included in this survey in order to sample a wide variety
of density environments.
The data in this paper comprise a large and homogeneous sample of galaxy
photom-etry suitable for a wide range of follow–up studies. The primary purpose for this study
was to study the wavelength dependence of the slope of the FP correlations in order to
determine the influence of stellar populations parameters in defining the early–type galaxy
sequence. A related issue is the small scatter of the FP in the optical: if it is due to an
age–metallicity “conspiracy,” then the scatter of the near–infrared FP will be large due to
the minimized metallicity effects in the near–infrared bandpass. A comparison between the
global properties of field and cluster early–type galaxies can be investigated on the basis
of this near–infrared photometry, and possible age variations can be constrained between
those two distinct environments. An investigation of the universality of the color–magnitude
relation is possible with these data, as this survey includes galaxies from 13 rich clusters—
compared to only Virgo and Coma in Bower et al. (1992b). The key element to study the optical–infrared color–magnitude relation is to choose galaxies for which high quality
optical photometry already exists in the literature; as is described in §2.2, this was a key
consideration in planning this near–infrared survey. There are only a limited number of
optical–infrared color gradient measurements in the literature (Peletier 1989; Silva &
El-ston 1994), hence this survey will be unique in its potential to derive color gradients for
more than ten times the number of galaxies that have been studied previously. A
and optical deviations of the fitted isophotes from perfect ellipses is a potential tool for
determining if the disks in S0 galaxies could be comprised of a different stellar population
from the bulges. Finally, these survey data provide a nearby galaxy “calibration” for studies
of the near–infrared FP correlations at higher redshifts.
2.2
Description of the Near–Infrared Imaging Survey
The primary scientific goals to be achieved by this near–infrared imaging survey of early–
type galaxies are: (1) to measure the change (if any) in the slope of the FP from the optical
to the near–infrared; and (2) to construct a nearby, near–infrared “calibration” sample for
future FP observations at high redshifts. To these primary goals, several secondary goals
can also be introduced: (3) to measure any changes in the FP (slope and/or intercept)
between cluster and field galaxies; (4) to investigate optical–infrared colors and color
gra-dients which could indicate properties of possible stellar populations gragra-dients and/or dust
distributions; (5) to investigate deviations of the shapes of early–type galaxies from pure
ellipses as indicators of the possible presence of disk structures; (6) to determine if
system-atic errors caused by Galactic extinction corrections are the cause of any particular cases
of peculiar velocities, as the K–band is relatively unaffected by this correction; and (7) to construct models of the structural, kinematical, and stellar content properties of early–type
galaxies as a family which are consistent with all relevant data.
The two primary goals of the project require that a sufficiently large sample be observed,
in order that the slope of the FP can be determined to an accuracy comparable to that
for the optical FP; for example, a total of 226 galaxies in 10 clusters were used by JFK96
in measuring the Gunn r–band FP. In order to reduce the effects of distance uncertainties on the FP distance–dependent parameter, rich clusters with large early–type galaxy
pop-ulations are preferable; in this way, many galaxies at the same distance can be observed.
In order that cluster peculiar velocity effects be minimized, it is necessary to avoid nearby
clusters or at least minimize their proportion within the entire survey. The Coma cluster
galaxies within the central 1 degree2 and Gunn r ≤ 15.3 mag (Jørgensen & Franx 1994). A number of other rich clusters—Perseus, Pisces, Abell 194, Abell 2199, Abell 2199, and
Klemola 44—were chosen to add additional galaxies to the sample, and to determine if there
is any variation of the FP parameters among clusters.
Two nearby clusters—Virgo and Fornax—and five loose groups (Leo, Eridanus, Pegasus,
Cetus, and NGC 5846) were added to the sample, as they have many galaxies that have been
well–studied at many wavelengths. Detailed comparisons of optical–optical and optical–
infrared color gradients are possible for these galaxies. The challenge for interpreting the
FP data derived for these galaxies, however, is that the Virgo cluster has well–known depth
effects (Tonry, Ajhar, & Luppino 1990) including a background W Cloud; Fornax, Leo,
and Eridanus effectively have unresolved depths (Tonry 1991) as derived by the surface
brightness fluctuations method. Nearby galaxy motions are strongly affected by Virgo
infall, and possibly by bulk motion in the direction of the Hydra–Centaurus Supercluster.
The investigation of possible differences in the FP between different clusters, or between
clusters and the field, could be tested in the Hydra–Centaurus region. Large peculiar
velocities were derived for some clusters and field galaxies in this region from the Seven
Samurai survey (Lynden-Bell et al. 1988) which resulted in the identification of a “Great Attractor.”
The galaxy lists were drawn from the literature (Lucey & Carter 1988; Faber et al.
1989; Luceyet al. 1991a; Luceyet al. 1991b; Jørgensen & Franx 1994; Smithet al. 1997),
based on the requirement that there be central velocity dispersion measurements and
op-tical global photometric parameters already measured for survey galaxies. In a significant
number of cases, additional galaxies fell within the detector’s field–of–view which do not
have kinematical and/or optical photometry available in the literature.
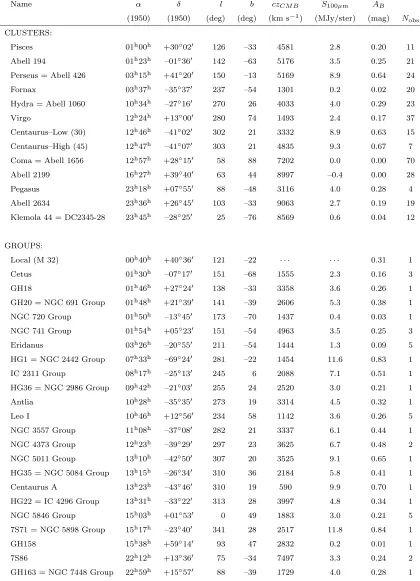
Information on the clusters, groups, and other galaxies included in this survey are listed
in Table 2.1. The location of the survey galaxies on the sky are plotted in Figure 2.1 in
Coma Virgo
Perseus
A2634
A2199
Hydra
Centaurus Leo
Fornax
Klemola 44
Eridanus Pegasus
Pisces
A194 Cetus
N5846grp
Table 2.1: Clusters, Groups and Other Galaxies in the K–band Photometry Survey
Name α δ l b czCM B S100µm AB
(1950) (1950) (deg) (deg) (km s−1) (MJy/ster) (mag) N obs
CLUSTERS:
Pisces 01h00h +30◦020 126 –33 4581 2.8 0.20 11 Abell 194 01h23h –01◦360 142 –63 5176 3.5 0.25 21 Perseus = Abell 426 03h15h +41◦200 150 –13 5169 8.9 0.64 24 Fornax 03h37h –35◦370 237 –54 1301 0.2 0.02 20 Hydra = Abell 1060 10h34h –27◦160 270 26 4033 4.0 0.29 23
Virgo 12h24h +13◦000 280 74 1493 2.4 0.17 37
Centaurus–Low (30) 12h46h –41◦020 302 21 3332 8.9 0.63 15 Centaurus–High (45) 12h47h –41◦070 303 21 4835 9.3 0.67 7 Coma = Abell 1656 12h57h +28◦150 58 88 7202 0.0 0.00 70 Abell 2199 16h27h +39◦400 63 44 8997 –0.4 0.00 28
Pegasus 23h18h +07◦550 88 –48 3116 4.0 0.28 4
Abell 2634 23h36h +26◦450 103 –33 9063 2.7 0.19 19 Klemola 44 = DC2345-28 23h45h –28◦250 25 –76 8569 0.6 0.04 12
GROUPS:
Local (M 32) 00h40h +40◦360 121 –22 · · · · · · 0.31 1
Cetus 01h30h –07◦170 151 –68 1555 2.3 0.16 3
GH18 01h46h +27◦240 138 –33 3358 3.6 0.26 1
GH20 = NGC 691 Group 01h48h +21◦390 141 –39 2606 5.3 0.38 1 NGC 720 Group 01h50h –13◦450 173 –70 1437 0.4 0.03 1 NGC 741 Group 01h54h +05◦230 151 –54 4963 3.5 0.25 3 Eridanus 03h26h –20◦550 211 –54 1444 1.3 0.09 5 HG1 = NGC 2442 Group 07h33h –69◦240 281 –22 1454 11.6 0.83 1 IC 2311 Group 08h17h –25◦130 245 6 2088 7.1 0.51 1 HG36 = NGC 2986 Group 09h42h –21◦030 255 24 2520 3.0 0.21 1
Antlia 10h28h –35◦350 273 19 3314 4.5 0.32 1
Leo I 10h46h +12◦560 234 58 1142 3.6 0.26 5
NGC 3557 Group 11h08h –37◦080 282 21 3337 6.1 0.44 1 NGC 4373 Group 12h23h –39◦290 297 23 3625 6.7 0.48 2 NGC 5011 Group 13h10h –42◦500 307 20 3525 9.1 0.65 1 HG35 = NGC 5084 Group 13h15h –26◦340 310 36 2184 5.8 0.41 1 Centaurus A 13h23h –43◦460 310 19 590 9.9 0.70 1 HG22 = IC 4296 Group 13h31h –33◦220 313 28 3997 4.8 0.34 1 NGC 5846 Group 15h03h +01◦530 0 49 1883 3.0 0.21 5 7S71 = NGC 5898 Group 15h17h –23◦400 341 28 2517 11.8 0.84 1
GH158 15h38h +59◦140 93 47 2832 0.2 0.01 1
7S86 22h12h +13◦360 75 –34 7497 3.3 0.24 2
obs
NGC 7768 (Abell 2666) 23h48h +26◦520 107 –34 7601 4.0 0.28 1
OTHER GALAXIES:
NGC 821 02h05h +10◦460 152 –48 1431 5.9 0.42 1 NGC 2325 07h01h –28◦370 240 –10 2406 6.4 0.46 1 NGC 5812 14h58h –07◦150 350 43 2288 6.7 0.48 1 NGC 6411 17h35h +60◦510 90 33 3641 2.1 0.15 1 NGC 6482 17h50h +23◦050 48 23 3950 7.8 0.56 1 NGC 6702 18h46h +45◦390 75 20 4600 5.0 0.36 1 NGC 6703 18h46h +45◦300 75 20 2244 4.8 0.34 1 NGC 7385 22h47h +11◦210 82 –41 7528 3.7 0.27 1 NOTES:
(1)czgroupis with respect to the CMBR and is taken from Faberet al.(1989).
(2)S100µmis measured from the IRAS 100µm maps.
The Galactic extinction has been calculated from the 100µm emission, under the as-sumption that cool dust emission is a better tracer of dust absorption than neutral hydrogen
gas. The emission at 100µm has been measured for each cluster, group, or galaxy using the IRAS maps. Each measurement typically used samples in a 3×3 grid with internal spacing
of ∼ 5 arcmin. Obvious 100µm sources were excluded visually from the measurements, as some of the nearest early–type galaxies contain a cool dust component and have been
detected at this wavelength (Jura et al. 1987; Goudfrooij & de Jong 1995). The 100µm emission was then converted toABusing the formula from Laureijs, Helou, & Clark (1994):
AB=
S100µm
14±2MJy ster−1 mag. (2.1)
These values of S100µm and AB have been entered into Tables 2.1. The extinction in the K–band are calculated by assuming the Galactic extinction curve of Cardelli, Clayton, & Mathis (1989) withR= 3.05 , resulting inAK = 0.085AB.
These estimates of AB correlate well with those from other studies, although there
appear to be significant departures in the Hydra–Centaurus region. In particular, the
estimate of AB is 0.12 mag larger for the Hydra cluster than in Faber et al. (1989), ∼
0.13 mag larger for the NGC 4373 group and ∼ 0.18 mag larger in Centaurus than in Dressler, Faber, & Burstein (1991). SinceE(V −K) = 0.668AB, the (V −K) color derived
in this paper for galaxies in those regions would have to be corrected by +0.1 mag to agree with the Burstein & Heiles (1982) reddening estimates, but this would create many galaxies
with (V−K)0 that is too red in the final catalog. It is interesting that if theunderestimate
ofABby Faberet al.(1989) in the Hydra–Centaurus is corrected, the galaxies in this region
then have smaller distances and larger peculiar velocities. The origin of this discrepancy
in estimating AB is uncertain, but could be a result of variations in gas–to–dust ratio or
dust size distribution along this Galactic line–of–sight. Future work in this region should
utilize the new IRAS/DIRBE dust extinction maps as constructed by Schlegel, Finkbeiner,
& Davis (1997), which show a significant improvement over the Burstein & Heiles (1982)
Data for this survey were acquired during runs on the 60–inch telescope at Palomar
Obser-vatory, and the 1.0 m Swope and 2.5 m du Pont Telescopes at Las Campanas Observatory.
All instruments used are based on NICMOS–3 256×256 pixel2 HgCdTe arrays
manufac-tured by Rockwell with 40µm pixels. AKs (“K–short”) filter was used in all cases in order
to reduce the thermal background contribution.
The observing sequence was typically three exposures of 60 seconds each (or six
expo-sures of 30 seconds each during the summer months) taken in each of five positions; those
positions were offset in an “X” pattern by 15–30 arcsec in each direction. The total on–
source exposure time was therefore 900 seconds. The nearest early–type galaxies (i.e., in
the Leo I group and the Virgo cluster) used half the total exposure time or 450 seconds.
Sets of exposures on a region of “blank” sky separated 5–15 arcmin away from the target
galaxy were interleaved with the object exposures. Early in the project, the telescope guider
was used during the object exposures in case there were no stacking stars available in the
individual data frames. In time, it became clear that there was virtually always a sufficient
number of usable stacking stars in the frame of each galaxy, so the guider was not used for
the remainder of the survey, which slightly improved the observing efficiency.
Except for the 1993 March observing run at the 2.5 m du Pont Telescope, all of the
observations were calibrated using observations of the new HST K ∼ 11 mag G dwarf standard stars (Persson 1997). A typical photometric night included observations of 5–20
standard stars at up to two or three airmasses. Several observing programs were pursued
concurrently with these instruments so that during non–photometric conditions a backup
project was observed.
2.3.1 Palomar 60–inch Telescope Data
A total of 212 early–type galaxy fields were observed with the near–infrared camera (Murphy
et al. 1995) on the Palomar Observatory 60–inch (P60) Telescope during 27 photometric nights between 1994 October and 1997 August. This instrument uses an all–mirror, 1:1
reimaging Offner design at the f/8.75 Cassegrain focus of the Ritchey–Chretien telescope,
stars in the field of globular cluster Messier 15 with an accurate photographic plate solution
for their coordinates (this list was provided by K. Cudworth to J. Cohen) and shows very
little geometric distortion over the entire FOV. The electronics have an inverse gain of
7.8 e− DN−1 and a read–noise of ∼40 e−. The instrument FOV was limited slightly (by
∼ 3%) during 1994 October due to vignetting caused by misalignment of a cold mask at the telescope focal plane which was subsequently fixed.
On this telescope, the seeing FWHM in the near–infrared varied between 1.0 and 2.5
arc-sec during the course of the survey. In order that the survey be conducted in a way that a
more similar resolution in physical units be obtained, it was decided to observe the higher redshift galaxies during times of optimal seeing. The result of this decision was that many
of the nearest galaxies, such as in the Leo I Group or the Virgo cluster, were imaged under
the worst seeing conditions. The advantage of this decision was that the seeing corrections
would be manageably small in the Coma cluster—the top priority cluster for the study—as
well as in the Virgo cluster.
The data acquired from this telescope form∼50% of the entire survey data. The Virgo,
Coma, Abell 194, Abell 2199, Abell 2634, Perseus, Pisces, and Pegasus clusters, the Leo I
and Cetus groups, M 32, and many of the “field” galaxies were imaged with this telescope.
2.3.2 Las Campanas 1.0 m Swope Telescope Data
Observations at the Las Campanas 1.0 m Swope Telescope (C40) were made during two
runs, each using a different near–infrared imaging camera.
The instrument described by Persson et al. (1992) was used during four photometric
nights in 1995 March (the same instrument was also mounted on the Las Campanas 2.5 m
telescope for the runs described in§2.3.3) to obtain 45 images of galaxies primarily in the
Hydra–Centaurus Supercluster region. The instrument was mounted at the standard f/7
focus of the telescope and used in “medium resolution” mode, producing a 0.920 arcsec project pixel size and a 236 ×236 arcsec2 instantaneous FOV. The seeing FWHM was typically significantly undersampled with the large pixel size. The electronics have an
inverse gain of 4.8 e− DN−1 and a read–noise of∼40 e−.
Observations were obtained in 1995 October–November on the same telescope using a
new near–infrared camera which is nearly identical with that used on the P60 and described
of 154×154 arcsec2. As for the P60 instrument, the electronics have an inverse gain of 7.8 e− DN−1 and a read–noise of ∼ 40 e−. A total of 32 galaxy images were obtained primarily in the Fornax cluster and the Eridanus group during three photometric nights.
The seeing was typically marginally–sampled for these data at 1.0–1.3 arcsec FWHM.
2.3.3 Las Campanas 2.5 m du Pont Telescope Data
Observations were obtained during six photometric nights in 1993 March and three
photo-metric nights in 1994 December using the near–infrared camera (Perssonet al.1992) on the Las Campanas 2.5 m du Pont Telescope (C100). The “medium resolution” mode was used
producing a projected pixel size of 0.348 arcsec and an instantaneous FOV of 89×89 arcsec2. The electronics for this instrument have an inverse gain of 4.8 e− DN−1 and a read–noise
of ∼ 40 e−. A total of 53 images of 38 different galaxies were obtained during the two
observing runs.
These data were acquired for a different observing program on near–infrared surface
brightness fluctuations. The 1993 March data of nine Virgo cluster elliptical galaxies are
described by Pahre & Mould (1994), while in 1994 December the Fornax cluster was the
primary target. The different science goal for this program resulted in much longer exposure
times than the rest of the survey, typically between 1000 and 3000 seconds; when coupled
with the larger telescope aperture, these images reach much fainter flux limits than the C40
or P60 data. The smaller FOV of this instrument, however, causes the sky–subtraction to
be far more problematical than for the rest of the survey—since the galaxies imaged with
this instrument have the largest angular sizes in the survey.
2.3.4 Data Reduction
All of the data were reduced within the IRAF environment using scripts written by the
author (or E. Persson) for near–infrared data reductions with these instruments. The basic
procedure consisted of: (1) correcting for non–linearity; (2) subtracting an appropriate
dark frame; (3) flat–fielding, using either a dome flat, a twilight sky flat, or a dark sky flat;
(4) subtraction of an appropriately normalized sky frame; (5) flagging of bad pixels; (6)
common to all frames of a given galaxy; and (8) averaging of all the data frames using a
sigma–rejection algorithm into a single stack.
The choice of flat–field was investigated in detail. There was no statistically–significant
variation between choices of dome, twilight, or dark sky flats on the resultant photometry.
In some cases, due to substantial changes in airmass during a galaxy observing sequence, a
dark sky flat was the only method to produce low noise. The choice was usually made for
a night based on visual inspection of the final, stacked data.
There are several important issues regarding the subtraction of a sky frame which need
to be addressed. First, the sky varies sufficiently on the order of 5–25 DN pixel−1 (out of a typical sky value of 1–1.5×10⁴DN pixel−1—even during the photometric conditions used for this survey—on times faster than the exposure time (i.e.,<30 second). It is apparent that these sky frames would not be sufficient to determine the absolute sky level on the object
frames. Second, the largest galaxies (25–50% of the galaxies) have extents that overfill the
detector FOV such that the absolute sky level on the object frames cannot be determined
from the frames themselves. The combination of these two issues causes a fundamental
problem for near–infrared imaging of extended objects: the absolute sky level will need to
be estimated during the analysis in a more sophisticated manner. Subtraction of sky in a
more accurate manner using the surface brightness profiles themselves will be discussed in
§2.4.
2.3.5 Photometric Calibration
With the exception of the C100 run in 1993 March, the new HST standard star list of
Persson (1997) was used for calibration for the entire survey. For the C100 run, the faint
UKIRT standards (Casali & Hawarden 1992) were used. Between five and 20 standard
stars were typically observed on a photometric night or partial night at up to two (or
sometimes three) airmasses. Each standard was usually placed at five different places on
the array for each measurement. The atmospheric extinction coefficient was measured for
each night separately; for some runs, the coefficient and zero–points were determined to be
stable for several consecutive nights, allowing for the extinction to be measured for all such
nights simultaneously. More the 85% of the nights had rms≤0.02 mag, while >40% had rms ≤0.01 mag for the standard star measurements.
standard Johnson K filter, but also has a bluer effective wavelength—there is expected to be a color term between the hotter standard stars and the cooler K giant stars which dominate the near–infrared light of early–type galaxies. This color term will be in the
sense that the Ks magnitudes will be measured too faint relative to the K magnitudes.
Furthermore, the near–infrared light in early–type galaxies is dominated by late–type giant
stars (Frogel 1971), hence there is significant absorption at rest–frame λ >2.29µm due to the onset of the CO bandhead. This absorption will affect K magnitudes more than Ks
magnitudes, in the sense that the Ks magnitudes will be measured too bright relative to
theK magnitudes.
No correction has been applied to the photometry of this survey to account for these
color differences, but they will be applied in all comparisons with observations through
standard K filters from the literature. These terms can be estimated using simple stellar populations models. Using the Worthey (1994) model for [Fe/H] = 0 dex and 11 Gyr,
k–corrections have been derived for bothKs and K filters using the definition adopted by
Mayall, Humason, & Sandage (1956), i.e., mtrue(z) =mobs(z)−k(z). Atmospheric effects
and detector sensitivity are assumed constant across the filter bandpass. These are displayed
in Figure 2.2. A simple polynomial fit (rms = 0.002 mag) to the Ks–bandk–correction for z≤0.05 is
kKs(z) =−3.83z+ 21.9z
2. (2.2)
TheK–bandk–correction was also calculated and is reasonably consistent with that derived by Persson, Frogel, & Aaronson (1979) for z ≤0.025, i.e.,kK(z) =−3.5z. The combined
effect of the calibration due to the use of G dw