Research Article
SOLUBILITY ENHANCEMENT OF GLICLAZIDE BY SOLID DISPERSION METHOD
SMITA D. MORE, SNEHA B. SONTAKKE
P.E.S’s, Modern College of Pharmacy (For Ladies), Moshi, Pune-412105, Maharashtra, India. Email: [email protected]
Received: 7 September 2013, Revised and Accepted: 28 September 2013
ABSTRACT
In the present research work, an attempt was made to improve the solubility and dissolution rate of a poorly soluble drug, Gliclazide by solid dispersion method using soluplus and kollidon VA64 as a carrier and PEG 4000, sorbitol, cremophor EL as a plasticizer. Evaluation of solid dispersion i.e. in vitro- dissolution, differential scanning calorimetry (DSC), Fourier transform infrared (FTIR), X-ray diffraction (XRD) was performed. The solid dispersion of KollidonVA64 and PEG 4000(1:1) showed the best cumulative drug release (72.16±2.01). The solid dispersions were then formulated as tablets and were subjected to various preformulation and post formulations studies. The evaluation of tablet batches i.e. hardness, friability, drug content, in vitro release, and stability parameters have been studied. After the evaluation of all batches, the F4 batch shows the best cumulative release (95.57±1.25%). From this study, it can be concluded that dissolution rate of gliclazide
could be enhanced by tablets containing solid dispersion by direct compression technique.
Keywords: Gliclazide, Solid Dispersion, Fusion Method, Plasticizer.
INTRODUCTION
40 percent of new chemical entities discovered by the pharmaceutical industry today are poorly soluble or lipophilic compounds. The solubility issues complicating the delivery of these new drugs also affect the delivery of many existing drugs.[1] The enhancement of oral bioavailability of such drugs, whose solubility is poor, remains one of the most challenging aspects of drug development.[2]
Solubility: The term ‘solubility’ is defined as maximum amount of solute that can be dissolved in a given amount of solvent. Quantitatively it is defined as the concentration of the solute in a saturated solution at a certain temperature. In qualitative terms, solubility may be defined as the spontaneous interaction of two or more substances to form a homogenous molecular dispersion[3].
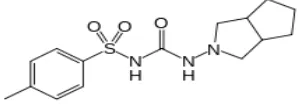
Gliclazide N-(hexahydrocyclopenta[c]pyrrol-2(1H)-ylcarbamoyl)-4 methyl benzene sulfonamide is an antidiabetic agent used for control of hyperglycemia in GLZ-responsive diabetes mellitus of stable, mild, non-ketosis prone, type 2 diabetes.
Figure 1: It shows the structure of Gliclazide
GLZ is a BCS class II drug with low solubility and high permeability characteristics. It is practically insoluble in water having a molecular weight of 323.412 g/mol and shows good permeability with log P of 2.6. It also exhibits pH dependant solubility and 94% plasma protein binding.[4,5,6] But the aqueous solubility and poor dissolution of the drug remains a problem for the required therapeutic effect. This solubility benefit can be further enhanced by preparing solid dispersion.
Solid Dispersion: Chiou and Reigelman first by defined solid
dispersion in 1971 as dispersion of one or more active ingredients in an inert carrier or matrix at solid state prepared by fusion, solvent or melting solvent method.[7]
Solid dispersions have attracted considerable interest as a mean of improving the dissolution rate, hence possibly bioavailability of a range of hydrophobic drugs.
OBJECTIVES OF THE STUDY:
The objectives of the present study include:
In the present work attempts will be made to improve the bioavailability of poorly water soluble antidiabetic drug by solid dispersion method. Determine the effect of change in polymer and
plasticizer composition and drug-polymer ratio on solubility.
Study of in vitro dissolution kinetics of the drug from the formulated solid dispersion systems in a tablet form.
To compare the release profile with the existing marketed products.
MATERIALS AND METHODS
Materials
Gliclazide was procured from Gen Pharma Pvt. Ltd., Bhosari, Pune. The polymers Soluplus, KollidonVA64, Cremophor EL From BASF India Ltd, Mumbai and all the other ingredients used were procured from college source.
Methods
Determination of solubility
10ml of the distilled water was taken in conical flasks and an excess quantity of GLZ was added to these and shaken for 24 hrs by using mechanical shakers. At the end of 24 hrs period, the solution was filtered through whatman filter paper and the filtrate was suitably diluted with distilled water and the aqueous solubility was estimated spectrophotometrically at λ max of 226nm.[8]
Preparation of Physical Mixtures (PM)
Preparation of the Solid Dispersions (SD) using Fusion Method
Solid dispersions (SD) were prepared by melting the accurately weighed amounts of polymer and plasticizer on heating mantle and the drug was dispersed in the molten solution. The mixtures were stirred repeatedly, after 10 min cooled by placing the petridish for 15 min in an ice bath. Solid mass obtained was passed through the # 80 and stored in vacuum desiccator until use.[10,11,12,13]
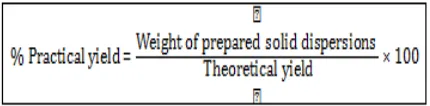
Table 1: It shows the formula for the preparation of GLZ Solid Dispersion Quantity of solid dispersion and excipients were weighed accurately as mentioned in Table 8.The solid dispersion was mixed with the excipients and then it was blended for 10 minutes to get the blend uniformity. The tablets of 170 mg were compressed using 9 mm concave punch and with 8 station tablet machine.[14,15]
Evaluation of Solid Dispersion
Solubility Studies of Solid Dispersions
Solubility determinations were performed in triplicate according to the method of Higuchi and Connors (Higuchi and Connors, 1965). In brief, an excess amount of solid dispersion was taken into the conical flask to which 10 ml of distilled water were added. The samples were shaken at room temperature for 24 hr on the rotary shake and filtered through a whatman filter paper. The filtrate was suitably diluted and analyzed spectrophotometrically at the wavelength of 226 nm using a UV-VIS spectrophotometer.[16,17]
Table 2: It shows the formula for the preparation of GLZ tablets
Ingredients F1 F2 F3 F4 F5 F6 with the paddle rotating at 100 rpm in 900 ml phosphate buffer (pH 7.4) at 37±0.5oC. SDs equivalent to 80 mg of GLZ were taken for the dissolution test. At 5 min intervals, 5 ml samples were withdrawn, filtered through a whatman filter paper and assayed for cumulative drug release by measuring the absorbance at 226 nm using UV-Visible spectrophotometer. Fresh medium (5 ml) was added to the dissolution medium after each sampling to maintain a constant volume throughout the test.[18]
Drug Content
A quantity of solid dispersion equivalent to 80 mg of GLZ was accurately weighed and dissolved in phosphate buffer (pH 7.4) in a 100 ml volumetric flask. Then the volume was made up to 100ml with phosphate buffer (pH 7.4). From this serial dilution were made with pH 7.4. The absorbance of the resulting solution was measured.[19] optimized formulation was charged for the accelerated stability studies according to ICH guidelines (40 ± 2ºC and 75 ± 5% RH) for a period of 1 month in a stability chamber. The optimized formulations were placed in amber colored bottles. The samples
were withdrawn at 15, 30days and evaluated for the drug content and in vitro drug release.[21]
Fourier-transform infrared (FTIR) spectroscopy
FT-IR spectra were recorded using an FT-IR spectrophotometer.[22,23] The samples were previously ground and mixed thoroughly with potassium bromide, an infrared transparent matrix, at 1:5 (Sample: KBr) ratio, respectively. The KBr discs were prepared by compressing the powder. Scans were obtained at resolution of 4cm-¹ from 400 to
4000cm-1.
Powder X-ray diffraction spectroscopy
The crystalline state of different samples was evaluated with X-ray powder diffraction. Powder X-X-ray diffraction patterns of pure drug, carriers, solid dispersions and corresponding physical mixtures were recorded using a powder x-ray diffractometer.[24] The scanned range was 0- 50°
DSC Analysis
The DSC thermograms were recorded for pure drug, carriers and corresponding solid dispersions using a differential scanning calorimeter. Approximately 2-5mg of each sample was heated in an open aluminum pan from 10-350°C at a scanning rate of 10°C/min under steam of nitrogen.[25]
Evaluation of Tablets
In-vitro dissolution studies
Determination of Drug Content
Ten tablets were weighed and taken in mortar and crushed to make powder. A quantity of powder weighing equivalent to 80 mg GLZ of was taken in 100 ml volumetric flask and phosphate buffer pH 7.4 was added. Then the solution was filtered using whatman filter paper and then the solution was diluted up to 10μg and absorbance was measured. Then the amount of drug present was calculated.[27]
Weight variation
Twenty tablets were selected randomly and the average weight was determined. Then the individual tablets were compared with the average weight. The limit for weight variation was kept at ± 3%.[28]
Friability
The friability test was done with a Friabilator. Ten tablets were weighed and subjected to the combined effect of attrition and shock by utilizing a plastic chamber that revolved at 25 rpm and dropped the tablets from a distance of 6 inches with each revolution. After 100 revolutions, the tablets were dusted and reweighed. The percentage friability was calculated from the loss in weight of intact tablets.[29]
Hardness
Twenty tablets were randomly selected from formulations and thickness was measured individually by Screw gauge. It was expressed in millimeter.[31]
Disintegration time
The disintegration time was determined using disintegration test apparatus. A tablet was placed in each of the six tubes of the apparatus and one disc was added to each tube. The time in seconds taken for complete disintegration of the tablet with no palatable mass remaining in the apparatus was measured in seconds.
Stability study
GLZ tablets were packed in aluminum foil and subjected to the stability studies as per the ICH guidelines 40°C/75% RH. The tablets were analyzed for the drug release and were tested after 15, 30 days of storage time points.
Drug release kinetics
In order to understand the mechanism and kinetics of drug release, the results of the in vitro drug release study were fitted with various kinetic equations like zero order (cumulative percent drug released vs. Time), first order (Log cumulative percent drug retained vs. Time), Higuchi (cumulative percent released vs. √T), Peppas (log of cumulative percent drug released Vs. log Time) and Hixson- Crowell’s cube root model ((Percentage Retained) 1/3 Vs. Time). The kinetic model that best fits the dissolution data was evaluated by comparing the regression coefficient (r) values obtained in various models. Peppas model used ‘n’ value to characterize different release mechanisms. The values of n = 0.5 for Fickian diffusion, between 0.5 to 1.0 for non-Fickian diffusion and n = 1 for zero order.[32, 33]
RESULT AND DISCUSSION
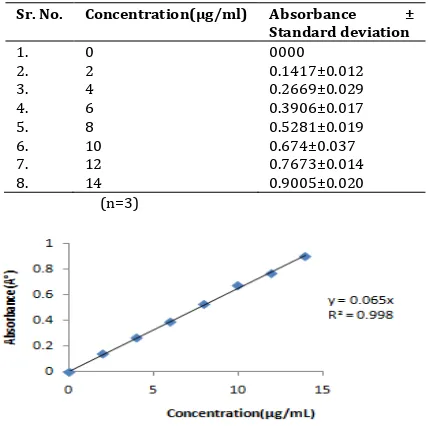
Calibration curve in phosphate buffer pH 7.4
Calibration curve of GLZ in phosphate buffer (pH 7.4) was carried out. Table 3 shows the concentrations of GLZ in phosphate buffer (pH 7.4) and the respective absorbance. Figure 2 shows the standard graph of GLZ in phosphate buffer (pH 7.4)
Table 3: It shows the standard Calibration Curve Data of GLZ in 7.4 Phosphate Buffers
Sr. No. Concentration(µg/ml) Absorbance ±
Standard deviation given in table 4. The solubility of SD-1 was 34.21±0.59µg/ml and that of SD-4 was 37.77±0.96 µg/ml. The solubility of pure GLZ was found to be 16.51±0.26µg/ml which was less than that of SD.
Table 4: It shows the phase solubility studies data Solubility of GLZ (µg/ml)
Sr. No. Formulation Code Solubility (µg/ml)
1. Pure drug 16.51±0.26
Drug Content
The drug content of solid dispersion containing kollidonVA64 and PEG 4000 as a carrier was found to be in the range of 99.74±0.08.
Table No.5: It shows the drug Content of solid dispersion
Batches Drug Content (%)
SD-1 99.81±0.35 SD-2 98.34±0.84 SD-3 98.14± 0.76 SD-4 99.74±0.08 SD-5 97.64±1.06 SD-6 99.71±0.06
Dissolution Studies
The dissolution profiles of pure GLZ and SD are shown in following figures. The dissolution profile of the pure GLZ showed 60.83±1.92 release in 120 min. Solid dispersion of soluplus and PEG 4000 (SD-1) showed 70.58±0.94 release in 120 min and that of kollidonVA64 and PEG 4000(SD-4) showed 72.16±2.01 release in 120 min. Cumulative drug release was found to be highest for SD of kollidonVA64 and PEG 4000 (SD-4) than the pure drug and other SD under investigation.
Table 6: It shows the in- Vitro dissolution data for GLZ: Soluplus solid dispersion
Time (min)
%Cumulative Drug Release
GLZ SD1 SD2 SD3
5 22.3±0.18 35.66±1.23 22.95±0.92 28.61±0.58 10 31.52±0.62 40.59±0.89 23.18±0.42 31.26±0.46 15 39.27±0.86 45.92±0.46 25.45±0.84 35.71±0.16 20 44.88±0.46 50.26±0.94 31.29±0.38 42.29±0.73 30 45.26±0.59 54.39±0.38 49.91±0.64 56.97±1.76 45 48.95±0.94 63.18±0.56 55.99±0.56 59.5±1.58 60 50.28±0.61 65.47±0.84 61.84±1.09 59.66±0.21 90 54.26±1.03 69.45±0.16 65.14±0.78 61.85±0.52 120 60.83±1.92 70.58±0.94 66.45±0.48 67.91±0.31 (n=3)
Figure 4: It shows the dissolution profile of GLZ: Soluplus formulations in phosphate buffer pH 7.4
Figure 5: It shows the dissolution profile of GLZ: KollidonVA64 formulations in phosphate buffer pH 7.4
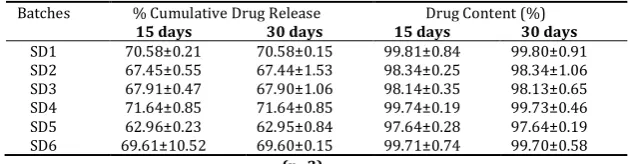
Stability study
The optimized formulation (SD-4) did not show any significant change in the drug content during stability study.
Table 7: It shows the in- Vitro dissolution data for GLZ: KollidonVA64 solid dispersion
Time %Cumulative Drug Release
(min) GLZ SD4 SD5 SD6
5 22.3±0.18 32.56±0.47 31.63±20.85 21.75±0.41 10 31.52±0.62 42.59±0.16 32.28±0.85 24.68±1.25 15 39.27±0.86 55.35±0.24 35.15±0.40 25.15±1.13 20 44.88±0.46 64.53±1.64 49.2±0.35 36.1±1.45 30 45.26±0.59 65.65±1.26 59.6±0.17 49.16±0.24 45 48.95±0.94 67.48±0.17 59.9±0.67 52.4±0.42 60 50.28±0.61 69.27±0.56 60.91±0.94 55.22±0.81 90 54.26±1.03 70.43±0.58 62.45±1.03 66.86±0.73 120 60.83±1.92 72.16±2.01 62.96±2.16 69.61±1.02
(n=3)
Table 8: It shows stability study data of solid dispersion
Batches % Cumulative Drug Release Drug Content (%)
15 days 30 days 15 days 30 days
SD1 70.58±0.21 70.58±0.15 99.81±0.84 99.80±0.91
SD2 67.45±0.55 67.44±1.53 98.34±0.25 98.34±1.06
SD3 67.91±0.47 67.90±1.06 98.14±0.35 98.13±0.65
SD4 71.64±0.85 71.64±0.85 99.74±0.19 99.73±0.46
SD5 62.96±0.23 62.95±0.84 97.64±0.28 97.64±0.19
SD6 69.61±10.52 69.60±0.15 99.71±0.74 99.70±0.58
(n=3) X-Ray Diffraction
The diffraction spectrum of pure GLZ showed that the drug is of crystalline nature as demonstrated by numerous peaks observed at 2θ of 10.7, 15.2, 17.1, 18.2, 21.1 and 22.4 in finger print region. Some peaks shown by pure GLZ were also found
of 10.7, 18.2, 21.1 22.3 and the physical mixture at 10.8, 15.2, 17, 18.1, 21.1, 22.4. The results indicated that the drug in solid dispersion was present in an amorphous state.
Figure 6: It shows the X- ray diffraction pattern of GLZ, solid dispersion and physical mixture
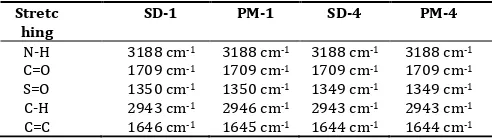
FTIR spectroscopy
Fourier-transform infrared (FT-IR) spectroscopy was used to characterize possible interactions between the drug and the carrier in solid state. The IR spectra of SDs and PMs are compared with the standard spectrum of GLZ. The IR spectrum of GLZ was characterized by the absorption of carbonyl (C=O) sulphonyl urea group and NH group at 1706 cm-1and 3265 cm-1,
respectively. For the sulphonyl group bands, the spectrum showed stretching peak at 1164 cm-1 and 1350 cm-1(Table 9).
The shift in the peaks associated with the GLZ indicates an increase in bond strength, possibly due to the stabilizing effect of the hydrogen atoms of PEG. This may be attributed to the intermolecular hydrogen bonding between GLZ and PEG in the solid state.
Table 9: It shows the stretching vibrations of solid dispersion and physical mixture
Stretc hing
SD-1 PM-1 SD-4 PM-4
N-H 3188 cm-1 3188 cm-1 3188 cm-1 3188 cm-1
C=O 1709 cm-1 1709 cm-1 1709 cm-1 1709 cm-1
S=O 1350 cm-1 1350 cm-1 1349 cm-1 1349 cm-1
C-H 2943 cm-1 2946 cm-1 2943 cm-1 2943 cm-1
C=C 1646 cm-1 1645 cm-1 1644 cm-1 1644 cm-1
Figure 7: It shows the infrared spectrum of solid dispersion and physical mixture
DSC Analysis
The DSC curve of pure GLZ exhibits a single endotherm corresponding to the melting of the drug. The onset of melting was observed at 173.77 °C, and the corresponding heat of fusion (H) is 284.4750 J/g. A slight difference was evident in the thermograms of the physical mixture and solid dispersion. The complete disappearance of GLZ melting peak observed in both PM and SD was attributable to the complete miscibility of the drug in the melted carrier. The enthalpy of melting of drug in solid dispersion was gradually decreased compared to the drug (ΔHf: 284.4750 J/g). This phenomenon could be attributed to the amorphous form of the drug in solid dispersion. It suggesting that GLZ is completely soluble in the liquid phase of the polymer or that the crystalline nature of GLZ is absent.
Table 10: It shows DSC data of GLZ, solid dispersion and physical mixture
Formulation code Peak(°C) ΔH (J/g)
GLZ 173.77 284.47
SD-1 89.86 30.91
PM-1 140.54 26.95
SD-4 130.89 79.73
Figure 8: It shows the DSC thermogram of GLZ, solid dispersion and physical mixture
Evaluation of Tablets
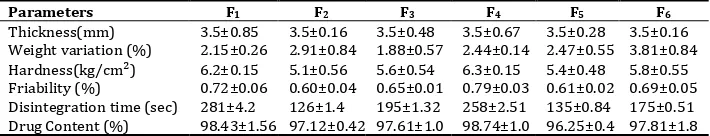
Pre-compression parameteres
The Pre-compression parameteres of GLZ tablets were given in the table 10. The thickness of the tablet was found to be 3.5 mm. The average weight of the prepared tablet was between 168 to 172 mg. So, it was predicted that all the tablets exhibited uniform weight with low standard deviation values within the acceptable variation as per IP. The hardness of the prepared tablet varied from 5.0 to 6.9 kg/cm 2, which has satisfactory
strength to withstand the applied mechanical shocks. The friability of all the formulations was found to be less than 1.0%, which shows the durability of the prepared tablets; resistance to loss of weight indicates the tablets ability to withstand abrasion in handling.
In-vitro dissolution studies
The dissolution profiles of GLZ tablets as compared to marketed tablet. Dissolution studies were carried out in phosphate buffer pH 7.4. In 120 min, cumulative % drug release from F1, F2, F3
batches of tablet was 42.29±0.99, 25.88±0.68, 33.45±0.94 respectively, while F4, F5, F6 batches of tablets showed
95.57±1.25, 81.94±0.89, 86.49 ±1.22 respectively. The marketed tablet shows release of 98.98±0.62 in 120 min. Drug dissolved at specific time periods was plotted on cumulative percent release versus time (min) curves.
Table 10: It shows the pre-compression parameteres of GLZ tablets
Parameters F1 F2 F3 F4 F5 F6
Thickness(mm) 3.5±0.85 3.5±0.16 3.5±0.48 3.5±0.67 3.5±0.28 3.5±0.16 Weight variation (%) 2.15±0.26 2.91±0.84 1.88±0.57 2.44±0.14 2.47±0.55 3.81±0.84 Hardness(kg/cm²) 6.2±0.15 5.1±0.56 5.6±0.54 6.3±0.15 5.4±0.48 5.8±0.55 Friability (%) 0.72±0.06 0.60±0.04 0.65±0.01 0.79±0.03 0.61±0.02 0.69±0.05 Disintegration time (sec) 281±4.2 126±1.4 195±1.32 258±2.51 135±0.84 175±0.51 Drug Content (%) 98.43±1.56 97.12±0.42 97.61±1.0 98.74±1.0 96.25±0.4 97.81±1.8
Table 11: It shows the in- Vitro dissolution data for GLZ: Soluplus tablets with the marketed tablet
Time (min)
%Cumulative Drug Release
F1 F2 F3 Marketed
5 15.23±0.34 6.69±0.37 12±0.55 25.83±1.68
10 17.39±0.86 9.02±0.69 20.6±0.63 28.52±1.61 15 18.64±0.94 12.53±0.56 21.41±0.49 46.68±1.28 20 18.85±1.48 13.58±0.43 21.45±0.51 48.51±1.51 30 19.9±0.81 18.45±0.75 21.7±0.63 53.16±1.08 45 20.12±0.93 20.45±1.91 21.76±0.18 59.63±0.96 60 29.93±0.76 21.48±1.78 23.72±0.34 79.57±0.81 90 36.78±0.64 22.99±0.75 25.7±0.92 92.7±0.46 120 42.29±0.99 25.88±0.68 33.45±0.94 98.98±0.62
(n=3)
Figure 21: It shows the dissolution profile of GLZ: soluplus tablets
Table 12: It shows the in- Vitro dissolution data for GLZ: KollidonVA64 tablets with the marketed tablet
Time (min)
%Cumulative Drug Release
F4 F5 F6 Marketed
5 23.06±0.28 22.15±0.73 19.6±1.45 25.83±1.68 10 29.89±0.31 24.35±0.29 34.72±1.86 28.52±1.61 15 36.98±0.63 31.64±0.23 41.38±0.25 46.68±1.28 20 44.15±0.84 33.42±0.43 43.68±1.64 48.51±1.51 30 47.23±0.15 39.35±0.27 45.22±0.37 53.16±1.08 45 51.49±0.71 45.84±0.53 49±0.95 59.63±0.96 60 77.39±1.46 51.35±0.36 61.9±0.46 79.57±0.81 90 85.43±1.94 68.25±0.79 77.07±1.68 92.7±0.46 120 95.57±1.25 81.94±0.89 86.49±1.22 98.98±0.62
(n=3)
Drug release kinetics
When the data were fit into various kinetic models, it was found that the matrix model is the best fit model for all. Table 13 shows the kinetic model fitting for the drug release data. The F1
fits in to Hixson-Crowell release kinetic model and the F4 fits in
to the Korsmeyer- Peepas kinetic model.
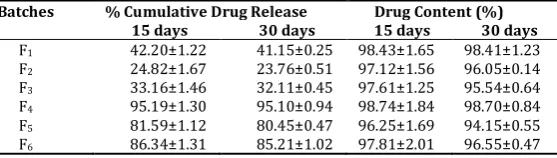
Stability study
The formulation did not show any significant change in the drug release and drug content during stability study.
Table 13: It shows the kinetics of in vitro Release of GLZ tablets
Formulation Code R2 value ‘n’ value
Zero order First order Higuchi Higson-Crowell Peepas
F1 0.857 0.393 0.929 0.956 0.834 0.3634
Table 14: It shows the stability data of GLZ tablets
Batches % Cumulative Drug Release Drug Content (%)
15 days 30 days 15 days 30 days kollidonVA64, PEG 4000, sorbitol, cremophor EL was used in the preparation of solid dispersion of GLZ to increase its dissolution. The formulations were prepared at different ratios of drug and polymers and plasticizers. In vitro dissolution studies have shown significant increase in the dissolution of GLZ when PEG 4000 was used as a plasticizer in the preparation of solid dispersion. Sorbitol and cremophor EL also enhanced the solubility of GLZ as compared to the pure drug. The SD-4 was found to be the optimized formulation out of all the SD. On the contrary, the present study has shown that dissolution rate of the solid dispersion by fusion method was highest than by physical mixing method.
When solid dispersion was administered to rats orally, the maximum plasma concentration of GLZ significantly increased compared to pure drug. This suggested that solid dispersion could improve both the dissolution rate and bioavailability of a poorly water soluble drug GLZ.
IR spectra indicated no well-defined interaction between the drug and polymer. DSC thermograms of physical mixture and solid dispersion indicated complete miscibility of the drug in melted carrier. Amorphous nature of the drug in solid dispersion was confirmed by a decrease in enthalpy of drug melting in solid dispersion compared to the pure drug. XRD analysis indicated a reduction in drug crystalline nature in solid dispersion.
The tablets were successfully prepared by direct compression method. The tablets prepared by drug and kollidonVA64 in combination with PEG4000 (SD-4) was found to be the optimized, shows higher dissolution rate compared with the other tablets.
ACKNOWLEDGEMENT
Authors are thankful to Modern College of Pharmacy (for Ladies) for giving us the opportunity and providing required necessary facilities to work on this topic. A special thanks to Gen Pharma Pvt. Ltd., Bhosari, Pune, for providing the drug sample
of Gliclazide and also the BASF Ltd., Mumbai, for providing the various polymers.
REFERENCES
1. Kumar BP, Rao S, Murthy KVR, Sahu RK, Ramu B. Solid dispersion technique: A tool for enhancing bioavailability of poorly soluble drugs. Journal of Chemical and Pharmaceutical Sciences 2011; 4(4): 170- 179.
2. Verma S, Rawat A, Kaul M, Saini S. Solid dispersion: A strategy for solubility enhancement. International Journal of Pharmacy and Technology 2011; 3(2): 1062-1099. 3. Patidar K, Kshirsagar MD, Saini V, Joshi PB, Soni M. Solid
Dispersion Technology: A Boon for Poor Water Soluble Drugs. Indian Journal of Novel Drug delivery 2011; 3(2): 83-90.
4. Indian Pharmacopoeia 2010, Government of India, Ministry of Health and Family Welfare, Published by The Indian pharmacopoeia Commission Ghaziabad, Volume-II, 6th edition:1416-1418.
5. British Pharmacopoeia 2008, Published by stationary offices on behalf of MHRA, Volume- I, 5th edition:
999-1000.
6. www.drugbank.com
7. Dhirendra K, Lewis S, Udupa N, Atin K. Solid Dispersions: A Review. Pakistan Journal of Pharmaceutical Sciences 2009; 22(2):234-246.
8. Iquebal T, Hussain T, Panigrahi R. Enhancement of Solubility for Risperidone Fast Dissolving Tablets. International Journal of Universal Pharmacy and Life Sciences 2012; 2(3): 396- 408.
9. Kumar S, Gupta SK, Sharma PK. Dissolution Rate Enhancement of Aceclofenac by Solid Dispersion Technique. Asian Journal of Pharmacy and Life Science 2011; 1 (4): 396-400.
10. Kulkarni PK, Dixit M, Panner S, Jain Achin. Preparation and Evaluation of Naproxen solid Dispersion Technique. International Research Journal of Pharmacy 2012; 3(9): 174-177.
11. Dua K, Pabreja K, Ramana MV. Preparation, Characterization and In Vitro Evaluation of Aceclofenac Solid Dispersions. ARS Pharm 2010; 51 (1): 57-76. 12. Saffon N, Jhankar YM, Huda NH. Dissolution Profile of
Polymers and Sugar by Fusion Method. Stamford Journal of Pharmaceutical Sciences 2011; 4(1): 31-37.
13. Kumar VR, Sevukarajan M, Vulava J, Pavankumar AG, Deepthi Y, Manjunath M, Anand A. Improvement of Dissolution Characteristics and Bioavailability of Tadalafil by Solid Dispersion Technique Using Water-Soluble Polymers. International Journal of Advanced Pharmaceutics 2012; 2(2): 56- 63.
14. Varma MM, kumar PS. Formulation and Evaluation of GLZ Tablets Containing PVP K30 and Hydroxyl Propyl Beta Cyclodextrin Solid Dispersion. International journal of pharmaceutical sciences and nanotechnology 2012; 5(2):1706-1719.
15. Habeeba P, Madhavanb N, Gladisa K, Anithaa Y, Mohammedc S, Raghunathc P. Formulation, Optimization and Evaluation of Solid Dispersion Tablets of Aceclofenac Using Kollidon 30. International Journal of Biopharmaceutics 2013; 4(1): 10-17.
16. Panigrahi R, Behera SP,.Murthy PN. Enhancement of Solubility of Gliclazide by Solid Dispersion. International Journal of PharmTech Research 2011; 3(2): 1118-1124. 17. Ibrahim EH, El-Faham TH, Mohammed FA, El-Eraky NS.
Enhancement of Solubility and Dissolution Rate of Domperidone by Utilizing Different Techniques. Bull. Pharm. Sci 2011; 34(2): 105-120.
18. Gupta S, Ranawat MS. Effect of Hydrophilic Polymers on Solubility Enhancement of Oral Antidiabetic Agent by Solid Dispersion Technique. Asian Journal of Biochemical and Pharmaceutical Research 2012; 2 (2): 299-306. 19. Rote H, Thakare VM, Tekade BW, Zope RP, Chaudhari RY,
Patil VR. Solubility Enhancement of Glipizide Using Solid Dispersion Technique. World Journal of Pharmaceutical research 2012; 4(1):1096-1115.
20. Rao AB, Shivalingam MR, Reddy K, Rao S, Rajesh K, Sunitha N. Formulation and Evaluation of Aceclofenac Solid Dispersions for Dissolution Rate Enhancement. International Journal of Pharmaceutical Sciences and Drug Research 2010; 2(2): 146-150.
21. Kavitha R, Sathali AH. Enhancement of Solubility of Repaglinide by Solid Dispersion Technique. International Jjournal of Chemical Sciences 2012; 10(1): 377-390. 22. Ramana BV, Parameshwari CS, Triveni C, Arundathi T,
Prasanna NR. Dissolution Rate Enhancement of Aceclofenac by Solid Dispersion Technique. Scholars Academic Journal of Pharmacy 2013; 2(2):113-118. 23. Mudgal SS, Pancholi SS. Formulation of glibenclamide
solid dispersions by solvent evaporation Technique.
Journal of Chemical and Pharmaceutical Research 2012; 4(1): 353-359.
24. Badry M, Fetih G, Fathy M. Improvement of Solubility and Dissolution Rate of Indomethacin by Solid Dispersions in Gelucire 50/13 and PEG 4000. Saudi Pharmaceutical Journal 2009; 17(3): 219-230.
25. Fule RA, Meer TS, Sav AR, Amin PD. Artemether-Soluplus Hot-Melt Extrudate Solid Dispersion Systems for Solubility and Dissolution Rate Enhancement with Amorphous State Characteristics. Journal of Pharmaceutics 2013:1-16.
26. Shep SG, Mundhe V, Shep SG, Chandewar AV. Solid dispersion a novel technique for solubility enhancement of Poorly water soluble drug gliclazide. Journal of Pharmacy Research 2012; 5(3): 1706-1712.
27. Moorthy SU, Kumawat MM, Reddy RT, Someshwar K, Kumaraswamy D. Formulation of Sustain Release Solid Dispersions of Verapamil Hydrochloride using Ethyl Cellulose and Eudragitrspo. International Journal of Pharmacy and Pharmaceutical Sciences 2011; 3(1): 116- 122.
28. Kumar MA, Kumar MK, Lashmi PK, Prasad VS. Development and evaluation of solid dispersion formulated ibuprofen tablets using cyclodextrin as carrier. International Journal of Pharmaceutical research and development 2012; 3(11): 93-101.
29. Aly AM, Ali AS. Preparation and evaluation of glipizide tablets containing both enhanced sustained release solid dispersion. International Journal of Pharmaceutical Sciences and Nanotechnology 2010; 2(4): 714-725. 30. Roul LK , Manna NK , Parhi RN , Sahoo S, Suresh P.
Dissolution rate enhancement of Alprazolam by Solid Dispersion. Indian Journal of Pharmaceutical Education and Research 2012; 46(1): 38-44.
31. Prasanna TV, Rani BN, Rao AS, Murthy T. Design and Evaluation of Solid Dispersed Tadalafil Tablets. International Journal of Pharmaceutical Sciences and Research 2012; 3(12): 4738-4744.
32. Subhashis DS, Gampa VK, Satyanarayana SV. Preparation and Evaluation of Solid Dispersion of Terbinafine Hydrochloride. Asian Journal of Pharmacy and Technology 2013; 3(1): 9-15.