Segmentation and Clustering of Textual Sequences: a Typological
Approach
Christelle Cocco, Rapha¨el Pittier, Franc¸ois Bavaud and Aris Xanthos University of Lausanne, Switzerland
{Christelle.Cocco,Raphael.Pittier, Francois.Bavaud,Aris.Xanthos}@unil.ch
Abstract
The long term goal of this research is to develop a program able to produce an automatic segmentation and categoriza-tion of textual sequences into discourse types. In this preliminary contribution, we present the construction of an algo-rithm which takes a segmented text as in-put and attempts to produce a categoriza-tion of sequences, such as narrative, argu-mentative, descriptive and so on. Also, this work aims at investigating a possible convergence between the typological ap-proach developed in particular in the field of text and discourse analysis in French by Adam (2008) and Bronckart (1997) and unsupervised statistical learning.
1 Introduction
An increasing amount of research has been conducted concerning text genre detection us-ing POS (part-of-speech) tags since the work of Biber (1988). For instance, Malrieu and Rastier (2001) describe how to classify texts ac-cording to genres (comedy, tragedy, drama. . . ) or discourses (literary, legal, political. . . ) using POS-tags.
POS-tags can be determined in an unsupervised way (see e.g. Schmid (1994)) and their distri-bution happens to differ according to types of texts, such as narrative, explicative and so on. Hence, developing automatic discourse type de-tection, which is of interest to the linguistic com-munity, seems practicable.
Thus, the purpose of the present study is to clus-ter clauses of a text into discourse types, i.e. to develop a tool for type detection with a limited quantity of annotated texts. We limit ourselves to the use of simple bag-of-words models on which fuzzy and K-means clustering are applied.
Specifically, the aim is twofold: firstly, the con-struction of a program which takes a segmented text as input and produces a categorization of se-quences of clauses by clustering, based princi-pally on POS-tags; secondly, the comparison of this clustering with the typology proposed by a human expert, corresponding to discourse types. Thus, this preliminary work aims at investigat-ing a possible convergence between unsupervised statistical learning on the one hand, and the ty-pological approach developed in particular in the field of French linguistics by Adam (2008) and in language psychology by Bronckart (1997) on the other hand.
As a first step, sample texts were manually an-notated, that is segmented (section 2.1) and classi-fied (section 2.2). Then, the clauses resulting from the previous segmentation were clustered on the basis of their POS distribution (sections 2.3 and 2.4). It appeared that the latter vary across the ty-pological classes proposed by the expert (section 3.1) which were compared to those resulting from fuzzy and K-means clustering processes (sections 3.2 and 4). Future developments are proposed in section 5.
2 Method
2.1 Segmentation
The first step of this research was to create a cor-pus of annotated texts. For that purpose, a human expert has been working on 19th century French short stories by Maupassant. Only one genre is examined, because distributions of POS-tags vary with genre as mentioned in the introduction. For the same reason, only one author is considered (seee.g.Koppel and Schler (2003)) in this prelim-inary work. Annotation was carried out by means of XML tags, which is becoming a standard prac-tice in this field (seee.g.Daoust et al. (2010)).
It transpired that segmentation into sentences
Texts ]sentences ]clauses ]tokens ]types % discourse types according to the human expert with punct. without punct. wordforms tags nar dial descr expl arg inj
”Un Fou?” 150 316 2’635 2’185 764 28 33.54 14.56 10.44 14.56 18.67 8.23
”L’Orient” 88 189 1’750 1’488 654 27 28.04 25.93 20.11 19.05 4.23 2.65
”Un Fou” 266 400 3’140 2’574 837 29 44.75 1.75 13.25 11.75 17.00 11.50
Total 504 905 7’525 6’247 2’255 30 37.35 11.27 13.70 14.25 14.92 8.51
Table 1: Statistics of the three annotated texts by Maupassant. Number of sentences as considered by TreeTagger (Schmid, 1994). Number of clauses as segmented by the human expert. Number of tokens including punctuation and compounds as tagged by TreeTagger. Number of simple tokens with-out punctuation and figures, considering compounds as separated tokens. Number of wordform types. Number of POS-tag types. Percentage of clauses for each discourse type (nar=narrative, dial=dialogal, descr=descriptive, expl=explicative, arg=argumentative, inj=injunctive).
was not sufficiently fine-grained for the envisioned analysis, so the expert was instructed to segment the texts at the clause level.
2.2 Classification by a human expert
To be able to compare the results of the auto-matic clustering with a classification according to the typological approach developed in particular by Adam (2008; 2005) and Bronckart (1997), the expert was then asked to classify the clauses into six types. In fact, Adam proposes a classification of textual sequences into five types: narrative, ar-gumentative, descriptive, explicative and dialoged sequences. However, we decided to add an injunc-tive type, following Bronckart. The expert deci-sion to classify clauses was based partly upon for-mal criteria, such as punctuation, typical words, tense of verbs and semantics; and partly upon his linguistic and literary knowledge. Table 1 shows descriptive statistics about annotated texts.
An important issue inherent in this task is that the typological structure of the text is hierarchical rather than linear. This means that a sequence of a given type may contain sequences of other types. The number of inclusions is not limited. For the purpose of annotation, the use of XML tags ap-pears to be appropriate, since it allows us to de-scribe trees. However, taking into account the full hierarchical structure represents an additional dif-ficulty for the automatic clustering procedure; in this first approach, the problem is treated as linear, i.e.only the leaves of the tree structure are consid-ered (for the clauses). For instance, in the extract given in table 2, the first three clauses are regarded as narrative; the forth as injunctive; the fifth as ar-gumentative; and the others as explicative.
2.3 Automatic fuzzy clustering
The general principle is to perform a maximally unsupervised classification (clustering) to be
com-<div type=”narratif”>
<e>Je le trouvai tantˆot couch´e sur un divan, en plein rˆeve d’opium.</e>
<e>Il me tendit la main sans remuer le corps,</e> <e>et me dit :</e><cr/>
<div type=”dialogal”> <div type=”injonctif”> <e>Reste l`a, parle,</e> </div>
<div type=”argumentatif”>
<e>je te r´epondrai de temps en temps,</e> <div type=”explicatif”>
<e>mais je ne bougerai point,</e>
<e>car tu sais qu’une fois la drogue aval´ee</e> <e>il faut demeurer sur le dos.</e><cr/> </div>
</div> </div> </div>
Table 2: Annotated extract of ”L’Orient” by Mau-passant.<e>refers to clause.
pared with the limited database of annotated clauses created by the expert. As a consequence, only POS-tags (e.g. noun, adjective, verb present, demonstrative pronoun, and so on) are used to cluster clauses.
In more detail, this program involves several steps. Firstly, the text is divided into n clauses (based on the manual annotation). Secondly, POS-tags are attributed to all the words of each clause with TreeTagger (Schmid, 1994), yielding a distri-bution over POS-tags. Thus a contingency table between clauses and POS-tags is obtained.
i in group g is defined by the following equa-tion (Rose et al., 1990; Bavaud, 2009):
zig =
ρgexp(−βDig) m
X
h=1
ρhexp(−βDih)
(1)
where ρg = Pni=1fizig is the relative weight of group g andfi is the relative weight of clause i,
Dgi is the chi-squared dissimilarity between clause
iand the centroid of groupg, andβis the inverse temperature parameter controlling the number of groups (a largerβ implies more groups). At the outset, centroids are chosen randomly (uniformly distributed memberships).
In addition, the user must choose the ini-tial number m of groups, the number Nmax of
maximum iterations and the relative tempera-ture trel defining the inverse temperature β :=
1/(trel×∆), where∆ := 12
P
ijfifjDij is total inertia andDij is the chi-squared dissimilarity be-tween clausesiandj.
Moreover, groups whose profiles are close enough are aggregated, thus reducing the initial number of groupsmto the final number of groups
M (Bavaud, 2009). In that case, memberships of sentences of similar groups are added in the fol-lowing way: zi[g∪h] = zig +zih. Two groups are considered close ifθgh/
p
θggθhh≥1−10−5 whereθgh = Pni=1fizigzihmeasures the overlap between groupsgandh(Bavaud, 2010).
Also, a factorial correspondence analysis (FCA) is performed to produce a low dimensional repre-sentation of the chi-squared dissimilaritiesDij be-tween clauses (and bebe-tween POS-tags).
At the end of the process, each clause is at-tributed to the most probable group and the results are plotted in 2D (figures 3 and 4).
Moreover, observing the dependency of the ef-fective number of groups as well as evaluation measures (figures 1 and 2) provides a guidance for determining suitable values of the temperature.
2.4 K-means clustering
We also compared the above fuzzy algorithm to the well-known K-means method (see e.g. Man-ning and Sch¨utze (1999)). As for the former, chi-squared dissimilarities are calculated in the algo-rithm. Two versions are investigated, a weighted and a non-weighted (i.e.uniform weights for each clause) approaches.
In K-means, the numberm of groups (and not the relative temperature) must be chosena priori. We have concentrated onm = 6 (the number of groups in the expert classification) as well as on values of mcorresponding to performance peaks in the fuzzy version (see figures 1 and 2).
2.5 Evaluation criteria
Regarding the evaluation, the aim is to compare automatic clustering and expert classification. In addition to χ2 statistic which measures the de-pendence between the two classifications, a cer-tain number of similarity indices between parti-tions exist, among which the Jaccard index, noted
J, seems to be a good indicator (Denœud and Gu´enoche, 2006; Youness and Saporta, 2004):
J =
X
i
X
j
n2ij−n
X
i
n2i•+X j
n2•j−X i
X
j
n2ij −n (2)
where nij is the number of clauses belonging to the unsupervised clusteriand the manual classj.
Another interesting measure is the corrected Rand index (Denœud and Gu´enoche, 2006):
RC = r−Exp(r)
Max(r)−Exp(r) (3)
withr=
P
i,jnij(nij−1)
2 ,
Exp(r) =
P
ini•(ni•−1)Pjn•j(n•j−1)
2n(n−1) ,
Max(r) =
P
ini•(ni•−1)+Pjn•j(n•j−1)
4 .
3 Results
3.1 Relevance of the method
To ensure that the choice of using POS-tags is rel-evant in this context, the dependence between the classification of clauses made by the human expert and the POS-tags they contain must be established. Table 3 reports the corresponding independence ratios (Rw,c in Li et al. (2008)) for the three anno-tated texts by Maupassant. An independence ratio greater than 1 shows a mutual attraction, whereas if it is less than 1, it shows a mutual repulsion. Fur-thermore, stars in this table indicate the most sig-nificant chi2 term-category dependance for each POS-tag with 2 degrees of freedom in relation to
χ2
1−0.001[2] = 10.83 (Yang and Pedersen, 1997;
adjectives for the descriptive type (q = 1.62 and chi2 = 27.88), simple past tense for the narrative type (q= 2.60and chi2= 110.55) or future tense for the dialogal type (q= 4.63and chi2= 62.10). Satisfactorily enough, the value of the chi-square on the contingency table between POS-tags and discourse types (chi2 = 752.6 with df = 145) is large, denoting a highly significant link between classes and POS-tags (p < 10−15). Moreover, re-search into genre detection using POS-tags reports interesting results (Karlgren and Cutting, 1994; Kessler et al., 1997; Malrieu and Rastier, 2001), which are, to some extent, relevant for type detec-tion.
nar dial descr expl arg inj
ABR 2.92 0.00 0.00 0.00 0.00 0.00
ADJ 0.78 1.07 1.62* 1.10 0.85 0.75
ADV 0.96 1.02 0.71 1.17 1.04 1.39
DET:ART 0.91 0.97 1.15 0.83 1.22 0.93
DET:POS 1.27 0.76 0.95 0.80 0.93 0.77
INT 1.34 1.34 0.00 1.05 0.95 0.94
KON 0.93 1.03 0.75 1.19 1.25 0.84
NAM 1.00 1.15 1.11 1.03 0.33 2.15
NOM 0.92 0.89 1.20 0.87 1.15 1.03
NUM 1.51 0.52 1.05 0.93 0.74 0.00
PRO 2.92 0.00 0.00 0.00 0.00 0.00
PRO:DEM 0.69 0.97 0.95 1.52 1.42 0.58
PRO:IND 0.68 1.34 1.08 1.45 1.33 0.00
PRO:PER 1.30* 1.03 0.58 1.05 0.86 0.67
PRO:REL 0.70 1.14 1.25 1.28 1.01 1.07
PRP 0.96 0.99 1.18 0.98 1.04 0.77
PRP:det 0.59* 1.45 1.31 0.65 1.19 1.78
PUN 0.95 0.99 1.15 0.80 1.00 1.34
PUN:cit 0.00 4.11* 0.80 0.00 0.23 4.91
SENT 1.16 0.96 0.79 1.08 0.83 1.05
VER:cond 1.29 0.97 0.00 0.87 1.83 0.00
VER:futu 0.53 4.63* 0.39 0.44 0.17 1.37
VER:impf 1.44 0.38 2.06* 0.34 0.50 0.12
VER:infi 1.07 0.78 0.89 1.50 0.91 0.53
VER:pper 1.26 0.91 0.98 0.90 0.80 0.57
VER:ppre 1.42 1.09 1.05 0.78 0.31 0.81
VER:pres 0.81 0.98 0.71 1.34 1.07 1.79*
VER:simp 2.60* 0.10 0.32 0.00 0.28 0.00
VER:subi 0.53 0.00 0.59 5.26* 0.00 0.00
VER:subp 0.32 3.58 0.00 1.61 0.64 1.67
Table 3: Independence ratio for the three texts by Maupassant (q): numbers indicate the ratio of the observed counts to their expected values un-der independence. The strongest mutual attraction for each POS-tag is in bold characters. Stars in cells point out the most significant chi-squared per POS-tag (α= 0.001).2
3.2 Results with automatic fuzzy clustering
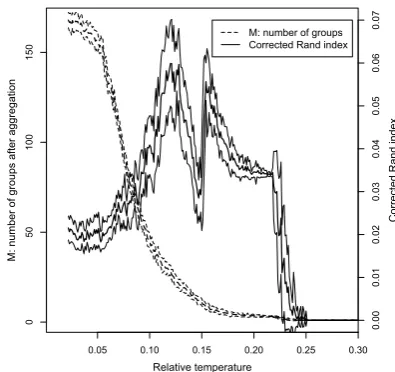
Figures 1 to 6 present the results for the method described above. The number of groups after ag-gregation and the corrected Rand index as a func-tion of the relative temperature are shown for the
2A complete explanation about the
signifi-cation of POS-tags in the table is available on http://www.ims.uni-stuttgart.de/˜schmid/ french-tagset.html
0.05 0.10 0.15 0.20 0.25 0.30
0
50
100
150
0.00
0.01
0.02
0.03
0.04
0.05
0.06
0.07
Relative temperature
M: number of groups after aggregation
Corrected Rand index
M: number of groups Corrected Rand index
Figure 1: ”Un Fou?” by Maupassant: number of groups and corrected Rand index as a function of the relative temperature. For each curve, the thick line represents the mean and the two thin lines rep-resent the standard deviation.
0.05 0.10 0.15 0.20 0.25 0.30
0
50
100
150
0.05
0.10
0.15
0.20
Relative temperature
M: number of groups after aggregation
Jaccard index
M: number of groups Jaccard index
Figure 2: ”Un Fou?” by Maupassant: Jaccard in-dex according to the relative temperature. The curve of number of groups is given for reminder.
text ”Un Fou?” in figure 1. These curves are ob-tained with an initial number of groupsm = 316 corresponding to the number of clausesn = 316 and a number of maximum iterations of Nmax =
rela-tive temperature. In figure 1, the two remarkable
-4000 -3000 -2000 -1000 0
-2000 107108109 111110 112 116118113115114117 119
120 121124122123127125128129130126 131
132 133135134136 137
138
139140 141
142143146149147148145144150 151152 153 154 155157161158159160156 162
163 164 165 166169168167 170
171 172
173 174 193182178186184179187191189177183176185192188180181194175190
195 196 197 198199 200 201 202203
204
205206207208 209210 211 212
213 214
215
216218217 219220 221222223 224 225 227228226
229 237 239 238
240
254256255 257
258
259 262260263265264261
266 279281280284283282
285 286 287 288297293291290292300295294304302296298305289299303301
306 314315316
Figure 3: Clustering of clauses of ”Un Fou?” by 146 147148
149
213 216218 214217
Method ]S m meanM sd Nmax meanNeff sd meanchi2 sd meandf sd meanJ sd meanRC sd
”Un
F
ou?”
NW K-means 300 6 - - 200 14.26 4.49 155.96 28.34 25 - .18 .01 .06 .02
W K-means 300 6 - - 200 16.18 5.60 152.46 28.21 25 - .15 .01 .07 .02
fuzzy
40 316 6.1 1.71 400 182 49.1 104.26 14.70 25.5 8.53 .21 .00 .04 .01
trel=0.165
NW K-means 89 26 - - 200 12.62 3.16 338.04 19.58 125 - .07 .01 .05 .01
W K-means 225 26 - - 200 11.68 2.78 335.66 16.56 125 - .07 .00 .05 .01
fuzzy
40 316 23.8 2.66 400 195.1 73.2 265.29 20.42 113.9 12.83 .17 .01 .06 .01
trel=0.125
”L
’Orient”
NW K-means 300 6 - - 200 12.66 3.76 63.09 8.94 25 - .15 .01 .02 .01
W K-means 300 6 - - 200 12.42 3.81 69.95 13.75 25 - .14 .01 .04 .02
fuzzy
40 189 6.48 0.82 400 161.2 61.5 48.24 5.83 27.38 4.08 .20 .00 -.01 .00
trel=0.18
NW K-means 144 30 - - 200 9.22 2.25 225.97 19.95 145 - .06 .01 .03 .01
W K-means 207 30 - - 200 8.76 1.79 229.74 19.69 145 - .06 .00 .04 .01
fuzzy
40 189 30.8 3.04 400 290.8 63.2 220.92 29.93 149 15.20 .13 .01 .01 .01
trel=0.117
”Un
F
ou” NW K-meansW K-means 300300 66 -- -- 200200 17.0017.80 6.226.43 70.6163.20 19.3316.45 2525 -- .15.16 .01.01 -.04.00 .01.01 fuzzy
40 400 6.08 1.07 400 89.1 27.5 142.89 11.72 25.38 5.36 .24 .01 -.04 .02
trel=0.188
Table 5: Comparison of results between K-means (non-weigthed (NW) and weighted (W)) and fuzzy clustering algorithms. ]S denotes the number of random starts on which the mean and the standard deviation (sd) are computed for evaluation criteria and other values. Neffrefers to the effective number
of iterations needed to stabilize the group centroid positions.
-4000 -3000 -2000 -1000 0
-2000
0
2000
4000
6000
first factorial coordinate 9.7 %
second factorial coordinate 8.7 %
PROI VERppre
PUNc
VERsubVERmVERsmNUM SENT
VERcVERpper PROP VERfNOM NAM
PRP
PRPd
ADV INT
DETP DETA PRODPROR ADJ VERpr KONVERn
VERsbp PUN
Figure 5: Representation of POS-tags of ”Un Fou?” by Maupassant.
performances. Evaluation criteria for the three texts and all methods are summarized in table 5. It is obvious that the three evaluation criteria do not imply the same conclusions. For instance, chi2 values indicates that for ”Un Fou?” and 6 groups, the non-weighted K-means induces the most promising classification. Regarding the Jac-card index, the fuzzy clustering seems to involve better results. As for the corrected Rand, it shows that weighted K-means improves the clustering. However, a certain number of regularities tran-spire. For ”Un Fou?”and 26 groups, the weighted K-means never implies the best results according
-500 0 500
-400
-200
0
200
400
first factorial coordinate 9.7 %
second factorial coordinate 8.7%
PROI VERppre VERsub
VERm VERsm
NUM SENT
VERc VERpper PROP VERf
NOM
NAM
PRP
PRPd
ADV DETADETP
PROD PROR
ADJ
VERpr
VERn KON VERsbp
PUN
Figure 6: Zoom of figure 5.
to the three criteria, while for ”L’Orient” and ”Un Fou”, the non-weighted K-means never induces the best classification. Finally, the corrected Rand index is low, or even negative, for ”Un Fou”. Per-haps it is due to the fact that this text is partly dif-ferent, even if it is a short story as the both other texts. Indeed, this text is made of a journal part.
To conclude, all these preliminary results must be considered with caution, in regard to the small size of the sample, annotated by a unique expert.
5 Work in progress
based on POS-tags and the linguistic types as-sessed by the human expert, the limitations are obvious, and further improvements have to be ex-plored. First of all, it will be interesting to apply a bi- or trigram model to replace individual POS-tags. Besides this, using only POS-tags might re-veal itself no sufficient, and calling for consider-ing the inclusion of typical words which discrim-inate, in a certain proportion, the different dis-course types. And, in the same line, feature selec-tion between POS-tags could improve results (see e.g. Yang and Pedersen(1997); Li et al. (2008)). It is also crucial to consider and exploit the hi-erarchical structure of discourse types. One way to do this could be to take into account the dom-inance of one type over others in a part of the hi-erarchical structure. Moreover, the use of other measures of clause dissimilarities, alternative to the chi-squared distances, may improve clustering results. Furthermore, combining fuzzy clustering and K-means as in the ”simulated annealing” ap-proach of Rose et al. (1990) should be explored. Finally, the possibility of automatically segment-ing the text into clauses should be considered.
References
Jean-Michel Adam. 2005. La linguistique textuelle:
Introduction `a l’analyse textuelle des discours. Ar-mand Colin, Paris.
Jean-Michel Adam. 2008. Les textes: types et
proto-types, 2nd edition. Armand Colin, Paris.
Franc¸ois Bavaud. 2009. Aggregation invariance in
general clustering approaches. Advances in Data
Analysis and Classification, 3(3):205–225.
Franc¸ois Bavaud. 2010. Euclidean Distances, Soft and
Spectral Clustering on Weighted Graphs. ECML
PKDD 2010: European Conference on Machine Learning and Principles and Practice of Knowledge Discovery in Databases, J.L. Balc´azar et al. (Eds.), 6321:103–118.
Douglas Biber. 1988. Variation across Speech and
Writing. Cambridge University Press, Cambridge, UK.
Jean-Paul Bronckart. 1997. Activit´e langagi`ere, textes et discours: pour un interactionisme socio-discursif. Delachaux et Niestl´e, Lausanne; Paris.
Franc¸ois Daoust, Yves Marcoux and Jean-Marie
Viprey. 2010. L’annotation structurelle. JADT
2010: 10th International Conference on Statistical Analysis of Textual Data.
Lucile Denœud and Alain Gu´enoche. 2006.
Compar-ison of Distances Indices Between Partitions. Data
Science and Classification, 21–28.
Jussi Karlgren and Douglass Cutting. 1994. Recogniz-ing text genres with simple metrics usRecogniz-ing
discrimi-nant analysis. Proceedings of the 15th conference
on Computational linguistics, 2. Kyoto, Japan.
Brett Kessler, Geoffrey Nunberg and Hinrich Sch¨utze.
1997. Automatic detection of text genre.
Proceed-ings of the 35th Annual Meeting of the Associa-tion for ComputaAssocia-tional Linguistics, 32–38. Madrid, Spain.
Moshe Koppel and Jonathan Schler. 2003. Exploit-ing Stylistic Idiosyncrasies for Authorship
Attribu-tion. Proceedings of IJCAI’03 Workshop on
Compu-tational Approaches to Style Analysis and Synthesis, 69–72.
Yanjun Li, Congnan Luo and Soon M. Chung. 2008. Text Clustering with Feature Selection by Using
Sta-tistical Data. IEEE Transactions on Knowledge and
Data Engineering, 20(5):641–652.
Denise Malrieu and Franc¸ois Rastier. 2001. Genres et
variations morphosyntaxiques. Traitement
Automa-tique des langues, 42(2):548–577.
Christopher D. Manning and Hinrich Sch¨utze. 1999. Foundations of Statistical Natural Language Pro-cessing. The MIT Press, Cambridge, MA.
Guy de Maupassant. 1883. L’Orient. Le Gaulois,
September 13. http://un2sg4.unige.
ch/athena/selva/maupassant/textes/
orient.html. Thierry Selva. accessed 2011,
March 5.
Guy de Maupassant. 1884. Un Fou?. Le Figaro,
September 1. http://un2sg4.unige.ch/
athena/maupassant/maup_fou.html. Thierry Selva. Accessed 2011, February 7.
Guy de Maupassant. 1885. Un Fou. Le Gaulois,
September 2. http://un2sg4.unige.ch/
athena/selva/maupassant/textes/
unfou.html. Thierry Selva. Accessed 2011,
April 26.
Kenneth Rose, Eitan Gurewitz and Geoffrey C. Fox. 1990. Statistical mechanics and phase transitions in clustering.Physical Review Letters, 65(8):945–948.
Helmut Schmid. 1994. Probabilistic part-of-speech
tagging using decision trees. Proceedings of the
International Conference on New Methods in Lan-guage Processing, 44–49.
Yiming Yang and Jan O. Pedersen. 1997. A Compar-ative Study on Feature Selection in Text
Categoriza-tion. Proceedings of the Fourteenth International
Conference on Machine Learning, 412–420.
Genane Youness and Gilbert Saporta. 2004. Une