Regularization and Search for Minimum Error Rate Training
Daniel Cer,Daniel Jurafsky, andChristopher D. Manning Stanford University
Stanford, CA 94305
cerd,jurafsky,[email protected]
Abstract
Minimum error rate training (MERT) is a widely used learning procedure for statistical machine translation models. We contrast three search strategies for MERT: Powell’s method, the variant of coordinate descent found in the Moses MERT utility, and a novel stochastic method. It is shown that the stochastic method obtains test set gains of +0.98 BLEU on MT03 and +0.61 BLEU on MT05. We also present a method for regularizing the MERT objec-tive that achieves statistically significant gains when combined with both Powell’s method and coordinate descent.
1 Introduction
Och (2003) introduced minimum error rate training (MERT) as an alternative training regime to the con-ditional likelihood objective previously used with log-linear translation models (Och & Ney, 2002). This approach attempts to improve translation qual-ity by optimizing an automatic translation evalua-tion metric, such as the BLEU score (Papineni et al., 2002). This is accomplished by either directly walk-ing the error surface provided by an evaluation met-ric w.r.t. the model weights or by using gradient-based techniques on a continuous approximation of such a surface. While the former is piecewise con-stant and thus cannot be optimized using gradient techniques, Och (2003) provides an approach that performs such training efficiently.
In this paper we explore a number of variations on MERT. First, it is shown that performance gains can be had by making use of a stochastic search strategy as compare to that obtained by Powell’s method and
coordinate descent. Subsequently, results are pre-sented for two regularization strategies1. Both allow
coordinate descent and Powell’s method to achieve performance that is on par with stochastic search.
In what follows, we briefly review minimum er-ror rate training, introduce our stochastic search and regularization strategies, and then present experi-mental results.
2 Minimum Error Rate Training
Let F be a collection of foreign sentences to be translated, with individual sentences f0, f1, . . . ,
fn. For each fi, the surface form of an indi-vidual candidate translation is given by ei with
hidden state hi associated with the derivation of
ei from fi. Each ei is drawn from E, which represents all possible strings our translation sys-tem can produce. The (ei,hi,fi) triples are
con-verted into vectors of m feature functions by Ψ :E × H × F →Rm whose dot product with the
weight vector w assigns a score to each triple. The idealized translation process then is to find the highest scoring pair (ei,hi) for each fi, or rather (ei,hi) = argmax(e∈E,h∈H)w·Ψ(e,h,f).
The aggregateargmaxfor the entire data setFis given by equation (1)2. This givesE
wwhich repre-sents the set of translations selected by the model for data set Fwhen parameterized by the weight vec-tor w. Let’s assume we have an automated mea-sure of translation quality ` that maps the
collec-1While we prefer the term regularization, the strategies pre-sented here could also be referred to as smoothing methods.
2Here, the translation of the entire data set is treated as a single structured prediction problem using the feature function vectorΨ(E,H,F) =Pn
i Ψ(ei,hi,fi)
id Translation log(PTM(f|e)) log(PLM(e)) BLEU-2
e1 This is it -1.2 -0.1 29.64
e2 This is small house -0.2 -1.2 63.59
e3 This is miniscule building -1.6 -0.9 31.79
e4 This is a small house -0.1 -0.9 100.00
[image:2.612.127.486.57.143.2]ref This is a small house
Table 1: Four hypothetical translations and their correspondinglogmodel scores from a translation modelPT M(f|e)
and a language modelPLM(e), along with their BLEU-2scores according to the given reference translation. The
MERT error surface for these translations is given in figure 1.
tion of translationsEw onto some real valued loss,
`:En→R. For instance, in the experiments that
follow, the loss corresponds to 1 minus the BLEU score assigned toEwfor a given collection of refer-ence translations.
(Ew,Hw) = argmax
(E∈En,H∈Hn)
w·Ψ(E,H,F) (1)
Using n-best lists produced by a decoder to ap-proximate En and Hn, MERT searches for the
weight vector w∗ that minimizes the loss `. Let-tingE˜wdenote the result of the translationargmax w.r.t. the approximate hypothesis space, the MERT search is then expressed by equation (2). Notice the objective function being optimized is equivalent to the loss assigned by the automatic measure of trans-lation quality, i.e.O(w) =`( ˜Ew).
w∗ = argmin
w `( ˜Ew) (2)
After performing the parameter search, the de-coder is then re-run using the weightsw∗to produce
a new set of n-best lists, which are then concate-nated with the prior n-best lists in order to obtain a better approximation ofEnandHn. The parameter
search given in (2) can then be performed over the improved approximation. This process repeats un-til either no novel entries are produced for the com-bined n-best lists or the weights change by less than some²across iterations.
Unlike the objective functions associated with other popular learning algorithms, the objective O
is piecewise constant over its entire domain. That is, while small perturbations in the weights,w, will change the score assigned byw·Ψ(e,h,f)to each triple,(e,h,f), such perturbations will generally not
change the ranking between the pair selected by the argmax,(e∗,h∗) = argmaxw·Ψ(e,h,f), and any
given competing pair(e0,h0). However, at certain
critical points, the score assigned to some compet-ing pair (e0,h0) will exceed that assigned to the prior winner (e∗
wold,h ∗
wold). At this point, the pair
returned byargmaxw·Ψ(e,h,f)will change and loss`will be evaluated using the newly selectede0.
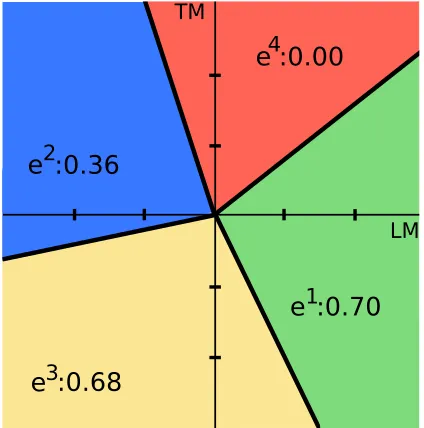
Figure 1: MERT objective for the translations given in table 1. Regions are labeled with the translation that dominates within it, i.e. argmaxw·Ψ(e,f), and with their corresponding objective values,
1−`(argmaxw·Ψ(e,f)).
This is illustrated in figure (1), which plots the MERT objective function for a simple model with two parameters, wtm & wlm, and for which the space of possible translations,E, consists of the four sentences given in table 13. Here, the loss `is
[image:2.612.320.532.330.544.2]associ-fined as 1.0−BLEU-2(e). That is, ` is the differ-ence between a perfect BLEU score and the BLEU score calculated for each translation using unigram and bi-gram counts.
The surface can be visualized as a collection of plateaus that all meet at the origin and then extend off into infinity. The latter property illustrates that the objective is scale invariant w.r.t. the weight vec-torw. That is, since any vectorw0 =λw∀
λ>0 will
still result in the same relative rankings of all pos-sible translations according tow·Ψ(e,h,f), such scaling will not change the translation selected by theargmax. At the boundaries between regions, the objective is undefined, as 2 or more candidates are assigned identical scores by the model. Thus, it is unclear what should be returned by theargmaxfor subsequent scoring by`.
Since the objective is piecewise constant, it can-not be minimized using gradient descent or even the sub-gradient method. Two applicable methods in-clude downhill simplex and Powell’s method (Press et al., 2007). The former attempts to find a lo-cal minimum in an n dimensional space by itera-tively shrinking or growing ann+ 1vertex simplex4
based on the objective values of the current vertex points and select nearby points. In contrast, Pow-ell’s method operates by starting with a single point in weight space, and then performing a series of line minimizations until no more progress can be made. In this paper, we focus on line minimization based techniques, such as Powell’s method.
2.1 Global minimum along a line
Even without gradient information, numerous meth-ods can be used to find, or approximately find, local minima along a line. However, by exploiting the fact that the underlying scores assigned to competing hy-potheses,w·Ψ(e,h,f), vary linearly w.r.t. changes in the weight vector,w, Och (2003) proposed a strat-egy for finding the global minimum along any given search direction.
The insight behind the algorithm is as follows. Let’s assume we are examining two competing
ated with the derivation of eachefrom the foreign sentencef. If included, such variables would only change the graph in that multiple different derivations would be possible for eachej. If
present, the graph could then include disjoint regions that all map to the sameejand thus the same objective value.
[image:3.612.322.531.59.272.2]4A simplex can be thought of as a generalization of a triangle to arbitrary dimensional spaces.
Figure 2: Illustration of how the model score assigned to each candidate translation varies during a line search along the coordinate directionwlm with a starting point
of (wtm, wlm) = (1.0,0.5). Each plotted line
corre-sponds to the model score for one of the translation candi-dates. The vertical bands are labeled with the hypothesis that dominates in that region. The transitions between bands result from the dotted intersections between 1-best lines.
translation/derivation pairs, (e1,h1) & (e2,h2).
Further, let’s say the score assigned by the model to (e1,h1) is greater than (e2,h2), i.e.
w·Ψ(e1,h1,f)>w·Ψ(e2,h2,f). Since the
scores of the two vary linearly along any search direction, d, we can find the point at which the model’s relative preference for the competing pairs switches as p= wd··Ψ(Ψ(ee12,,hh12,,ff))−−dw··Ψ(Ψ(ee12,,hh12,,ff)). At this particular point, we have the equality (pd+w)·Ψ(e1,h1,f) = (pd+w)·Ψ(e2,h2,f),
or rather the point at which the scores assigned by the model to the candidates intersect along search direction d5. Such points correspond to
the boundaries between adjacent plateaus in the objective, as prior to the boundary the loss function
`is computed using the translation,e1, and after the
boundary it is computed usinge2.
To find the global minimum for a search direc-tion d, we move alongd and for each plateau we
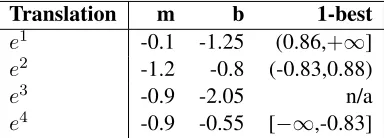
Translation m b 1-best
e1 -0.1 -1.25 (0.86,+∞]
[image:4.612.90.282.58.127.2]e2 -1.2 -0.8 (-0.83,0.88) e3 -0.9 -2.05 n/a e4 -0.9 -0.55 [−∞,-0.83]
Table 2: Slopes, m, intercepts, b, and 1-best ranges for the 4 translations given in table 1 during a line search along the coordinatewlm, with a starting point of (wtm, wlm) = (1.0,0.5). This line search in illustrated
in figure(2).
identify all the points at which the score assigned by the model to the current 1-best translation inter-sects the score assigned to competing translations. At the closest such intersection, we have a new 1-best translation. Moving to the plateau associated with this new 1-best, we then repeat the search for the nearest subsequent intersection. This continues until we know what the 1-best translations are for all points along d. The global minimum can then be found by examining`once for each of these.
[image:4.612.318.548.121.426.2]Let’s return briefly to our earlier example given in table 1. Starting at position(wtm, wlm) = (1.0,0.5)
and searching along the wlm coordinate, i.e.
(dtm, dlm) = (0.0,1.0), table 2 gives the line
search slopes, m=d·Ψ(e,h,f), and intercepts,
b=w·Ψ(e,h,f), for each of the four candidate translations. Using the procedure just described, we can then find what range of values along d each candidate translation is assigned the highest rela-tive model score. Figure 2 illustrates how the score assigned by the model to each of the translations changes as we move alongd. Each of the banded re-gions corresponds to a plateau in the objective, and each of the top most line intersections represents the transition from one plateau to the next. Note that, while the surface that is defined by the line segments with the highest classifier score for each region is convex, this is not a convex optimization problem as we are optimizing over the loss`rather than classi-fier score.
Pseudocode for the line search is given in algo-rithm 1. Lettingndenote the number of foreign sen-tences,f, in a dataset, and havingmdenote the size of the individual n-best lists,|l|, the time complexity of the algorithm is given byO(nm2). This is seen
in that each time we check for the nearest intersec-tion to the current 1-best for some n-best listl, we
Algorithm 1 Och (2003)’s line search method to
find the global minimum in the loss,`, when start-ing at the pointwand searching along the direction d using the candidate translations given in the col-lection of n-best listsL.
Input:L,w,d,`
I ⇐ {}
forl∈ Ldo
fore∈ldo
m{e} ⇐e.features·d b{e} ⇐e.features·w
end for
bestn⇐argmaxe∈lm{e} {b{e}breaks ties}
loop
bestn+1=argmine∈lmax
³
0,mb{{beste}−n}−m{bestb{en}} ´
intercept⇐max ³
0, b{bestn}−b{bestn+1}
m{bestn+1}−m{bestn} ´
ifintercept>0then
add(I, intercept)
else break end if end loop end for
add(I,max(I) + 2²)
ibest= argmini∈Ieval`(L,w+ (i−²)·d)
returnw+ (ibest−²)·d
must calculate its intersection with all other candi-date translations that have yet to be selected as the 1-best. And, for each of thenn-best lists, this may have to be done up tom−1times.
2.2 Search Strategies
In this section, we review two search strategies that, in conjunction with the line search just described, can be used to drive MERT. The first, Powell’s method, was advocated by Och (2003) when MERT was first introduced for statistical machine transla-tion. The second, which we call Koehn-coordinate descent (KCD)6, is used by the MERT utility pack-aged with the popular Moses statistical machine translation system (Koehn et al., 2007).
2.2.1 Powell’s Method
Powell’s method (Press et al., 2007) attempts to efficiently search the objective by constructing a set of mutually non-interfering search directions. The basic procedure is as follows: (i) A collection of search directions is initialized to be the coordinates of the space being searched; (ii) The objective is minimized by looping through the search directions and performing a line minimization for each; (iii) A new search direction is constructed that summarizes the cumulative direction of the progress made dur-ing step (ii) (i.e., dnew=wpreii−wpostii). After
a line minimization is performed along dnew, it is
used to replace one of the existing search directions. (iv) The process repeats until no more progress can be made. For a quadratic function of nvariables, this procedure comes with the guarantee that it will reach the minimum within niterations of the outer loop. However, since Powell’s method is usually ap-plied to non-quadratic optimization problems, a typ-ical implementation will forego the quadratic con-vergence guarantees in favor of a heuristic scheme that allows for better navigation of complex sur-faces.
2.2.2 Koehn’s Coordinate Descent
KCD is a variant of coordinate descent that, at each iteration, moves along the coordinate which al-lows for the most progress in the objective. In or-der to determine which coordinate this is, the rou-tine performs a trial line minimization along each. It then updates the weight vector with the one that it found to be most successful. While much less so-phisticated that Powell, our results indicate that this method may be marginally more effective at opti-mizing the MERT objective7.
3 Extensions
In this section we present and motivate two novel extensions to MERT. The first is a stochastic alterna-tive to the Powell and KCD search strategies, while the second is an efficient method for regularizing the objective.
7While we are not aware of any previously published results that demonstrate this, it is likely that we were not the first to make this discovery as even though Moses’ MERT implemen-tation includes a vestigial implemenimplemen-tation of Powell’s method, the code is hardwired to call optimize koehn rather than the rou-tine for Powell.
3.1 Random Search Directions
One significant advantage of Powell’s algorithm over coordinate descent is that it can optimize along diagonal search directions in weight space. That is, given a model with a dozen or so features, it can explore gains that are to be had by simultaneously varying two or more of the feature weights. In gen-eral, the diagonals that Powell’s method constructs allow it to walk objective functions more efficiently than coordinate descent (Press et al., 2007). How-ever, given that we have a line search algorithm that will find the global minima along any given search direction, diagonal search may be of even more value. That is, similar to ridge phenomenon that arise in traditional hill climbing search, it is pos-sible that there are points in the objective that are the global minimum along any given coordinate direc-tion, but are not the global minimum along diagonal directions.
However, one substantial disadvantage for Pow-ell is that the assumptions it uses to build up the di-agonal search directions do not hold in the present context. Specifically, the search directions are built up under the assumption that near a minimum the surface looks approximately quadratic and that we are performing local line minimizations within such regions. However, since we are performing global line minimizations, it is possible for the algorithm to jump from the region around one minima to another. If Powell’s method has already started to tune its search directions for the prior minima, it will likely be less effective in its efforts to search the new re-gion. To this extent, coordinate descent will be more robust than Powell as it has no assumptions that are violated when such a jump occurs.
One way of salvaging Powell’s algorithm in this context would be to incorporate additional heuris-tics that detect when the algorithm has jumped from the region around one minima to another. When this occurs, the search directions could be reset to the coordinates of the space. However, we opt for a simpler solution, which like Powell’s algorithm per-forms searches along diagonals in the space, but that like coordinate descent is sufficiently simple that the algorithm will not be confused by sudden jumps be-tween regions.
Figure 3: Regularization during line search - using, from left to right: (i) the maximum loss of adjacent plateaus, (ii) the average loss of adjacent plateaus, (iii) no regularization. Each set of bars represents adjacent plateaus along the line being searched, with the height of the bars representing their associated loss. The vertical lines indicate the surrogate loss values used for the center region under each of the schemes (i-iii).
is distributed according to a Gaussian8, d s.t.
di∼N(0,1). This allows the procedure to mini-mize along diagonal search directions, while making essentially no assumptions regarding the character-istics of the objective or the relationship between a series of sequential line minimizations. In the results that follow, we show that, perhaps surprisingly, this simple procedure outperforms both KCD and Pow-ell’s method.
3.2 Regularization
One potential drawback of MERT, as it is typically implemented, is that it attempts to find the best pos-sible set of parameters for a training set without making any explicit efforts to find a set of param-eters that can be expected to generalize well. For example, let’s say that for some objective there is a very deep but narrow minima that is surrounded on all sides by very bad objective values. That is, the BLEU score at the minima might be 39.1 while all surrounding plateaus have a BLEU score that is<10. Intuitively, such a minima would be a very bad solution, as the resulting parameters would likely exhibit very poor generalization to other data sets. This could be avoided by regularizing the sur-face in order to eliminate such spurious minima.
One candidate for performing such regularization is the continuous approximation of the MERT objec-tive,O=Epw(`). Och (2003) claimed that this ap-proximation achieved essentially equivalent perfor-mance to that obtained when directly using the loss as the objective,O=`. However, Zens et al. (2007) found thatO=Epw(`)achieved substantially better test set performance thanO=`, even though it per-forms slightly worse on the data used to train the parameters. Similarly, Smith and Eisner (2006) re-ported test set gains for the related technique of min-imum risk annealing, which incorporates a
temper-8However, we speculate that similar results could be ob-tained using a uniform distribution over(−1,1)
ature parameter that trades off between the smooth-ness of the objective and the degree it reflects the underlying piecewise constant error surface. How-ever, the most straightforward implementation of such methods requires a loss that can be applied at the sentence level. If the evaluation metric of inter-est does not have this property (e.g. BLEU), the loss must be approximated using some surrogate, with successful learning then being tied to how well the surrogate captures the critical properties of the un-derlying loss.
The techniques of Zens et al. (2007) & Smith and Eisner (2006) regularize by implicitly smooth-ing over nearby plateaus in the error surface. We propose an alternative scheme that operates directly on the piecewise constant objective and that miti-gates the problem of spurious local minima by ex-plicitly smoothing over adjacent plateaus during the line search. That is, when assessing the desirabil-ity of any given plateau, we examine a fixed win-dowwof adjacent plateaus along the direction be-ing searched and combine their evaluation scores. We explore two combination methods, max and
average. The former,max, assigns each plateau an objective value that is equal to the maximum objec-tive value in its surrounding window, whileaverage
assigns a plateau an objective value that is equal to its window’s average. Figure 3 illustrates both meth-ods for regularizing the plateaus and contrasts them with the case where no regularization is used. No-tice that, while both methods discount spurious pits in the objective,averagestill does place some value on isolated deep plateaus, andmax discounts them completely.
objective from a sequence of line minimizations.
4 Experiments
Three sets of experiments were performed. For the first set, we compare the performance of Powell’s method, KCD, and our novel stochastic search strat-egy. We then evaluate the performance of all three methods when the objective is regularized using the average of adjacent plateaus for window sizes vary-ing from 3 to 7. Finally, we repeat the regularization experiment, but using the maximum objective value from the adjacent plateaus. These experiments were performed using the Chinese English evaluation data provided for NIST MT eval 2002, 2003, and 2005. MT02 was used as a dev set for MERT learning, while MT03 and MT05 were used as our test sets.
For all experiments, MERT training was per-formed using n-best lists from the decoder of size 100. During each iteration, the MERT search was performed once with a starting point of the weights used to generate the most recent set of n-best lists and then 5 more times using randomly selected start-ing points9. Of these, we retain the weights from
the search that obtained the lowest objective value. Training continued until either decoding produced no novel entries for the combined n-best lists or none of the parameter values changed by more than 1e-5 across subsequent iterations.
4.1 System
Experiments were run using a right-to-left beam search decoder that achieves a matching BLEU score to Moses (Koehn et al., 2007) over a variety of data sets. Moreover, when using the same under-lying model, the two decoders only produce transla-tions that differ by one or more words 0.2% of the time. We made use of a stack size of 50 as it al-lowed for faster experiments while only performing modestly worse than a stack of 200. The distortion limit was set to 6. And, we retrieved 20 translation options for each unique source phrase.
Our phrase table was built using1,140,693 sen-tence pairs sampled from the GALE Y2 training
9Only 5 random restarts were used due to time constraints. Ideally, a sizable number of random restarts should be used in order to minimize the degree to which the results are influenced by some runs receiving starting points that are better in general or perhaps better/worse w.r.t. their specific optimization strat-egy.
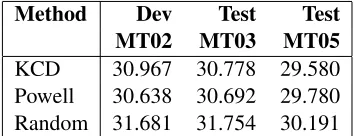
Method Dev Test Test
MT02 MT03 MT05
[image:7.612.338.515.58.126.2]KCD 30.967 30.778 29.580 Powell 30.638 30.692 29.780 Random 31.681 31.754 30.191
Table 3: BLEU scores obtained by models trained using the three different parameter search strategies: Powell’s method, KCD, and stochastic search.
data. The Chinese data was word segmented us-ing the GALE Y2 retest release of the Stanford CRF segmenter (Tseng et al., 2005). Phrases were extracted using the typical approach described in Koehn et al. (2003) of running GIZA++ (Och & Ney, 2003) in both directions and then merging the alignments using the grow-diag-final heuristic. From the merged alignments we also extracted a bi-directional lexical reordering model conditioned on the source and the target phrases (Tillmann, 2004) (Koehn et al., 2007). A 5-gram language model was created using the SRI language modeling toolkit (Stolcke, 2002) and trained using the Gigaword cor-pus and English sentences from the parallel data.
5 Results
As illustrated in table 3, Powell’s method and KCD achieve a very similar level of performance, with KCD modestly outperforming Powell on the MT03 test set while Powell modestly outperforms coordi-nate descent on the MT05 test set. Moreover, the fact that Powell’s algorithm did not perform better than KCD on the training data10, and in fact actually
performed modestly worse, suggests that Powell’s additional search machinery does not provide much benefit for MERT objectives.
Similarly, the fact that the stochastic search ob-tains a much higher dev set score than either Pow-ell or KCD indicates that it is doing a better job of optimizing the objective than either of the two alternatives. These gains suggest that stochastic search does make better use of the global minimum line search than the alternative methods. Or, alter-natively, it strengthens the claim that the method succeeds at combining one of the critical strengths
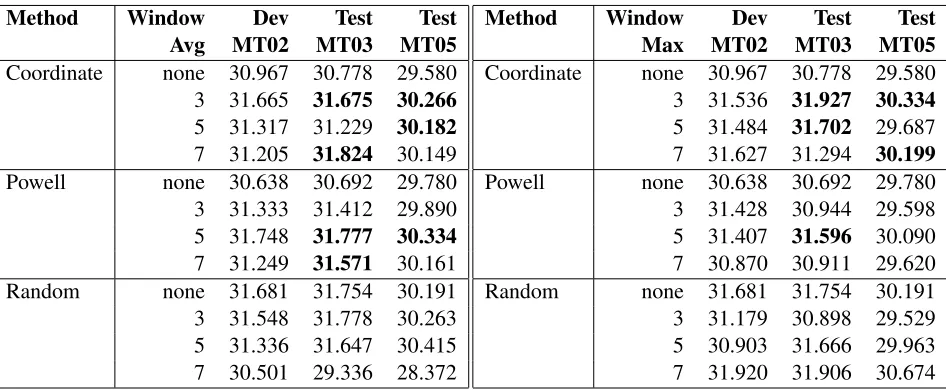
Method Window Dev Test Test
Avg MT02 MT03 MT05
Coordinate none 30.967 30.778 29.580 3 31.665 31.675 30.266
5 31.317 31.229 30.182
7 31.205 31.824 30.149 Powell none 30.638 30.692 29.780 3 31.333 31.412 29.890 5 31.748 31.777 30.334
7 31.249 31.571 30.161 Random none 31.681 31.754 30.191 3 31.548 31.778 30.263 5 31.336 31.647 30.415 7 30.501 29.336 28.372
Method Window Dev Test Test
Max MT02 MT03 MT05
Coordinate none 30.967 30.778 29.580 3 31.536 31.927 30.334
5 31.484 31.702 29.687 7 31.627 31.294 30.199
[image:8.612.75.548.56.251.2]Powell none 30.638 30.692 29.780 3 31.428 30.944 29.598 5 31.407 31.596 30.090 7 30.870 30.911 29.620 Random none 31.681 31.754 30.191 3 31.179 30.898 29.529 5 30.903 31.666 29.963 7 31.920 31.906 30.674
Table 4: BLEU scores obtained when regularizing using the average loss of adjacent plateaus, left, and the maximum loss of adjacent plateaus, right. The none entry for each search strategy represents the baseline where no regularization is used. Statistically significant test set gains, p<0.01, over the respective baselines are in bold face.
of Powell’s method, diagonal search, with coordi-nate descent’s robustness to the sudden jumps be-tween regions that result from global line minimiza-tion. Using an approximate randomization test for statistical significance (Riezler & Maxwell, 2005), and with KCD as a baseline, the gains obtained by stochastic search on MT03 are statistically sig-nificant (p= 0.002), as are the gains on MT05 (p= 0.005).
Table 4 indicates that performing regularization by either averaging or taking the maximum of adja-cent plateaus during the line search leads to gains for both Powell’s method and KCD. However, no reli-able additional gains appear to be had when stochas-tic search is combined with regularization.
It may seem surprising that the regularization gains for Powell & KCD are seen not only in the test sets but on the dev set as well. That is, in typical ap-plications, regularization slightly decreases perfor-mance on the data used to train the model. However, this trend can in part be accounted for by the fact that during training, MERT is using n-best lists for objec-tive evaluations rather than the more expensive pro-cess of running the decoder for each point that needs to be checked. As such, during each iteration of training, the decoding performance of the model ac-tually represents its generalization performance rel-ative to what was learned from the n-best lists cre-ated during prior iterations. Moreover, better gen-eralization from the prior n-best lists can also help
drive subsequent learning as there will then be more high quality translations on the n-best lists used for future iterations of learning. Additionally, regular-ization can reduce search errors by reducing the risk of getting stuck in spurious low loss pits that are in otherwise bad regions of the space.
6 Conclusions
We have presented two methods for improving the performance of MERT. The first is a novel stochas-tic search strategy that appears to make better use of Och (2003)’s algorithm for finding the global min-imum along any given search direction than either coordinate descent or Powell’s method. The sec-ond is a simple regularization scheme that leads to performance gains for both coordinate descent and Powell’s method. However, no further gains are ob-tained by combining the stochastic search with reg-ularization of the objective.
One quirk of the regularization scheme presented here is that the regularization applied to any given point in the objective varies depending upon what direction the point is approached from. We are currently looking at other similar regularization schemes that maintain consistent objective values regardless of the search direction.
Acknowledgments
particularly for the depth of analysis provided. This paper is based on work funded in part by the Defense Advanced Research Projects Agency through IBM.
References
Koehn, P., Hoang, H., Birch, A., Callison-Burch, C., Federico, M., Bertoldi, N., Cowan, B., Shen, W., Moran, C., Zens, R., Dyer, C., Bojar, O., Con-stantin, A., & Herbst, E. (2007). Moses: Open source toolkit for statistical machine translation.
In ACL.
Koehn, P., Och, F. J., & Marcu, D. (2003). Statistical phrase-based translation. In HLT-NAACL.
Och, F.-J. (2003). Minimum error rate training in statistical machine translation.In ACL.
Och, F. J., & Ney, H. (2002). Discriminative train-ing and maximum entropy models for statistical machine translation. In ACL.
Och, F. J., & Ney, H. (2003). A systematic compari-son of various statistical alignment models. Com-putational Linguistics,29, 19–51.
Papineni, K., Roukos, S., Ward, T., & Zhu, W.-J. (2002). Bleu: a method for automatic evaluation of machine translation. In ACL.
Press, W. H., Teukolsky, S. A., Vetterling, W. T., & Flannery, B. P. (2007).Numerical recipes 3rd edi-tion: The art of scientific computing. Cambridge University Press.
Riezler, S., & Maxwell, J. T. (2005). On some pit-falls in automatic evaluation and significance test-ing for mt.In ACL.
Smith, D. A., & Eisner, J. (2006). Minimum risk annealing for training log-linear models. In ACL.
Stolcke, A. (2002). Srilm – an extensible language modeling toolkit. In ICSLP.
Tillmann, C. (2004). A unigram orientation model for statistical machine translation. In ACL.
Tseng, H., Chang, P., Andrew, G., Jurafsky, D., & Manning, C. (2005). A conditional random field word segmenter for sighan bakeoff 2005. In SIGHAN Workshop on Chinese Language Pro-cessing.