Volume 9, No. 3, May-June 2018
International Journal of Advanced Research in Computer Science
RESEARCH PAPER
Available Online at www.ijarcs.info
ISSN No. 0976-5697
NOISE-ROBUST HAND BASED MULTIMODAL BIOMETRIC SYSTEM USING
ICA FEATURES
Supreetha Gowda H D, Mohammad Imran and Hemantha Kumar G
Department of Computer Science,University of Mysore, MYSORE- India
Abstract: Achieving performance and robustness simultaneously for an automated biometric system is crucial to prove that it is robust to real time noise encounters which determines the expected behavior of the system with the employed feature extraction algorithms, feature selection rules, classifiers. We have evaluated our system on two hand based modalities such as palmprint and handvein. The robustness is checked and the systems security level is explored on both unimodal and multi- modal (pre and post classification fusion techniques) systems by tabulating the comparative results got from clean and noisy data (Gaussian, salt and pepper and speckle noise) under the standard benchmark threshold values 0.01%, 0.1%, 1%.
Keywords: Handvein, ICA, Fusion, Noise, Biometric Verification.
1. INTRODUCTION
Often addressing the real time noise which may include various noise factors such as Gaussian, salt and pepper, speckle noises is a challenging issue, understanding the generalized framework on dynamic selection of rules and classifiers depending on the income of imperfect data is itself a major issue, as the noisy data hinders the extraction of data knowledge. Preprocessing of noisy data by correcting it or by adopting the robust learning classifiers would solve the problem of noisy data to some extent[10]. In literature we find two kind of noises, class noise (caused by labelling errors) and attribute noise (may be caused by missing values). Training and testing the system with the classifier fed with imperfect data and claiming it as insensitive and robust to data fluctuations requires huge data. Though the noise level is increased the classifiers performance should not deteriorate, maintaining the consistent and yielding promising results matters. One way of taking care of noisy data is to obtain a reliable model which is regardless to noisy source. Data imperfection is likely analysed in medical diagnosis, military etc. Data can be judged as imperfect in two stages, Uncertainty (random data from the source) and imprecision (missing values and vagueness). Probability theory, fuzzy theory, possiblistic theory seems to be promising in literature survey in noisy data analysis. In classification we either measure similarity or dissimilarity measure between two templates. It is easy to fool a systemwith single modality adoption as it may suffer from noise, occlusion, illumination, Format Conversion etc., in such a case multimodal biometric would serve the need of security. In recent days various biometric acquisition devices come with distant operation for user convenience. The level of noise is unknown for cameras of different brands which may exhibit varied attributes such as shutter speed, flash (on and off) etc. Theoretically it is proved that we cannot obtain original image completely which was noisy by any feature extraction algorithms and it’s not that easy to achieve complete classification rate[11]. Hence, this
is a challenging task where the original properties of an image should be preserved when the noisy image undergoes denoising conditions. The properties such as retaining flat regions, texture details, image boundaries, contrast should be preserved while denoising. Wavelet method is very much popular in image de noising literature, but the ringing effects may occur and also it may add extra edges structure.Palmprints contain larger area than fingerprint and it is deformable, different regions vary in palm as distortion of ends of palm print is very common, hence handling noise is difficult. Palmprint consists of creases and ridges.Understanding palmprint’s crucial properties, Law authority department is collecting palm print along with the fingerprint from past 20th century. Ridge patterns are quite different in the entire palm region, as a result the discrimination power also varies.
The Skeleton of the paper is as follows: Section 2 gives literature review to multiple multimodal biometric systems. Section 3 presents the methods and material used in this research. Section 4 discusses experimental results. Conclusion and future work are drawn in Section 5.
2. REVIEW OF LITERATURE
database of facial trait which contains non-face patches along with the face.
Di Miao et.al[3] proposed a multibiometric system on fusing traits optimally and proved the effectiveness and robustness of the system. To deal with the noisy condition they introduced heterogeneous classifier fusion based on robust linear programming. Optimal combination of classifier is identified by calculating weights. The proposed method performs well in all uncontrolled situations of noise and proved to be robust, efficient and does not require more training samples for training. On adding random noise Gaussian noise (mean=0, variance=0.2) has yielded better recognition results. Learning makes difficult for any feature extraction algorithm as it is inevitable to avoid noise in both training and testing data which leads to significant drop in performance of the system , as the intra class variations are more rather than the inter class differences. The corruptions in the noisy image can be known by reconstructing the coefficients of weights matrix data in testing data set. Class specific useful data that consists of huge discriminative features, class shared data which is owned by the classes that share the common attributes are essential to avoid intra class variations and also to build the robust system that is unaffected by noisy parameters[4].
Ce Liu et.al [5] proposed segmentation approach in identifying the noise level that calculates the upper bound level of noisy information in an image. Brightness is obtained by mean estimation and standard deviation gives the overestimate of noise. Noise is estimated from gradient of smoother regions. Authors have used piecewise smooth image model for noise level estimating and removing which is steady with sparse image prior. Niall McLaughlin et.al[6] proposed a biometric identification system with pre classification rule - feature level fusion on face (physiological trait) with gabor features and voice (behavioural trait) with sub band spectral features, assuming fewer number of training data. A novel feature representation and modified cosine similarity rule is presented. The system is made robust to corruption by optimal selection of features which in turn reduces the mismatch.
Steven L. Fernandes et.al [7] proposed a face recognition system under score level fusion for facial trait. Authors have experimented in checking the robustness of system under the presence of median noise, salt and pepper noise and blurring effects. Features are extracted from well known techniques such as PCA, FF, ICA, FS, SVD, SR. The system is trained in absence of noise and tested the performance and robustness of the system with the noisy images. Christof Kauba and Andreas Uhl[8] proposed handvein recognition system and investigated the robustness of the system considering image distortions associated with image acquisition (sensor defects).Stirmark tool was used to generate degraded images and also aged images were created. Pixel defects increase linearly with time and cannot be diagnosed. Jifeng Dai et. al[9] proposed a palm print recognition system analysing the features cautiously, in addressing distortion of palm print authors have proposed segment based (partitioning the palm print area in to several segments) palm print matching and fusion (similarity scores
of Bayseian framework). When the distortion arises, the segment rotates and balances the degradation at the lower computational cost.
3. METHODS AND MATERIALS
In this section, we have explored different methods which used in this research.
1. Spatial Noises
Gaussian noise is a statistical noise which may arise during acquisition and is given by,
1 (i µ) 2σ σ√2π
where µ is mean σ is standard deviation and σ2
2. Independent Component Analysis (ICA) is the variance.
Speckle noise is a multiplicative noise which could be seen in laser, radar etc, and is given by, s = x + n ∗x, where s is speckle noise and x is the input image.
Salt and pepper noise , pixels are of white and black pixels and hence the name. Pepper noise lose to 0 and salt noise closer to 255.
Salt andpepper =P forg=p(”pepper”)
Sforg=s(”salt”) .
Let there be n linear mixtures of n independent components
xj = mj1S1 + mj2S2 · · · mjnSn . Let r be the random vector with elements r1 · · · rn. Mixing model is given by x = Mr, then estimating matrix M inverse is computed say W and Independent components are given by r = Wx.
ICA is a statistical technique which is robust to noise, which solves the problem of blind source separation problem (separates the linear mixture of signals). ICA principles are nonlinear decorrelation i.e making all the non-linear com- ponents decorrelated and maximum nongaussianity principle i.e to analyze the local maximum in linear combination of m=Ax, where x is set of random variables observation and A being the unknown matrix. Minimizing mutual information between latent variables and maximization of non Gaussianity in the multivariate data. Thus generates the ICA algorithm.
3. Levels of Biometric fusion
Feature level: In feature level fusion, the feature vectors obtained from many feature extraction algorithms are concatenated, let s1, s2, s3 · · · sa and h1, h2, h3 · · · hi be the feature vectors from different sources. Before concatenating the feature vectors it is essential to check feature set compatibility, normalization, dimensionality reduction. Some of the normalization techniques are as follows at feature level.
The min-max technique computes
N =F ei−min(F e)
max(F e)−min(F e)
where Fe is thefunction which generates i. z-score
normalization technique computes µ and σoriginal input data and calculates the scores by, Z′ = I−µ(Z) . The tangent hyper bolic normalization technique, beginmath
Ns = 0.5{tanh(0.01 F e−mean(F e)
where mean (Fe) and Std (Fe) are the mean and standard deviation estimates.
Score level:Score level fusion contains sufficient information about genuine and imposter score rate and hence it is desirable and feasible, broadly classified into three main categories, a) Density-based, b) Transformation-based and c) Classifier Transformation-based schemes. Min fusion technique calculates the minimum score values obtained from individual traits as, Min(ScoreFinal) = min(ScoreHv,
ScorePp). Max fusion technique computes the maximum
score of the individual modalities and reflects it as the multimodal score, which is given by Max(ScoreFinal) =
max(ScoreHv, ScorePp). Sum rule is adopted generally
when there is ambiguity in the decision and clears the equivocalness. Sum rule fusion is given by Sum(ScoreFinal)
= sum(ScoreHv, ScorePp).
Decision level:Decision level fusion also called as abstract level fusion, here the matcher outputs its own label and a single labelled decision is obtained by the popular methods like majority voting, behavior knowledge space, etc. AND rule obtains the final decision framed from the conjunction of individual matchers in a serial combination. AND rule is applied where tight security is of high concern and which leads to 0% FAR but on the other handit faces higher rate of FRR. A = a1 ∧a2 ∧a3 · · · aM . OR rule is performed inparallel combination of individual matchers from the disjunction rule, here there is higher level of FAR and 0% FRR. A = a1 ∨a2 ∨a3 · · · aM .
) + 1}
4. EXPERIMENTAL RESULTS
In this section, we have done verification of biometric (unimodal and multimodal) system in exploring the robustness of the implemented model by adding Salt and Pepper noise, Gaussian and Speckle noise. Experimentation has been conducted for both clean and noisy database (Poly- U Palm and Hv datasets) extracting global features from the Independent Component analysis algorithm and the verification (Genuine Acceptance Rate - GAR) results are tabulated for the standard benchmark threshold values 0.01%, 0.1%, 1%. The Gaussian white noise with zero mean
and 0.01 variance is done while adding this kind of noise. Salt and pepper noise adds the noise density to the image with the density of0.05 and finally the speckle noise which is multiplicative in nature the variance used is 0.04.
We have done verification of biometric (unimodal and multimodal) system in exploring the robustness of the implemented model by adding Salt and Pepper noise, Gaussian and Speckle noise. Experimentation has been conducted for both clean and noisy database (Poly- U Palm and Hv datasets) extracting global features from the Independent Component analysis algorithm and the verification (Genuine Acceptance Rate - GAR) results are tabulated for the standard benchmark threshold values 0.01%, 0.1%, 1%.
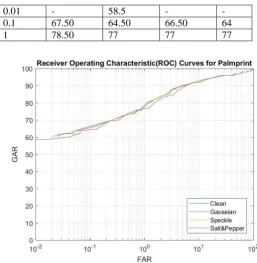
Table 1. Performance of Palmprint biometric on various spatial noise condition
FAR% GAR%(Palmprint)
Clean Salt & Pepper Gaussian Speckle
0.01 - 58.5 - -
0.1 67.50 64.50 66.50 64
[image:3.595.318.576.300.564.2]1 78.50 77 77 77
Fig. 1. ROC Curve for Different Spatial noise on Palmprint Modality
Table-1 shows the results tabulated for palm trait on both clean and noisy conditions. At 1% FAR on clean dataset condition we have got 78.5% of GAR, ICA feature extraction seems to be consistent and reliable for all noisy condition data, as we can see from the results tabulated.
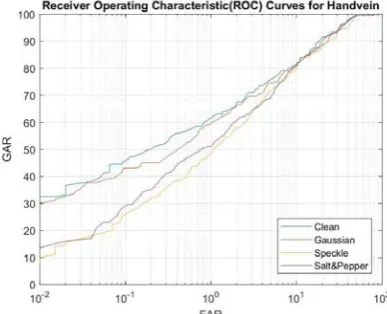
The verification results for Handvein modality explored on both clean and various noisy data is tabulated in Table-2, the feature extraction algorithm adopted and also the traits employed for a particular system also matters in yielding remarkable accuracy gain. Handvein is underperforming than the Palm
FAR% GAR%(Handvein)
Clean Salt & Pepper Gaussian Speckle
0.01 32.50 13.50 28 7.50-
0.1 45.50 29.50 43 25
[image:4.595.326.520.62.219.2]1 62 51 59.50 48.50
[image:4.595.33.559.287.438.2]Fig. 2. ROC Curve for Different Spatial noise on Handvein Modality
Table 3. Robustness comparison of multimodal system GAR% at 0.01%FAR, 0.1%FAR and 1%FAR on fusion of Palmprint and Handvein for clean data, corrupted by Gaussian and Speckle noise
Fusion Rule Clean Speckle noise Gaussian noise
0.01 0.1 1 0.01 0.1 1 0.01 0.1 1
Sensor Level Wavelet based 62.5 73 84.5 22.5 39 65 44.5 68 82.5
Feature level
Min-Max Z-score Tanh
75 87 94
73.5 83.5 92.5 73.5 83.5 92.5
74 82.5 93 61.5 74.5 87 61 74.5 87
74 85.5 93 71 79.5 91.5 71 79.5 92
Score level
Min Max Sum
68 77.5 90 40.5 59.5 79 79.5 89.5 96
62.5 75 88
5 15 44.5
80.5 88 95
63 75 88
27 43 65
78.5 89.5 95
Decision level OR AND
68 77.5 90 40.5 59.5 79
62.5 75 88
6 15 44.5
63 75 88
30 43 65
Trait and 62% GAR is obtained at 1% FAR, Gaussian noise is smooth and this noise seems to be consistent than the other two considered noises.
The Table-3 demonstrates all the pre-classification (fusion before match) and post-classification (fusion after match) fusion schemes adopting various rules under each fusion level. Salt and pepper noise is performing moderately. Gaussian noise is the best performer and speckle noise being the worst performer and hence we have considered these two noises for multimodal biometric system implementation.
In the sensor level fusion, also called as image level fusion we have done wavelet based fusion, generally the system performance deteriorates and less adopted in tight security systems. In our experimental results we have obtained 84.5% GAR on 1% FAR on clean data and 82.5% GAR on Gaussian noise and proved better than other noises. In feature level fusion which contains richer source of information and we have employed normalization rules such as Min- Max, Z-Score and tanh. Min-Max rule is consistently performing on both kinds of data with 93% of verification rate and this rule is reliable. Score level fusion measures the similarity or dissimilarity measure and it is ease, sum rule performs better with 96%, 95%, 95% GAR at 1% FAR and proved to be efficient on both kinds of data
[image:4.595.325.546.543.718.2]compared to min and max rule. Decision level fusion frames the global decision by considering the decisions obtained from local independent matchers. OR rule and AND rule are employed at this level, since AND rule works with conjunction way and the results tabulated under AND rule is yielding considerable results, proves the system is tightly secured with very low FAR.
Fig. 4. ROC Curve for different level of fusion on Gaussian noise of Palmprint and Handvein multimodal system
Fig. 5. ROC Curve for different level of fusion on Speckle noise of Palmprint and Handvein multimodal system
5. CONCLUSION
The real world data is more likely prone to noises, system addressing the imperfect data has to work robust and exhibit reliability against the noisy data. Gaussian noise is smooth and performing better with good verification rate than the other two noises considered, Salt and pepper noise is performing moderately and speckle noise is under performing and seems to be challenging to fix this noise. Firstly, score level fusion with sum rule has got 96% GAR on clean data and 95% of GAR on both speckle and Gaussian noises at 1% FAR and seems to be more approachable when working on noisy conditional data. Secondly, feature level fusion with min-max rule is performing better with 94% of GAR on clean data and 93% GAR on noisy conditional data at 1%FAR. Our current work has given Robustness and Comparative analysis of unimodal and multimodal biometric systems on hand based traits with all kind of fusion levels (both pre and post
classification) with the various normalizing rules found extensively in literature. Our future work would be intended on other modalities, consistent feature extraction algorithms that perform steady on clean and noisy data and finally outputting a robust application based system by adopting denoising techniques.
7. REFERENCES
1. M. Bellaaj, R. Boukhris, A. Damak and D. Sellami, ”Possibilistic modeling palm- print and fingerprint based multimodal biometric recognition system,” 2016 Inter-national Image Processing, Applications and Systems (IPAS), Hammamet, 2016, pp. 1-8.
2. S. Gunasekar, J. Ghosh and A. C. Bovik, ”Face Detection on Distorted Images Augmented by Perceptual Quality-Aware Features,” in IEEE Transactions on In- formation Forensics and Security, vol. 9, no. 12, pp. 2119-2131, Dec. 2014.
3. D. Miao, Z. Sun and Y. Huang, ”Fusion of Multibiometrics Based on a New Robust Linear Programming,” 2014 22nd International Conference on Pattern Recognition, Stockholm, 2014, pp. 291-296. 4. Yi Rong, Shengwu Xiong, Yongsheng Gao, Low-rank
double dictionary learning from corrupted data for robust image classification, Pattern Recognition, Volume 72, 2017, Pages 419-432, ISSN 0031-3203 5. C. Liu, R. Szeliski, S. Bing Kang, C. L. Zitnick and W.
T. Freeman, ”Automatic Estimation and Removal of Noise from a Single Image,” in IEEE Transactions on Pattern Analysis and Machine Intelligence, vol. 30, no. 2, pp. 299-314, Feb. 2008.
6. N. McLaughlin, J. Ming and D. Crookes, ”Robust Multimodal Person Identification With Limited Training Data,” in IEEE Transactions on Human-Machine Systems, vol. 43, no. 2, pp. 214-224, March 2013.
7. S. L. Fernandes, G. J. Bala, P. Nagabhushan and S. K. Mandal, ”Robust Face Recognition in the Presence of Noises and Blurring Effects by Fusing Appearance Based Techniques and Sparse Representation,” 2013 2nd International Conference on Advanced Computing, Networking and Security, Mangalore, 2013, pp. 84-89. 8. C. Kauba and A. Uhl, ”Robustness Evaluation of Hand
Vein Recognition Systems,” 2015 International Conference of the Biometrics Special Interest Group (BIOSIG), Darmstadt, 2015, pp. 1-5.
9. J. Dai, J. Feng and J. Zhou, ”Robust and Efficient Ridge-Based Palmprint Match- ing,” in IEEE Transactions on Pattern Analysis and Machine Intelligence, vol. 34, no. 8, pp. 1618-1632, Aug. 2012. 10. Le qing Zhu and San yuan Zhang. Multimodal
biometric identification system based on finger geometry, knuckle print and palm print. Pattern Recognition Letters, 31(12):16411649, 2010.
[image:5.595.51.272.283.460.2]