R E S E A R C H
Open Access
Performance evaluation of WSN
management system for QoS guarantee
Omar Said
1,2Abstract
As the wireless sensor networks (WSNs) continue to evolve, it becomes more and more important. Furthermore, no one can deny that quality of services (QoS) is still one of the most important areas in this domain. In this paper, a system for guaranteeing WSN QoS is proposed. The idea of this system is to use the previous individual solutions such as clustering, data prioritization, and data classification in addition to efficient techniques for network management. Simulation of this system is achieved using the network simulation package (NS2). Simulation results are given to demonstrate the effectiveness of the proposed system in terms of throughput, latency, lost packets, and sensor power consumption.
Keywords:WSN; QoS; Network management; Wireless communication
1 Introduction
Recently, wireless sensor networks (WSNs) have got a new technological vision due to rapid development in wireless communication, energy supplies, network pro-tocols, micro-sensor, pervasive technologies, and ubiqui-tous computing [1–3]. Existence of Internet with its enormous capabilities makes WSNs an important infor-mation resource for physical phenomena in addition to using their potential applications to construct more ac-curate models for servicing humanity in various aspects of life such as industrial control, security, smart home, e-health, and surveillance. Several researches have been carried out concerning WSNs field, such as WSNs pro-tocols, architecture, energy consumption, and tracking. Since WSNs’ nature differs from that of traditional net-works, providing WSNs quality of services (QoS) is still an emerging area of research field [4].
QoS is related to WSN components such as users and applications. So, the QoS can be simply defined as a measure of service quality that the network offers to the application and users [5]. Thus far, there is no clear method to describe WSNs services probably; few re-searches focus on developing long-term solutions for QoS problems. When the network packets are transmit-ted from source to destination, the QoS is considered as
set of parameters that are required to accomplish the transmission processes. Hence, delay, jitter, available bandwidth, and packet loss are considered as QoS parame-ters. Therefore, WSNs’goal is to analyze the application requirement and provide the QoS especially in case of maximum network resource utilization. Also, QoS depend on the WSNs data type; different multimedia applications may require more restricted QoS (hard QoS) while trad-itional applications require less QoS (soft QoS) [6]. In addition, network nature is an important factor to impose specific QoS control due to their special specs such as dynamic topology for mobile networks and energy con-sumption in the WSNs.
As a result, the parameters such as jitter, bandwidth, delay, and loss can provide accepted QoS. In WSN, these parameters are not fully applicable because sensor nodes do not use end-to-end communication. Each node com-municates only with its neighboring nodes, and no con-nection needs to be established between source and destination. In addition, intermediate sensor nodes gen-erate data during routing. The data generation process consumes more energy which is considered as the most challenging problem. So, parameters like coverage, ex-posure, energy cost, and network life time should be raised to be new QoS parameters. The coverage problem may happen due to location and network management. Exposure provides measures of how an object can be ob-served by a sensor over a period of time. Energy cost finds the best route to destination as regards energy
Correspondence:[email protected]
1
College of Science, Menofia University, Shebin El Kom, Gamal Abdelnaser St., 32511 Menofia, Egypt
2
College of Computers and Information Technology, Taif University, Taif, Saudi Arabia
conservation. Network life time is the total working time of WSN until it becomes unable to satisfy user’s needs [7–12]. To face these challenges, a powerful manage-ment system for WSN should be constructed provided that this system considers the critical parameters such as WSN node power degree, WSN bandwidth, and WSN instrumentations.
This paper proceeds as follows: in Section 2, the re-lated work is introduced. In Section 3, the problem definition is demonstrated. In Section 4, the proposed system is discussed. In Section 5, the proposed system mathematical analysis is presented. In Section 6, the simulation environment is constructed and the results are discussed. Finally, the conclusion and the future work are introduced in Sections 7 and 8, respectively.
2 Related work
Related work focuses on three main directions. The first direction is the evaluation of famous protocols that are proposed to solve the WSN QoS problems. The second direction is the evaluation of trials that are used to solve the QoS problems separately. The third direction is the closely related work that discusses recent and most related systems.
2.1 Evaluation of famous protocols
Transmission control protocol (TCP) is a reliable trans-port protocol, which is widely used for data services, and is very efficient for wired networks [13]. Because of the particular specs of WSNs and the new requirements of applications over WSNs, TCP cannot be directly imple-mented in WSN environments. Using the TCP connec-tion with three-way handshake makes it costly and slow. In addition, TCP has degraded throughput in wireless system. Moreover, the required preprocessing or aggre-gation of data in intermediate nodes that is often neces-sary in WSNs prevents direct implementation of TCP in WSN environments is [14–16].
There are many protocols that are suggested to solve some QoS problems. The existing protocols are classified into three groups which are congestion control, reliability, and both of them. The first group is divided into two sub-groups: downstream and upstream. Pump slowly, fetch quickly (PSFQ) [17] and GARUDA [18] provide reliable communication from sink to sensor nodes. Both of these downstream protocols do not provide any congestion con-trol scheme. There are three transport protocols for up-stream reliability direction which are Reliable Multi-segment Transport Protocol (RMST) [19], Reliable Bursty Converge Cast (RBC) [20], and Energy-Efficient and Reliable Transport Protocol (ERTP) [21]. These up-stream protocols also have the same drawback as down-stream protocol, not providing any mechanism for congestion control. The second group, which is related to
only congestion control mechanism, contains five transport protocols. These protocols are Congestion Detection and Avoidance (CODA) [22], SenTCP [23], Fusion [24], Con-gestion Control and Fairness (CCF) [25], and Priority-based Congestion Control Protocol (PCCP) [26]. All of these protocols do not have any reliability mechanism. The third group, which concerns with both reliability and con-gestion control, contains three protocols. These protocols are Event to Sink Reliable Transport protocol (ESRT) [27], Sensor Transmission Control Protocol (STCP) [28] and Asymmetric and Reliable Transport (ART) protocol [29]. The main drawback of ESRT protocol is that it is not ap-plicable to many of the WSN applications because it as-sumes that the base station is one hop away from all sensor nodes. The main drawback of STCP is that it as-sumes that all sensor nodes within the WSN have clock synchronization. ART disadvantage is that the recovery of packet loss is not guaranteed especially when this loss oc-curs at non-essential nodes.
2.2 Evaluation of individual trials for enhancing WSNs QoS parameters
Cluster-based architectures are the most practical solu-tions in order to cope with the requirements of large-scale WSN [30]. This scheme divides the WSN into groups. Each group is called a cluster. Each cluster has a cluster-head and normal nodes. It solves the election problem of cluster-heads which is one of the basic QoS requirements of WSNs. The main disadvantage of this scheme is that it is not fault tolerant (what will be done if the cluster-head node fails?).
Another trial is proposed in [31]. The basic idea of this method is how to select the best route for data transmis-sion in WSN. This method is based on learning automata that selects the route as regards energy and distance to sink parameters. The main disadvantage of this method is the power of calculations and the time consumption that are taken during the automata learning which definitely affect the WSN.
Also, the Traffic-Aware Dynamic Routing (TADR) algorithm is proposed to route packets around the con-gestion areas and scatter the excessive packets along multiple paths consisting of idle and under-loaded nodes. Also, TADR algorithm is designed through con-structing a hybrid virtual potential field using depth and normalized queue length to force the packets to steer clear of obstacles created by congestion and eventually move toward the sink [32]. This algorithm alleviates the congestion control but does not solve the reliability problem and cannot be considered as a long-term solu-tion for the WSN QoS.
transmission rate [33]. The main disadvantage of this protocol is failure to ensure the end-to-end delay reduction.
Rate optimization for node level congestion is another scheme that is used to solve the congestion problem by avoiding the buffer overflow for each WSN node [34]. The main disadvantage of this technique is rate adjust-ment dependency. In addition, the overload of manage-ment messages is not considered in its design. An evaluation for WSN existing routing protocols to deter-mine which protocol can provide a better QoS using pa-rameters such as throughput, end-to-end delay, and packet loss is presented in [35]. An analysis of large-scale WSN as regards its QoS is proposed in [36]. This analysis contains scale the behavior of WSN which con-tains 1000 nodes using OMNET++. These nodes are ran-domly deployed. The parameters, which are used as a WSN specs, are coverage area, number of nodes, and power degree. A medium access control (MAC) protocol for heterogeneous wireless sensor networks to support QoS is introduced in [37]. This protocol provides adaptive be-havior using high channel utilization.
A data collection protocol called Energy-efficient Delay-aware Lifetime-balancing data collection (EDAL) is pro-posed in [38]. This protocol is scalable for large-scale network operations since it reduces computational over-head. It deals with the vehicle routing problems and promises considerable traffic cost reduction for collecting sensor readings under loose delay bounds. The protocol is considered as a special purpose one, and its results are not sufficient to evaluate its efficiency because the results’ comparison with that of other protocols were carried out without concerning WSN QoS protocols. A compressive data collection scheme for WSNs is presented in [39]. In this scheme, a power-law decaying data model is adapted to reduce energy consumption. The drawback of this scheme is that it manipulates energy parameter under spe-cial application which leads to inaccurate results. An ap-plication for compressed sensing to data collection in WSN is proposed in [40]. This application is used to minimize the network energy consumption. This pro-posed application neglects the time that is taken for com-pression process for the collected data. The results of this application are not sufficient because they depend on numerical simulation only. An approach to upgrade the Dynamic Source Routing (DSR) algorithm and ini-tiates a new route in case of link failure is presented in [41]. It is considered as a routing protocol and does not study the QoS parameters extensively; it just distinguishes between congestion and link failure con-ditions. Hierarchical Data Aggregation method using Compressive Sensing (HDACS) is introduced in [42]. It just optimizes the amount of transmitted data which de-creases energy consumption.
2.3 Closely related work
The transport protocol for reliable data transfer in WSN proposed by A. Ayadi in [43] is a very closely related work. The basic idea of this research is to propose a transport layer protocol to handle the reliability and the congestion control issues. The main shortcoming in this protocol is neglecting some important QoS parameters such as bandwidth utilization, energy consumption, dens-ity, and others.
3 Problem definition
Constraints and limitations imposed on WSNs affect their QoS and arise the following challenges: (1) Bandwidth: more difficulties arise due to the lack of bandwidth which affects the QoS in WSN. Based on the nature of stream, data compression and utilizing different bandwidth capabilities should be proposed to over-come the bandwidth problem. (2) Standardization: till now, most WSN layers do not have standard functions able to build a QoS. (3) Density: data redundancy is the density result. It may add overload and power consump-tion in gathering traffic to sink. In addiconsump-tion, it may add complexity and latency during QoS design. (4) Memory size: most proposals to enhance the QoS in WSN are af-fected with the limitation of memory (cache) size. Mostly, local memory is not enough to load the operating system with efficient QoS implementation. (5) Power: this is con-sidered as the most critical parameter which enforces every proposed protocol to touch the energy problem. So, local data processing and high compression should be done on each node before and during the transmission [44–46]. (6) Lifetime: Because most nodes operate on power source which may not be rechargeable, the WSN life is limited. Also, the ease of node damage is another challenge.
To solve each problem individually, the WSN may suffer from many other problems. So, general man-agement system should be introduced to be adapted with the numerous and sudden events which may occur in WSN.
4 The proposed WSN management system
4.1 WSN management system components
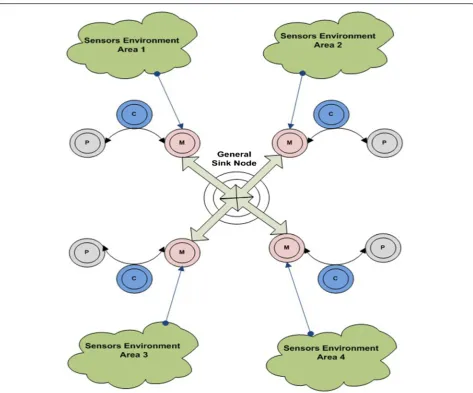
The proposed system consists of seven components as follows: the base station, the router, the General sink node, the Manager sink node, the Classifier sink node, the Prioritizer sink node, and the sensors. For interconnection between these components, see Figs. 1 and 2.
The base station
The base station is the central component that is used to gather data from distributed nodes. It consists of two main components, hardware and software. The hardware component includes a radio transceiver and a computer. The radio provides features such as multi hop networking and alternate operating frequencies. The computer is typically an inexpensive laptop that runs Ubuntu Linux. It is important to note that while most systems are using laptops with relatively small
memory requirement, the easiest way to improve system performance is by upgrading to a faster computer. This system supports several radio modules including the DigiDigiMesh 900 MHz and 2.4 GHz modules and the Digi XSC radio operating at 900 MHz. The software component contains four components: the user interface, the database, the base module, and the Grower Tools module [47].
The router
A router is a device that forwards data packets between computer networks. A router is connected to two or more data lines from different networks. When a data packet comes into one of these lines, the router reads the address information in the packet to determine its ultimate destination. Then, using information in its routing table or routing policy, it directs the packet to the next network on its journey. Routers perform the“traffic directing”
functions on the Internet. A data packet is forwarded from one router to another through the networks that constitute the internetwork until it gets to its destination node.
The General sink node
In the proposed system, the General sink node can be considered as the top layer. The General sink node is used to receive the cumulative reports from the lower layer. These reports contain information which scales the throughput of entire WSN. Upon these reports the General sink node can take a decision regarding some problems such as
congestion and delay. The General sink node should have powerful specifications like big buffer size, influential central processing units, and long power life. This is because it should accomplish more functions in the proposed management system. These functions are collection of reports received from the lower layer sink nodes, analysis of these reports, running decision making algorithms, information direction of each sink, and solving the problems which may occur within the WSN sessions.
The Manager sink node
The Manager sink node is the first component in the second layer of the proposed management system. The Manager sink node is considered as a head of sensors cluster. The job of the Manager sink node is to collect reports sent from the sensors in its cluster. Hence, it analyzes these reports and merges them in one report. Consequently, it should send this collective report to the General sink node in the upper layer. The main specifications, which should be required in the Manager sink node, are sufficient buffer space and powerful central processing unit (but not as powerful as the General sink node). The Classifier sink node
The Classifier sink node is the second component in the second layer of the proposed management system, see Fig.2. This sink node is found behind the Manager sink node. The job of the Classifier sink node is to rearrange and mark the information of sensors which are located in its Manager sink node area. Also, it should have the ability to differentiate between each type of data
(i.e., multimedia, text, or image). The specs of the
Classifier sink node are high buffer capacity and suitable processing power.
The Prioritizer sink node
The Prioritizer sink node is the third component in the second layer of the proposed management system. The job of this sink node is to determine the data that should be transmitted firstly especially in case of WSN starvation. The specs of this node are high buffer capacity and powerful processing unit. This sink node works on the reports which are received from the Manager sink node.
The sensor
The sensor is a device that gets a value for a parameter and converts it into a signal which can be read by a viewer using special applications. A sensor’s sensitivity is determined by how much the output of the sensor changes when the measured quantity changes. Sensors are used in everyday objects such as tactile sensor and lamps and numerous applications related to most of our life fields such as manufacturing, aerospace, and medicine.
4.2 How the system works
The proposed system comprises three management layers: the General sink node layer, the Multi-Functional sink layer, and the Sensors layer. The proposed WSN manage-ment system is considered as bi-directional due to the messages sent to and received from the system compo-nents. The first direction is from the Sensors layer to the Multi-Functional layer. In this direction the data, which are collected by sensors, is sent to the Multi-Functional layer components. Each component in this layer handles this data beginning from the Manager sink node, passing through the Classifier and Prioritizer sink nodes, and end-ing with the Manager sink node. Hence, the Manager sink node sends this data to the General sink node layer. The other direction starts with the General sink node layer through the Multi-Functional layer down to the Sensors layer.
the collected environmental data are sent to the Man-ager sink node [48]. Hence, the ManMan-ager sink node col-lects and filters the sensors messages. The Manager filtering process separates the correct data from the cor-rupted data which decreases the WSN overload. Corres-pondingly, it collects the correct data in one report. The filtering process uses the scheme stated in [49] that is based on statistical data analysis for periodically aggre-gates sensors’ survival massages to detect failure nodes and their corrupted data. The Manager sink node sends a copy from its cumulative report to the Classifier sink node. The Classifier node signs each data depending on its type. Hence, easily, it can separate each data type in one group, which helps the entire system to send special required information in a specific time. To accomplish this job, the classifier uses the technique presented in [50]. Furthermore, the Manager sink node sends a copy from its report to the Prioritizer sink node. The Prioritizer sink node determines the data which should be sent firstly. These data can be determined as regards some parameters such as the WSN throughput, available com-ponent power, and importance of transmitted data which can be defined from the system feedback process [51]. The second connection type is from the Manager sink node, the Classifier sink node, and the Prioritizer sink node to the General sink node. The Manager sink sends its report to the General sink node to describe each sensor status, which is determined using some parameters such as level of each sensor power, congestion time and MAC
address, bandwidth consumption, and notable data type that should be sent from this area. Also, the Classifier sink node sends its report to the General sink node. Moreover, the Prioritizer sink node sends its report, which contains prioritized data, to the General sink node. This report contains the state of the collected data which describes type, size, and history of this data. The Prioritizer report contains the most important data, followed by the least important data.
The second direction is an opposite of the first one and starts as follows: the General sink node receives the Multi-Functional layer reports. The General sink node analyzes these reports using Locally Linear Approximating (LLA) algorithm found in [52]. The General sink node scales the throughput of each WSN cluster using some parameters such as the bandwidth, the size of transmitted data, the delay, and the congestion. Also, these parameters are com-pared with the sensors power capacity. The General sink node sends a report to the Manager sink node informing it with the descriptive state of its WSN cluster sensors (whether it is in sleep mode or active mode). Hence, the Manager sink node should send a simple message to the sensors specifying the state of each one. The special case of this direction is done when an urgent event occurs such as critical power levels of sensors or bottlenecks. So, a special report should be sent from the General sink node to the Manager sink node containing the description of this
urgent event with steps that should be followed to solve the resulting problems. The communication be-tween the system components should be done by High Altitude Platforms (HAPs) or satellite [53]. For more clarification, see Algorithm 1.
4.3 The system report strategies
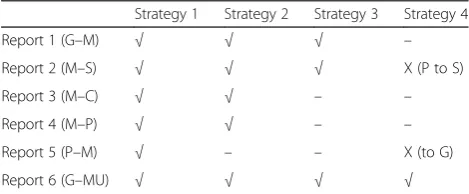
There are four strategies to determine the flow of re-ports inside the proposed system. These strategies are stated as follows:
1. Strategy 1: The sensors send their reports to the Manager sink node. Hence, the Manager sink node sends its report to the Classifier sink node.
Consequently, the Classifier sink node sends its report to the Prioritizer sink node which sends its report to the General sink node, see Fig.3. 2. Strategy 2: The sensors send their reports to the
Manager sink node. Hence, the Manager sink node multicasts its report to the Classifier and the Prioritizer sink nodes. Consequently, each sink node in the Multi-Functional layer (Manager, Classifier, and Prioritizer) sends its report to the upper layer (General sink node), see Fig.3.
3. Strategy 3: this strategy type is considered as an optimistic one. In this strategy, the sensors send their reports to the Manager sink node. Hence, the Manager sink node sends a cumulative report directly to the General sink node provided that the system should be free from congestion or power limitation, in addition to availability of the required bandwidth. In this case, there is no need to Classifier or Prioritizer sink nodes, see Fig.3.
4. Strategy 4: this strategy is pessimist. In this strategy, after analyzing of periodically received reports, General sink node determines if the WSN is starved or not. In case of WSN starvation, the Prioritizer sink node sends two copies of reports one to the sensors to determine their states (active or passive) within a time, and the other report will be sent to the General sink node for informing with the new state of WSN. Moreover, the reports from the Manager sink node to the Classifier and Prioritizer sink nodes should be stopped. Furthermore, some of sensors in each group should stop sending the environmental data. In addition, the sensors should send their reports directly to the Prioritizer sink node, see Fig.3. The
differentiation between these strategies will be described in the simulation results in Section6.
4.4 The proposed system reports description
address (MAC address or IP address), and receiver ad-dress. The second report is sent from the Manager sink node to the sensors in its group. This report informs each sensor with its status (active or passive). The third report is sent from the Manager sink node to the Classifier sink node. This report contains the data that is merged by the Manager sink node. The fourth report is sent from the Classifier sink node to the Prioritizer sink node. This report contains the data that is classified de-pending on its type. The Prioritizer sink node deter-mines the data that should be sent firstly depending on the WSN QoS parameters such as bandwidth, sensor power level, and delay. The fifth report is sent from the Prioritizer sink node to the Manager sink node. This re-port contains the last processing step that is executed on the collected data. The sixth report is sent from the Manager sink node to the General sink node. This re-port may be handled by the Manager sink node in case of special events occurrence during the extraction cycle of the final report that will be sent to the General sink node. In addition, there are many special messages that may be sent from the Prioritizer sink node to the General and Manager sink nodes. The infrastructure of these messages is the same as the fifth report but with different source and destination addresses. For more de-scription, see Fig. 4 and Table 1.
4.5 The proposed system advantages
The advantages of the proposed system are as follows:
1. Awareness: it is aware with up-to-date changes in WSN.
2. Flexibility: it gives more than one strategy to deal with WSN different states.
3. Adaptive: it minimizes or maximizes the transmitted information.
4. Fault tolerance: it comprises recovery technique. 5. Scalability: the infrastructure of the proposed system
is based on sensors clustering idea.
5 The proposed system mathematical analysis To clarify the deployment of each object of the proposed WSN system (sensors, sinks, prioritizer, and classifier), a
Table 1Strategies types and system reports
Strategy 1 Strategy 2 Strategy 3 Strategy 4
Report 1 (G–M) √ √ √ –
Report 2 (M–S) √ √ √ X (P to S)
Report 3 (M–C) √ √ – –
Report 4 (M–P) √ √ – –
Report 5 (P–M) √ – – X (to G)
Report 6 (G–MU) √ √ √ √
mathematical analysis should be introduced. This math-ematical analysis contains two main parts. The first part describes how sensors and sinks will be distributed in the WSN system. The second part demonstrates the adaptation of two-queue probability scheme to be ap-plicable on the prioritizer object after the data is clas-sified [54].
5.1 Sensor and sinks
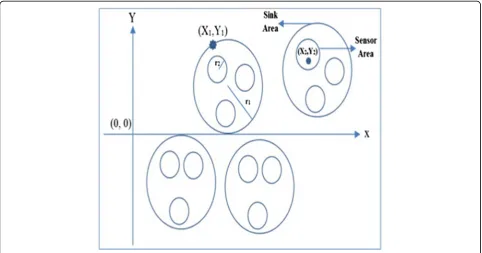
There are two distributions in the proposed manage-ment system, one to determine how the sensors are distributed in the target area and the other distribu-tion is used to specify a sink for a group of sensors. The Gaussian distribution is used as sensors deploy-ment due to its high capability in hot spot detection with differentiated QoS for different applications. Poisson is used for sinks distribution due to its effi-ciency in distant targets cases [55].
Suppose that we haven sensors and msinks. Sensors and sinks are distributed over a square region. In addition, sensors are distributed to each sink over a cir-cular region with different areas equal to πr2Si, see Fig. 5. The sinks are distributed using the Poisson distribution with density function parameter λi such thatλi= Ki/A,
i= 1 tom,kiis the number of sensors in each sinkSiin
the WSN region, andAis the square area. The WSN is considered heterogeneous; each sink collect data from dif-ferent number of sensors. The probability ofhisinks
distri-bution over group of sensors such that one sink for each
group of sensors (one sink can cover different regions) is given by Eq. 1.
On the other hand, the Gaussian probability density function to distribute one sensor that has coordinates (x2, y2) and deployed to monitor specific area using
To detect the event that occurs at point with coordinates (x1,y1), at least one sensor should be deployed and
distrib-uted using Gaussian. The location of sensor (x2, y2)
con-firms to ((x2−x1)2+ (y2−y1)2)≤r22, wherer2is the radius of a
circular region that is covered by the (x2,y2) sensor.
Intern-ally in each sinkSi, the probability of distribute kisensors
using Gaussian is given by Eq. 3.
Psensorsðx2;y2Þ ¼
probability to select one sink(s) for collecting a data from a specific group of sensors in a special area from general tar-get region or selecting sensor to monitor a hot spot can be determined from Eq. 4:
We apply the two priority queuing schemes [56] on the proposed WSN system to analyze relationship between the Classifier and the Prioritizer. In this scheme, we try to prioritize data collected by the proposed system sinks to decrease both the probability of delay and loss. The transmitted data are filtered into two classes, namely class 1, and class 2. The most important data are assigned to class 1 based on predefined rules. The data having less importance are assigned to class 2. Class 1 data are en-queued into a fast queue that has higher ser-vice priority. Class 2 data are en-queued into another queue with middle priority. The proposed scheme structure is shown in Fig. 6. For integration, next-generation routers should be designed to make data pre-classification.
In this scheme, a linear data model is used. The linear formula used is Pij=λi+μj, where Pij represents the
transition probability from state i to state j, andλand μ represent the birth and death rates, respectively.
The scheme represents the two data classes by the cor-responding queues Q1 and Q2, respectively. At any time, any data may be en-queued into one of these two queues by the classifier as shown in Fig. 6. The two-queue scheme mechanism is summarized in the following steps:
Step 1: The prioritizer distributes the incoming data into the system’s queues according to predefined priorities within a time interval determined by the server. The initial probabilities of the prioritizer selection of system queues arePr1andPr2, where
X2
i¼1pri¼1.
Step 2: During servicing, within a time interval, if the serviced data cannot be completed due to low bandwidth or queue congestion, the proposed system will give the QoS priority to the next data that should be serviced in the same queue.
Step 3: The incomplete processed data should be transferred to the next queue with the lower priority. Step 4: While Q2 is empty, the data processing will continue in Q1 with a predefined time interval provided that QoS, which is required for Q1, is available.
Step 5: Once Q1 becomes empty, the system starts to service data in Q2 again.
Step 6: If a data has incomplete service in Q1, it should be moved to the next queue Q2.
Step 7: While the system is servicing data in Q2, if a data is received into Q1, the system jumps immediately to Q1 and service this new coming data.
5.3 Scheme state transitions
To clarify the Markov chain model for the two queuing sys-tem, we define Q1 as state 1 and Q2 as state 2. The time which is used by the system to service one data packet is denoted by τ, (τ= 1, 2, 3 …). The transitions over these states are for either servicing or waiting. The transition from one state to any other state is shown in Fig. 7.
Let {Y(τ),τ≥1} be a Markov chain where Y(τ)denotes the selected queue at the τth time interval. The state space of the random variable Y is {Q1,Q2}. The initial Fig. 6Two-queue data servicing scheme structure
selection probabilities of queues are Pr1=P [Y(0)=Q1]
and Pr2=P[Y(0)=Q2] where
X2
i¼1pri¼ 1.
LetSij(i,j= 1, 2) be the transaction probabilities of the
system over the two states; the state transition matrix forY(τ)is expressed as follows:
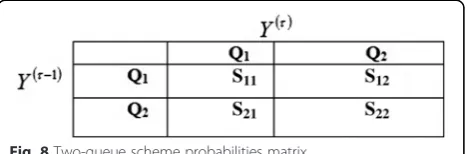
To handle all transitions, we applied the row dependent modelPij=λ1i+i(μj).
There are two parameters, λ1 and μ, used to manage
the data analysis related to queue transition probabilities. Figure 8 shows the data model for two-queue scheme. Whereidenotes the number of queues (i= 2), in case of a two-queue scheme.
6 Simulation and evaluation
In this section, a simulation environment is constructed using the network simulation package (NS2) [57]. This environment is used to test the proposed WSN network management system and compare it with a current (normal) WSN management system. This current sys-tem means that the WSN sensors are distributed using Gaussian in available area without any strategy for de-fining the states of WSN at every interval. The infra-structure of this current WSN management system is found in [58]. There are two subsections: the first one
describes the simulation setup and the second one shows the discussion of simulation results.
6.1 Simulation setup
In our simulation, the WSN is divided into multiple groups. Each group contains number of sensors. Each group is responsible for gathering the required informa-tion about its environment. The exchanged informainforma-tion, which is used in this simulation, includes multimedia, im-ages, and text. The multimedia data uses the jpeg extension. The image data uses the jpg extension. The sensor nodes are distributed in square area. The management sink nodes (General, Manager, Classifier, and Prioritizer) are located in the center of sensors nodes in each group. Furthermore, each node should be defined as a compound module con-taining radio, application, MAC, routing, and management strategy. The definition of protocols and parameters in our simulation is necessary because it declares the simulation results. The simulation parameters are listed in Table 2.
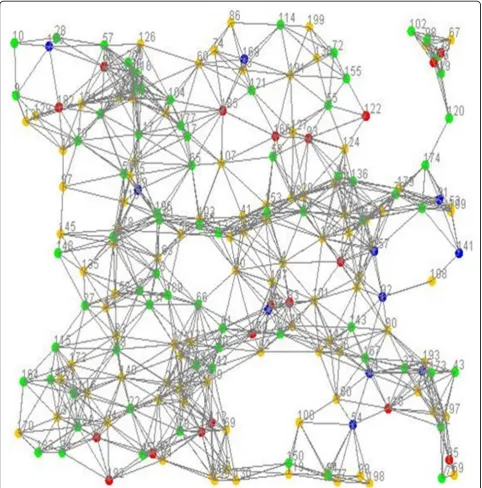
In order to evaluate the performance of the proposed management system, some metrics should be introduced to describe the supposed WSN configurations. These con-figurations should be the same as real world WSN appli-cations in addition to simulation-based studies. Moreover, the simulation metrics should determine the different be-haviors of WSN with topology as described in Fig. 9. The simulation performance parameters are as follows:
Throughput:one of the performance metrics that should be calculated at each sink node and is defined as the num-ber of the packets successfully received at the sink node divided by the total number of the packets sent to the sink node including any retransmissions. Latency: is the amount of time which is needed to transfer one packet from one sensor to the General sink node. The latency performance parameter is calculated at the application level. There are some variables which affect the latency parameter. These variables are network size, topologies, and collision models.Total transmitted data to the General sink node: there are two levels of this metric. The first level refers to the number of packets which have been sent to the Manager sink node by the sensor nodes. The second
Table 2Simulation parameters
Simulation parameter Value Simulation parameter Value
Simulation time 500 s Number of sensors Between 200 and 300
Number of networks 20 Collusion Yes
Simulation field 126 ×126 m MAC protocol TMAC
Mobile object inter-arrival 5 Routing protocol Multipath routing protocol
Sink distribution Poisson Sensor distribution Gaussian
Packet rate 250 kbps Maximum MAC Frame size 2500
Radio bandwidth 25 MHz Modulation type PSK
Y(τ−1) Y(τ)
Q1 Q2
Q1 S11 S12
Q2 S21 S22
level refers to the number of packets which have been sent to the General sink node by the Manager sink node. In other words, it refers to the time taken by the sensor nodes to detect the required environment infor-mation and report it to the adjacent sink node. Sink node failed packets: this parameter is the number of failed packets which should be sent to the sink node ei-ther Manager or General due to collision occurrence.
The power degree: this parameter refers to the sensor power which is still charged and the rate of discharging
accuracy. The Prioritizer accuracy equals the con-sumption time, which is used to build and fill the pri-ority queue. The report strategy efficiency: this parameter is scaled with the number of transmitted messages within the entire WSN as regards the avail-able bandwidth. This parameter is scaled under three WSN states: normal, collision, and starvation. These states have three levels of QoS that is required to transmit data messages and reports.
6.2 Results and discussion
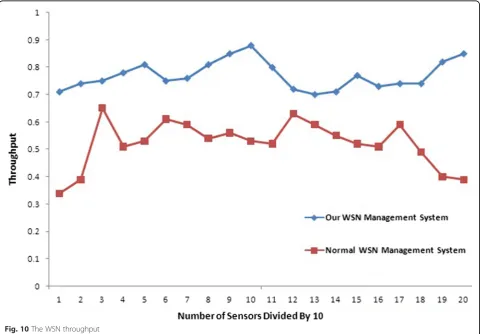
The throughput of the network is high because the network management system divides the WSN into groups. Each of these groups has a well defined area. The simulation results in Fig. 10 prove this claim. The fluctuations of throughput in our management system are minor and less than the current management system fluctuations. The throughput is expected to increase gradually if the number of nodes is increased. But the re-sults, which are provided in Fig. 10 for various numbers of nodes till 100 nodes, do not prove this note exactly due to the collision, which occurred when the number of nodes equals 130 and causes a notable decrease in the throughput.
In the simulation system, the end-to-end latency under different number of nodes with the Manager sink node is measured. In our management WSN system, majority of the packets, which should reach to the Manager sink node, needs more time. This delay occurs when the number of nodes increases. This note can be interpreted using the fact that states “by increase in the number of nodes, the packets, which are transmitted through more servers to reach the destination, should be delayed”. Figure 11 shows that the increase in the number of nodes means that most of the packets reach the sink node with delay.
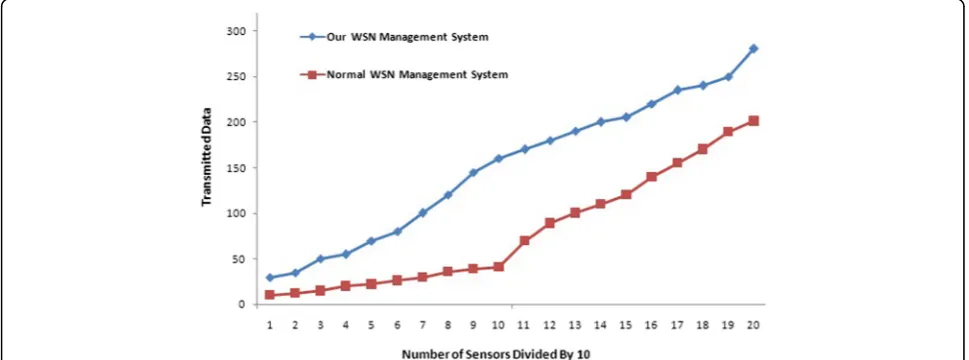
In the simulation system, the number of nodes increases means the total data transmission measured at the manager sink node increases. Figure 12 illustrates this fact.
In a real WSN, more collision occurs during transmission in a dense network means the number of failed packets during transmission is expected to increase by increase in the number of nodes. In Fig. 13, the simulation results show increase in the number of failed packets as the num-ber of nodes grows up. For a numnum-ber of nodes of 170, there is a significant decrease in the dropped packets. This is due to the collision model which is built in the configuration of simulated WSN.
In this simulation, the power degree for each sensor node, the Manager sink node, the Classifier sink node, the Prioritizer sink node, and General sink node are introduced. Figure 14 shows that the power consumption in case of sensor nodes is high. This is due to the collection of huge environmental information which is the responsibility of the sensor nodes. The power consumption of Manager sink node is high but less than that of the sensor nodes. This is due to the huge number of sensors which should send their information to the Manager sink node. The Classifier and Prioritizer sink nodes consume low power because their functions are considered cumulative information handling. The General sink node is the node with minimum
consumption of power due to the long inter-processing time which is required to handle a special event. Overall re-sults of power consumption prove that the proposed man-agement system has best performance than the normal one.
Figure 15 shows the efficiency of each sink node (General, Manager, Classifier, and Prioritizer). It is not-able that the efficiency of the General sink node is the best one due to the high processing specs which should be found in this node, in addition to the low communi-cation overloading. The efficiency of the Manager sink node is the worst one due to the number of communi-cations which should be accomplished with the
Sensors, the Classifier sink node, the Prioritizer sink node, and the General sink node. In addition, the pro-cessing functions, which should be done on the col-lected data to be ready for the Classifier and the Prioritizer sink nodes, take a time and in some situa-tions produce some dramatic packet drop.
The proposed system report strategies represent an im-portant parameter in testing of the proposed WSN man-agement system. Depending on the WSN state, the report strategy can be selected. This makes our proposed system flexible and can face the sudden states, which may occur
due to some internal or external factors. Figure 16 proves that the strategy 1 and the strategy 2 are suitable for normal WSN state. But, in case of collision state, the strategy 3 and the strategy 4 enhance the WSN efficiency compared with the strategy 1 and the strategy 2. Regarding the WSN star-vation state, the strategy number 4 is the best because it in-creases the WSN efficiency.
7 Conclusions
In this paper, a novel management system to manage WSNs and guarantee the QoS parameters such as
Fig. 14The power degree for each WSN management component
bandwidth, delay, jitter, and energy is introduced. The pro-posed system consists of three layers: the General sink node layer, the Multi-Functional layer, and the Sensors layer. The basic idea of this system is to distribute management pro-cesses on multiple components. The simulation results prove that the proposed system enhanced the traditional WSN system in the following metrics, the throughput, the latency, the lost packets, and the sensor power consump-tion. Also, the results showed that the efficiency of each management component is between 89.2 and 99.1 %. In addition, the WSN is adaptive system because it can change its strategy in case of sudden event occurrence.
Furthermore, the proposed management system is scalable because its infrastructure is based on the clustering strat-egy. Accordingly, the proposed management system can be considered as a long-term solution to guarantee the QoS for WSNs.
8 Future work
There are three steps that should be accomplished in the future: (1) the simulation environment should be more complex and wider, (2) the prioritization technology should be tested under more than one queuing
Fig. 16The efficiency of each strategy with different WSN states
system, and (3) the number of management sinks should be decreased and tested to reach the standardization.
Competing interests
The authors declare that they have no completing interests.
Received: 8 July 2015 Accepted: 14 September 2015
References
1. M Li, Z Li, V Vasilakos, A Survey on Topology Control in Wireless Sensor Networks: Taxonomy, Comparative Study, and Open Issues. in proceedings of the IEEE.101(12), 2538–2557 (2013). doi:10.1109/JPROC.2013.2257631 2. K Han, J Luo, Y Liu, V Vasilakos, Algorithm design for data communications
in duty-cycled wireless sensor networks: a survey. IEEE Commun. Mag.
51(7), 107–113 (2013)
3. S Sengupta, S Das, M Nasir, V Vasilakos, W Pedrycz, An evolutionary multi objective sleep-scheduling scheme for differentiated coverage in wireless sensor networks. IEEE Trans Syst. Man. Cybern. Syst Part C42(6), 1093–1102 (2012) 4. Y Song, L Liu, H Ma, V Vasilakos, A biology-based algorithm to minimal
exposure problem of wireless sensor networks. IEEE Trans. on Network and Service Management11(3), 417–430 (2014)
5. Y Liu, N Xiong, Y Zhao, V Vasilakos, Multi-layer clustering routing algorithm for wireless vehicular sensor networks. IET Commun.4(7), 810–816 (2010) 6. T Meng, F Wu, Z Yang, G Chen, A Vasilakos,“Spatial reusability-aware
routing in multi-hop wireless networks,”IEEE TMC; PP (99):1 (2015). doi:10.1109/TC.2015.2417543.
7. D Chen, K Varshney, inProceedings of the International Conference on
Wireless Networks (ICWN).QoS Support in Wireless Sensor Networks:
A Survey (Las Vegas, Nevada, USA, 2004), pp. 227–233.
8. L Tao, F Yu, inProceedings of the IEEE International Conference on
Cyber Technology in Automation, Control, and Intelligent Systems. A
Novel Congestion Detection and Avoidance Algorithm for Multiple Class of Traffic in Sensor Network (Kunming, China, March 20-23, 2011), pp.72-77.
9. O Said, A Novel, System for guaranteeing quality of service in wireless sensor networks: design, simulation and evaluation. International Journal of Computer Applications64(5), 21–24 (2013). doi:10.5120/10630-5359
10. E Elshaheda, R Ramadanb, S Al-tabbakha, H El-zaheda, Modified gur game for WSNs QoS control. Elsevier Procedia Computer Science32, 1168–1173 (2014)
11. A Malik, J Qadir, B Ahmad, K Yau, U Ullah, QoS in IEEE 802.11-based wireless networks: a contemporary review. Elsevier J Netw Comput Appl55, 24–46 (2015)
12. O Said, A. Elnashar, Scaling of wireless sensor network intrusion detection probability: 3D sensors, 3D intruders, and 3D environments. Springer EURASIP Journal of Wireless Communication and Networking, 46, (2015). doi:10.1186/ s13638-015-0240-6.
13. W Yu, X Qian, inProceedings of the International Symposium on
Knowledge Acquisition and Modeling. Design of 3KW Wind and Solar
Hybrid Independent Power Supply System for 3G Base Station (Wuhan, China, 2009), pp. 289–292.
14. Y Liu, X Jiang, X Nian, W Lu, inProceedings of the Eight IEEE International
Conference on Computer and Information Science (ACIS). Improved DCCP
Congestion Control for Wireless Sensor Networks (Shanghai, China, 1–3 June 2009), pp. 194–198.
15. C Wang, K Sohraby, A survey of transport protocols for wireless sensor networks. IEEE Network20(3), 34–40 (2006)
16. Q Pang, V Wong, V Leung, Reliable data transport and congestion control in wireless sensor networks. InderScience Int. Journal Sensor Networks3(1), 16–24 (2008)
17. C Wan, A Campbell, L Krishnamurthy, inproceedings of the 1st ACM
International Workshop on Wireless Sensor Network and Application. PSFQ: A
Reliable Transport Protocol for Wireless Sensor Network (Atlanta, GA, USA, 2002), pp. 1–11.
18. S Park, R Vedantham, R Sivakumar, I Akyildiz, inProceedings of the 4th ACM international symposium on Mobile ad hoc networking and
computing (MobilHoc). A Scalable Approach for Reliable Down Stream
Data Delivery in Wireless Sensor Network (Tokyo, Japan, 2004), pp. 78–89.
19. F Stann, J Heidemann, inProceedings of the IEEE International Workshop on
Sensor Net Protocol and Applications (SNPA). RMST: Reliable Data Transport in
Sensor Networks (AK, USA, 11 May 2003), pp. 102–112.
20. H Zhang, A Arora, Y Choi, M Gouda, inProceedings of the 4th ACM international symposium on Mobile ad hoc networking and computing
(MobilHoc). Reliable Bursty Converge Cast in Wireless Sensor Networks
(Tokyo, Japan, 2005), pp. 266–276.
21. T Le, W Hu, P Corke, S Jha, RTP: energy-efficient and reliable transport protocol for data streaming in wireless sensor networks. Elsevier J of Compu. Commun.32(7), 1154–1171 (2009)
22. C Wan, S Eisenman, inProceeding of the ACM Sensys’03. A Campbell, CODA: Congestion Detection and Avoidance in Sensor Networks (Los Angeles, CA, USA, November 05–07, 2003), pp. 266–279.
23. C Wang, K Sohraby, B Li, inProceeding of the IEEE INFOCOM. SenTCP: A Hop-by-Hop Congestion Control Protocol for Wireless Sensor Networks (Miami, Florida, USA, 2005).
24. B Hull, K Jamieson, H Balakrishnan, inProceedings of the 2nd international conference on Embedded networked sensor systems
Sensys’04.Mitigating Congestion in Wireless Sensor Networks
(Baltimore, MD, USA, 2004), pp. 134–147.
25. C Ee, R Bajcsy, inProceedings of the 2nd international conference on
Embedded networked sensor systems Sensys’04. Congestion Control and
Fairness for Many-to-One Routing in Sensor Networks (Baltimore, MD, USA, 2004), pp. 148–161.
26. C Wang, K Sohraby, V Lawrence, L Bo, H Yueming, inProceedings of the IEEE International Conference on Sensor Networks, Ubiquitous, and Trustworthy
Computing (SUTC’06).Priority-Based Congestion Control in Wireless Sensor
Networks (Taichung, Taiwan, 2006), pp. 8. doi:10.1109/SUTC.2006.1636155 27. O Akan, I Akyildiz, Event-to-sink reliable transport in wireless sensor network.
IEEE/ACM Trans. on Networking13(5), 1003–1016 (2005) 28. Y Iyer, S Gandham, S Venkatesan, inProceedings of the IEEE Computer
Communications and Networks (ICCCN). STCP: A Generic Transport Layer Protocol
for Wireless Sensor Networks (San Diego, CA, USA, October, 2005), pp. 449–454. 29. N Tezcan, W Wang, ART: an asymmetric and reliable transport mechanism
for wireless sensor network. International Journal of Sensor Networks2(3), 188–200 (2007)
30. M Sabarish, M SashiRekha, inproceedings of the International conference on
Emerging Trends in Electrical and Computer Technology (ICETECT). Clustering
Based Energy Efficient Congestion Aware Protocol for Wireless Sensor Networks (Tamil Nadu, India, 2011), pp. 1129–1135.
31. E Hajian, K Jamshidi, A Bohlooli, Improve energy efficiency routing in WSN by using automata. International Journal of Ad hoc, Sensor & Ubiquitous Computing (IJASUC)1(2), 1–7 (2010)
32. F Ren, S Das, Traffic-aware dynamic routing to alleviate congestion in wireless sensor networks. IEEE Transactions on Parallel and Distributed and Distributed Systems22(9), 1585–1599 (2011)
33. M Bhuiyan, I Gondal, J Kamruzzaman, inProceedings of the International
Conference on Information Networking (ICOIN). CODAR: Congestion and
Delay Aware Routing to Detect Time Critical Events in WSNs (Barcelona, Spain, 2011), pp. 357–362.
34. N Prabakaran, B Shanmuga, R Prabakaran, V Dhulipala, inProceedings of the
International conference on Devices and Communications (ICDeCom).Rate
Optimization Scheme for Node Level Congestion in Wireless Sensor Networks (Mesra, Malaysia, 2011), pp. 1–5.
35. B. Kaur, S. Kaushal, inProceedings of the IEEE Recent Advances in Engineering
and Computational Sciences (RAECS).QoS Based Evaluation of Routing
Protocols in WSN (Chandigarh, India, 2014), pp. 1–7.
36. G Horvat, J Zagar, D Vinko, inProceedings of the IEEE 3rd Mediterranean Conference
on Embedded Computing (MECO).Influence of Node Deployment Parameters on
QoS in Large-Scale WSN (Budva, Montenegro, 2014), pp. 202–205. 37. M Souil, A Bouabdallah, A Kamal, Efficient QoS provisioning at the MAC
layer in heterogeneous wireless sensor networks. Elsevier J of Compu. Commun.43(1), 16–30 (2014)
38. Y Yao, Q Cao, V Vasilakos, EDAL: an energy-efficient, delay-aware, and lifetime-balancing data collection protocol for heterogeneous wireless sensor networks. IEEE/ACM Trans. on Networking23(3), 810–823 (2015) 39. X Liu, Y Zhu, L Kong, C Liu, Y Gu, V Vasilakos, M Wu, CDC: compressive data
40. L Xiang, J Luo, A Vasilakos, inProceedings of the IEEE International Conference on Sensor, Mesh and Ad Hoc Communications and Networks (SECON).
Compressed Data Aggregation for Energy Efficient Wireless Sensor Networks (Salt Lake City, UT, USA, 27–30 June 2011), pp. 46–54. 41. N Chilamkurti, S Zeadally, A Vasilakos, V Sharma, Cross-layer support for
energy efficient routing in wireless sensor networks. Journal of Sensors, 1–9 (2009). doi.org/10.1155/2009/134165.
42. X Xu, R Ansari, A Khokhar, A Vasilakos, Hierarchical data aggregation using compressive sensing (HDACS) in WSNs. ACM Transactions on Sensor Networks (TOSN)11(3), 25–45 (2015)
43. A Ayadi, Energy-efficient and reliable transport protocols for wireless sensor networks: state-of-art. Journal of Wireless Sensor Network3(3), 106–113 (2011) 44. G Aldabbagh, S Bakhshb, N Akkari, S Tahir, H Tabrizi, J Cioffi, QoS-aware
tethering in a heterogeneous wireless network using LTE and TV white spaces. Elsevier Journal of Computer Networks81(22), 136–146 (2015) 45. M Hammoudeha, R Newmanb, Adaptive routing in wireless sensor networks:
QoS optimization for enhanced application performance. Elsevier Journal of Information Fusion22, 3–15 (2015)
46. Sohrabi, J Gao, V Ailawadhi, J Pottie, Protocols for self organization of a wireless sensor network. IEEE Personal Communication Magazine7(5), 16–27 (2000)
47. K Akkaya, M Younis, W Youssef, Positioning of base stations in wireless sensor networks. IEEE Commun. Mag.45(4), 96–102 (2007)
48. M Azharuddin, P Kuila, K Jana, inProceedings of the IEEE International Conference on Advances in Computing, Communications and Informatics
(ICACCI).A Distributed Fault-Tolerant Clustering Algorithm for Wireless
Sensor Networks (India, 22–25 Aug. 2013), pp. 997–1002.
49. S Hong, inProceedings of the IEEE 13th International Conference on High
Performance Computing and Communications (HPCC).A New Data Filtering
Scheme Based on Statistical Data Analysis for Monitoring Systems in Wireless Sensor Networks (Banff, Alberta, Canada, 2–4 Sept. 2011), pp. 635–640.
50. G Tsagkatakis, inProceedings of the IEEE 7th Conference Sensor Array and
Multichannel Signal Processing Workshop (SAM).Dictionary Based
Reconstruction and Classification of Randomly Sampled Sensor Network Data (NJ, USA, 17–20 June 2012), pp. 117–120.
51. V Potdar, D. Rathnayaka, inProceedings of the 24th IEEE International Conference on Advanced Information Networking and Applications (AINA).
Prioritizing Information for Achieving QoS Control in WSN (Perth, Australia, 20–23 April 2010), pp. 835–842.
52. X Song, C Wang, inProceedings of the IEEE International Conference on
Networking, Sensing and Control (ICNSC).A Data Analysis and Visualization
Algorithm Based on Locally Linear Approximating for WSN (IL, USA 10–12 April 2010), pp. 507–511.
53. A Mohammed, N Pavlidou, M Mohorcic, The Role of High-Altitude Platforms (HAPs) in the Global Wireless Connectivity. Proceedings of the IEEE99(11), 1939–1953 (2011)
54. O Said, A Elnashar, Probabilistic queuing scheme for servicing e-mails using Markov chains. Journal of Theoretical and Applied Information Technology
56(2), 314–323 (2013)
55. Y Wang, M Wilkerson, X Yu, inProceedings of the International Conference on
Wireless Communications and Mobile Computing (IWCMC).Hybrid Sensor
Deployment for Surveillance and Target Detection in Wireless Sensor Networks (Istanbul, Turky, 2011), pp. 326–330.
56. M Marsono, M El-Kharashi, F Gebali, Prioritized e-mail servicing to reduce non-spam delay and loss: a performance analysis. International Journal of Network Management18(4), 323–342 (2008)
57. The Network Simulator - ns-2, 2008, http://www.isi.edu/nsnam/ns/ Accessed 27 Sept. 2015
58. A Abdulmaowjod, M Mohammed, inProceedings of the 1st International
Conference on Energy, Power and Control (EPC-IQ).Simulation and
Performance Study of Wireless Sensor Network (WSN) Using MATLAB (Basra City, IRAQ, 2010), pp. 307–314.
Submit your manuscript to a
journal and benefi t from:
7Convenient online submission 7Rigorous peer review
7Immediate publication on acceptance 7Open access: articles freely available online 7High visibility within the fi eld
7Retaining the copyright to your article