R E S E A R C H
Open Access
Analysis of the spectrum transform for
narrow-band signal passing through
nonlinear section of a digital radar receiver
Haijiang Wang
*, Yangyang Deng, Bao Dong and Debin Su
Abstract
In this paper, with the analytical method, the problem of unexpected bandwidth occupying is investigated firstly when a narrow-band signal passes through the inertialess nonlinear section of a digital radar receiver. Afterwards, the frequency aliasing that is caused by the digitalization is studied. To solve these two issues, the selection of the sampling frequency is of great importance. In this paper, a maximizing minimum arc-distance strategy is proposed, which is dependent on the frequency range of the signal. The arc-distance method is designed for optimizing the sampling frequency. Furthermore, with this method, the minimum arc distances between the frequency bands of the signal and the interferences can be calculated. The inter-band arc distances are important references for optimizing the transition bandwidth of the filter after the sampling and demodulation process.
Keywords:Spectrum transform, Narrow-band signal, Nonlinear section, Digital radar receiver
1 Introduction
The dynamic range of the signal to be processed by some certain kinds of radar receivers is very large. For example, the RF signal’s dynamic range of weather radar can be as wide as about 94 to 100 dB [1]. To meet this wide dy-namic range requirement, automatic gain control (AGC) in IF stage plays an indispensable role in analog circuitry. With the rapid development and popularization of digital electronic technology, in recent years, to improve per-formance and simplify system, hardware digitization has long been introduced in this area and more and more ana-log function circuits have been replaced with digital ones [2, 3]. Orthogonal demodulation now proceeds digitally with satisfactory performance and the function of amplifi-cation of IF stage is actually saved [4, 5]. As ADC is moved further towards radar’s analog front end by employing ad-vanced under-sampling ADC chip, the signal added to AD converter has a large dynamic range because of the ab-sence of AGC function which is originally in the analog circuit, and nonlinear effects caused by the strong signal become apparent. Especially, after the digitization of the signal which has been subjected to nonlinear distortion,
the harmonic component of the signal will invade the signal frequency band because of aliasing effect, causing additional distortion.
Many researchers have investigated the nonlinearity in digital communication and radar systems. For example, Lin et al. analyzed the problem of fifth-order nonlinear distortion and spectral regrowth in a communication system [6, 7]. Wang et al. studied the nonlinearity of the mixer and VCO in the FMCW V-band radar receiver [8]. In [9], Harrington discussed the nonlinearity of the active array radar and gave a spectral analysis of third-order intermodulation clutter. In [10], Mark B. Yeary an-alyzed the intermodulation product caused by the power amplifier’s nonlinear response. In [11], A. W. Doerry et al. investigated spurious effects of analog-to-digital con-version nonlinearities on radar range-Doppler maps. And in [12], Grimm et al. focused on the analysis and digital mitigation of nonlinear distortion in software-define radio receivers; they derived a nonlinear distor-tion model in time and frequency domain and suggested an adaptive digital feed-forward linearization structure to mitigate the nonlinear distortion. But by now, few literatures were seen to take the nonlinear section and digitalization processing as a whole to analyze the spectrum transform of the input signal. Especially, in the
* Correspondence:[email protected]
College of Electronic Engineering, Chengdu University of Information Technology, Chengdu, Sichuan 610225, China
existing work, the effect of sampling and the selection of sampling frequency were seldom investigated intensively. Because the nonlinearity section has a suppression ef-fect upon the strong signal, some people have the idea of trying to take advantage of the nonlinearity to realize automatic gain control function. It is considered that the signal frequency bands are duplicated and shifted to the position of each harmonic frequency of the carrier be-cause of the nonlinearity, forming several harmonic fre-quency bands. So by choosing the sampling frefre-quency carefully, it is expected that the fidelity of signal can be ensured and the effect of AGC can be achieved at the same time through digital filtering. In this paper, how-ever, the research shows that the situation is not good as seems to be.
In fact, the duplication and shifting property of the signal frequency band mentioned above is based on the assump-tion of “light” modulation. Assume that the relationship between input and output of inertialess and nonlinear sec-tion can be expressed as the following equasec-tion
y tð Þ ¼f x tð ð ÞÞ: ð1Þ
Under the assumption of“light”modulation, the mag-nitude of the carrier wave of input signal is much greater than that of its modulation signals(t), that is
x tð Þ ¼Vmcos2πf0tþs tð Þ; ð2Þ
where Vm> > max[|s(t)|]. If the dynamic range of s(t) is
small enough, the output signal can be expressed as first-order Taylor expansion near the carrier signal:
y tð Þ ¼f Vð mcos2πf0tÞ þf0ðVmcos2πf0tÞs tð Þ: ð3Þ
Becausef and f' are both periodic functions oft, they can be expanded into Fourier series [13]:
f Vð mcos2πf0tÞ ¼
Substituting Eqs. (6) and (7) into Eq. (3), and carrying out Fourier transform, we obtain
Y fð Þ ¼ X
The first summation item on the right-hand side of the expression above represents the spectrum line of each harmonic wave caused by carrier. While the second summation item represents the duplication and shifting near each harmonic frequency of the modulated signal spectrum. In the above equation,
B0ðVmÞ ¼21π Zπ
−π
f0ðVmcosφÞdφ is the gain of the signal.
If the gain decreases with the increase of carrier amp-litude, it can realize the function of automatic gain control.
This is the theoretical basis of the idea of duplication and shifting. However, for the “deep” modulated signal, especially for the pulse-modulated signal, such assump-tions will not hold.
Now we try to discuss the problem in another way. Firstly, the nonlinear function y=f(x) can be expressed as the power series
y tð Þ ¼a1x tð Þ þa2x2ð Þ þt a3x3ð Þ þt ⋯⋯þanxnð Þt : ð9Þ
We will discuss the property of the output signal’s spectrum Y(f) transformed from the output signal y(t) under the condition of knowing the spectrumX(f) trans-formed from the input signalx(t).
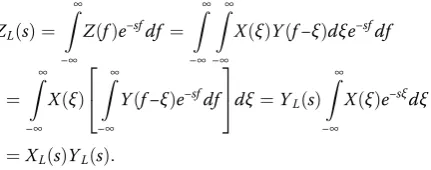
ZLð Þ ¼s
That is to say, the Laplace transform of the spectrum of the product of two signals is the product of the Laplace transform of spectrum of these two signals. If we use the symbol X⊗n(f) to denote the spectrum with
nth power of a signal, then the Laplace transform of
X⊗n(f) is exactly the nth power XnLð Þs of the Laplace transform of the signal’s spectrum. The following equa-tions show the relaequa-tionship between the symbols above clearly and intensively. That is to say, if
x tð ÞFourier Transform↔ X fð ÞLaplace Transform↔ XLð Þs; ð14Þ
then
xnð Þt Fourier Transform↔ X⊗nð Þf Laplace Transform↔ XnLð Þs :
ð15Þ
This result is greatly helpful for us to analyze the spectrum transform of a signal passing through the non-linear section.
2 The spectrum transform of baseband signal passing through nonlinear section
If we only focus on the problems about frequency band oc-cupation caused by nonlinearity and do not care about the details of the spectrum shape, it might as well assume that signalxb(t) has uniform spectrum within a frequency band
Xbð Þ ¼f 10 j jelsewheref ≤b
¼u fð þbÞ−u fð −bÞ; ð16Þ
whereu(f) is the unit step function, andbrepresents the single-side bandwidth. Its Laplace transform is easy to draw:
XbLð Þ ¼s e sb−e−sb
s : ð17Þ
The region of convergence is at the right half ofs-plane: Re(s) > 0. Itsnth power is the inverse transform of the above equation is a linear
combination of the several delay items from the inverse transform ofs−n. The inverse transform ofs−nis
Substituting Eq. (16) into Eq. (22) leads to
Ybð Þ ¼f
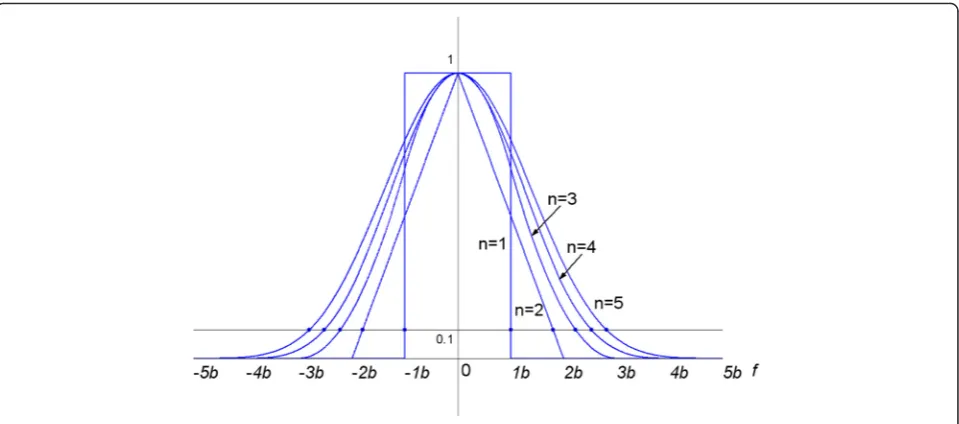
Figure 1 shows the normalized spectrum of the items from the first to fifth power of the baseband signal. It can be seen from the figure that the bandwidth of the signal increases by times of corresponding power order. This is because combinatorial frequency items are pro-duced by the multiplication of different frequency compo-nents within the signal frequency band. The frequency bands which is produced by two and larger power of the signal includes signal distortion. The spectrum attenuated at the band edge, so magnitude 0.1 is taken to calculate the bandwidth ratio of the first 10 power items to the baseband signal, the result is indicated in Table 1.
Plot the data of Table 1 in Fig. 2, by observation we can find out that bandwidth ratio k is approximately proportional to the square root of the harmonic order, that is
k nð Þ ¼apffiffiffin: ð24Þ
3 The spectrum transform of modulated signal passing through nonlinear section
Assume that a modulated signal has the following spectrum
X fð Þ ¼ 01 jf þFj≤elsewhereb or jf−Fj≤b
¼Xbðf þFÞ þXbðf−FÞ; ð25Þ
then its Laplace transform can be figured out as
XLð Þ ¼s esFþe−sF
Xbð Þs: ð26Þ
The Laplace transform of the nth power item’s spectrum is
XnLð Þ ¼s esFþe−sF
n
XnbLð Þ ¼s XnbLð Þs
Xn
m¼0
Cmnes nð −2mÞF: ð27Þ
From this, the spectrum of thenth power item can be deduced:
X⊗nð Þ ¼f X n
m¼0C m
nX⊗bn½f þðn−2mÞF: ð28Þ
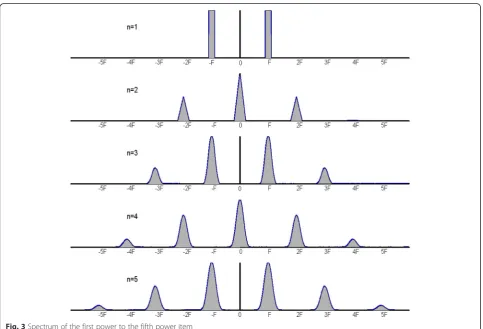
Spectrum of the first power to the fifth power item is shown in Fig. 3.
From Eq. (28) and Fig. 3, it is not difficult to find out that even power items produce even order harmonic fre-quency band up to the specific even order, and odd power items produce odd order harmonic frequency band up to the specific odd order. So the fundamental frequency band is contaminated by odd power items, and thereamong the frequency component produced around the fundamental frequency F by the 2k−1 -th power item is
Xckð Þ ¼f Ck2k−1Xb⊗2k−1ðf−FÞ: ð29Þ
So the spectrum of y(t) around the fundamental fre-quencyFis obtained:
Y1ð Þ ¼f X
k≥1
a2k−1Ck2k−1X⊗b2k−1ðf−FÞ ¼a1X⊗b1ðf−FÞþ
3a3X⊗b3ðf−FÞ þ10a5X⊗b5ðf−FÞ þ⋯:
ð30Þ
Thus, it can be seen that the modulated signal has been contaminated around the carrier frequency by the third and larger odd power items.
Fig. 1Normalized spectrum of the power items of the baseband signal
Table 1Bandwidth ratio of the first 10 power items
Powern Bandwidth ratiok
1 1.
2 1.8
3 2.2254
4 2.5264
5 2.8099
6 3.0716
7 3.3118
8 3.5357
9 3.7464
Fig. 2The relationship curve betweenkand the powern
4 Filtering of the harmonic aliases after nonlinear transform
From the discussion in Section 3, it can be seen that the contamination put on the signal frequency band by the combinatorial frequency items is inevitable. In fact, the signal has experienced this kind of contamin-ation before sampling. If the degree of contamincontamin-ation is mild, the signal is still usable and can be put into digital processing after sampling. However, the sam-pling will produce aliasing problem of the harmonic frequency band, and this will bring new challenges to filtering processing.
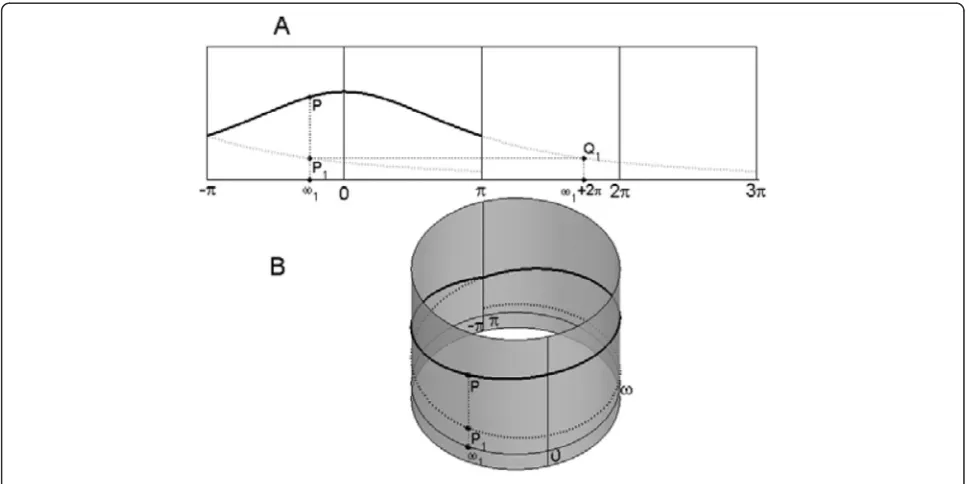
To show the aliasing effect more intuitively, the spectrum of the signal after digitization can be plotted onto a cylindrical surface which can indicate the periodic property of the digital spectrum and we call it “ cylin-drical spectrum”.
Suppose that the digital spectrum of the signal after sampling is:
Xð Þ ¼ω ⋯þVðωþ2πÞ þVð Þ þω Vðω−2πÞ þ⋯ ¼ X∞
k¼−∞
Vðωþ2kπÞ
ð31Þ
whereV(ω) is the scaled analog spectrum. Firstly, let us
only consider the first two terms V(ω) andV(ω+ 2π) in
Eq. (30). A length of magnitude spectrum |V(ω)| within
the interval (−π, π] is drawn in solid line in Fig. 4a, meanwhile, the magnitude spectrum |V(ω+ 2π)| within
the interval (−π, π] is drawn in dotted line. Suppose that
we cut down this strip of paper on which the scaled ana-log spectrum in the interval (−π, π] is drawn and stick it on a cylinder whose cross section is a unit circle, then a cylindrical spectrum is obtained, which is shown as Fig. 4b.
Figure 5 shows a signal with a center frequency of 60 MHZ and a bandwidth of 8 MHZ which has passed through a nonlinear section with the first to the fifth power items. The sampling frequency is 48 MHZ, the signal spectrum before sampling is shown in Fig. 5a, and the spectrum after digitization is plotted onto a cylindrical surface which can indicate the periodic property of the digital spectrum, as shown in Fig. 5b. From the figure, it can be found that not only are there frequency components generated by the third and the fifth power in the signal band but also there are fre-quency components that are originally far from the sig-nal band in the asig-nalog spectrum. Among them, the most significant aliases are brought by the nonlinearity components at 5f0 and −3f0, whose harmonic band completely covers the signal band. This is because ac-cording the equation below, the two digital frequencies corresponding to these two analog frequencies are both equal to 0.5π, which is the digital frequency of the carrier:
ω¼π mod 2f fsþ1; 2
−1
: ð32Þ
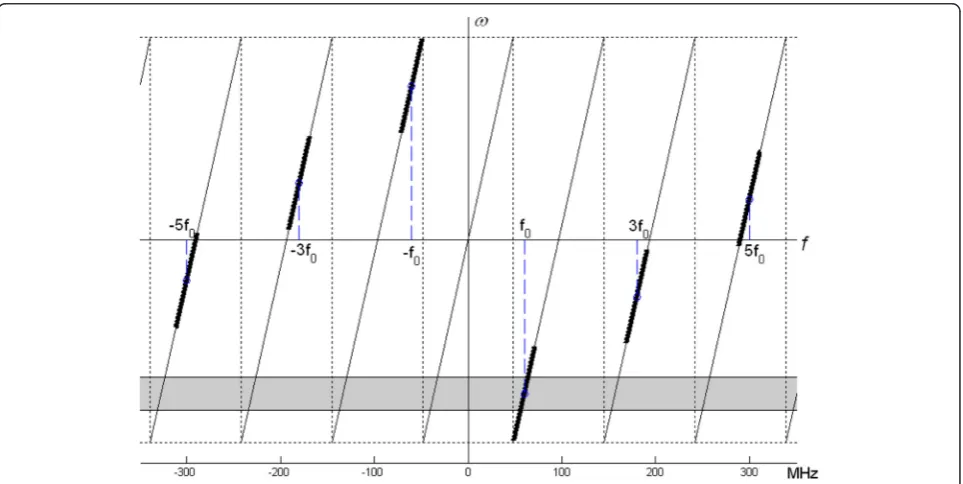
The relationship between f and ω in Eq. (32) is drawn as Fig. 6. The bold lines denote the signal
frequency range and the harmonic frequency ranges. The shaded areas denote the signal frequency band after sampling. Obviously, the contamination is very serious under this situation, because the signal fre-quency band is seriously overlapped by the other ones.
In order to eliminate the harmonic aliasing, the sampling frequency must be chosen carefully. For
this, we define a parameter at first: the ratio of the carrier frequency to the sampling frequency, that is
x¼f0 fs
¼f0Ts: ð33Þ
Consider the minimum value of the arc distances be-tween the signal frequency band (the center frequency is Fig. 5a. the spectrum of a modulated signal after passing through the nonlinear section;b. the cylindrical spectrum after digitalization
f0 and the bandwidth is B) and all the harmonic fre-quency bands generated by the nonlinear items whose center frequencies are notf0:
Dcminð Þ ¼x min fk≠f0
DcB fk;Bk;f0;B;x=f0
; ð34Þ
whereDcB is the arc distance and is defined as
DcB¼max 0; mod 2x fk−f0
=f0þ1; 2
−1
−x Bð þBkÞ=f0
: ð35Þ
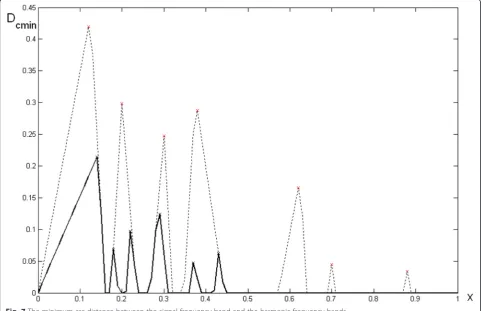
A curve of the minimum arc distance Dcmin(x) can be
drawn by changing the value of x gradually, which is shown in Fig. 7. The solid line represents the minimum arc distance between the signal frequency band and the harmonic frequency bands with center frequencies not equal to the carrier frequency, which are generated by nonlinearity when the first to fifth power are all exist.
It can be noticed that there are several peaks on the curve ofDcmin(x). The coordinate position of the peak
cor-responding to the largestxisx= 0.43, Dcmin(x) = 0.0619,
and the corresponding sample frequency is fs=
139.5349MHz. The f↔ω graph in this case is shown as Fig. 8, and the cylindrical spectrum diagram is shown as Fig. 10b. Indeed, with the minimum arc distance method, by choosing the sampling frequency carefully, the
harmonic frequency band caused by nonlinearity has been separated from the signal frequency band, so the contam-ination to the signal frequency band is greatly eliminated.
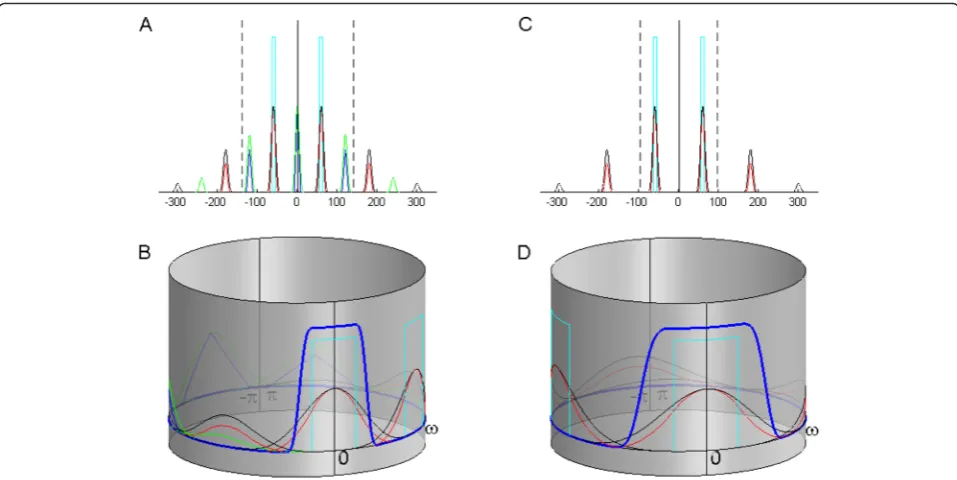
If a nonlinear section has the odd symmetry property, namely f(−x) =−f(x), then all the even power items at the right side of equation (9) will disappear. In this case, the curve of Dcmin(x) is shown as the dotted line in
Fig. 7. On this line, the abscissas of the peaks increase greatly compared to the ones on the solid line. The sam-pling frequency corresponding to the peak with the maximum abscissa isfs= 68.1818MHz, while the
corre-sponding minimum arc distance is only 0.0336, making the filter design and implementation after sampling and digital demodulation very difficult. In order to get an enough large minimum arc distance, we can choose
x= 0.62; Dcmin(x) = 0.1655, and the corresponding
sampling frequency is fs= 96.7742 MHz. In this
situ-ation, the f↔ω relation is shown as Fig. 9, and its cylindrical spectrum diagram is shown as Fig. 10d.
5 Conclusion
Compared to the bandwidth of the baseband, the band-width of frequency band generated by the high power items of the baseband signal that has passed through nonlinear section of a digital radar receiver is wider. In theory, the bandwidth generated by nth power item isn
times of the width for the baseband. Although due to the attenuation on band edge, the bandwidth calculated at a certain level increases slow along with n (approxi-mately proportional to pffiffiffin), but it is still much wider than that of the baseband. The signal of modulated nar-row band will generate a series of harmonic frequency band after passing through the nonlinear section of a
digital radar receiver. The harmonic frequency bands are shifted copy of the spectrum from respective power item of baseband signal according to the integer multiple of the carrier frequency, rather than the simple duplicated and shifted copy of the signal spectrum of the baseband signal. Each item of odd order power generates fre-quency component near the fundamental frefre-quency, Fig. 8Thef↔ωrelation of the signal and the harmonic components at a carefully selected sampling frequency
causing the unnecessary contaminant to the fundamen-tal frequency. So, it is impossible to eliminate the con-taminant by using the filtering method.
If the contaminant discussed above is minor, it is still acceptable to sample the signal and make the digital pro-cessing. However, the sampling frequency is suggested to be selected prudently. In this paper, a maxmin arc-distance strategy that is dependent on the frequency range of the signal is proposed. The arc-distance method is designed for optimizing the sampling frequency. Fur-thermore, with this method, the minimum arc distances between the frequency bands of the signal and the inter-ferences can be calculated. The inter-band arc distances are important references for optimizing the transition bandwidth of the filter after the sampling and demodula-tion process.
Competing interests
The authors declare that they have no competing interests.
Received: 30 September 2015 Accepted: 15 December 2015
References
1. Z Yao, F Zhang,FPGA design on saturation correction in radar digital if receiver, 6th International Conference on ASIC, vol. 2, 2005, pp. 741–745 2. WS Song,A new 3-GSPS 65-GOPS UHF digital radar receiver and its
performance characteristics, the 31th Asilomar Conference on Signals, Systems & Computers, vol. 2, 1997, pp. 1542–1546
3. L Lagerkvist,Modernizing a radar with a digital receiver, 2011 IEEE CIE International Conference on Radar, vol. 1, 2011, pp. 250–253
4. M Yeary, R Kelley et al.,Compact digital receiver development for radar based remote sensing on Instrumentation and Measurement Technology Conference Proceedings, 2008, pp. 1761–1765
5. RPS Rathore,Reconfigurable digital radar receiver implemented in FPGA using under-sampling, direct IQ generation, multi-rate filter and pulse compression, IEEE International Microwave and RF Conference, 2014, pp. 174–177 6. M Lin, Y Shi et al.,Fifth-order nonlinear distortion analysis of forward-link
CDMA signals, IEEE Region 10 Conference, 2007, pp. 1–4
7. Y Shi, M Lin et al.,Analysis of spectral regrowth on forward-link CDMA signals based on fifth-order nonlinear distortion, 8th International Conference on Electronic Measurement and Instruments, 2007, pp. 2-200–2–203 8. H Wang, X-G Li, G-F Zhang,FMCW V-band radar nonlinear analysis and
solutions, 8th International Symposium on Antennas, Propagation and EM Theory, 2008, pp. 682–685
9. KM Harrington,Active array radar nonlinearity requirements—spectral analysis of third order intermodulation clutter, IEEE International Symposium on Phased Array Systems and Technology, 1996, pp. 313–317
10. MB Yeary, An efficient intermodulation product computing technique for broadband active transmit systems. IEEE Transactions on Instrumentation and Measurement57(2), 438–443 (2008)
11. AW Doerry, DF Dubbert, BL Tise,Spurious effects of analog-to-digital conversion nonlinearities on radar range-doppler maps, Conference on Radar Sensor Technology XIX; and Active and Passive Signatures VI, Baltimore, MD, 2015 12. M Grimm, Joint mitigation of nonlinear RF and baseband distortions in
wideband direct-conversion receivers. IEEE Transactions on Microwave Theory and Techniques62(1), 166–182 (2014)
13. SK Mitra,Digital signal processing—a computer-based approach, 4th Edition, McGraw Hill Education, 2011
Fig. 10a. the spectrum of a modulated signal after passing through the nonlinear section in general case;b. the cylindrical spectrum of a modulated signal after digitalization in general case;c. the spectrum of a modulated signal after passing through the nonlinear section with odd symmetry property;d. the cylindrical spectrum of a modulated signal after digitalization when the nonlinear section has the odd