Western University Western University
Scholarship@Western
Scholarship@Western
Electronic Thesis and Dissertation Repository
12-9-2013 12:00 AM
Web 2.0-based Collaborative Multicriteria Spatial Decision
Web 2.0-based Collaborative Multicriteria Spatial Decision
Support System: A Case Study of Human-Computer Interaction
Support System: A Case Study of Human-Computer Interaction
Patterns
Patterns
Mohammadreza Jelokhani-Niaraki
The University of Western Ontario
Supervisor
Jacek Malczewski
The University of Western Ontario Graduate Program in Geography
A thesis submitted in partial fulfillment of the requirements for the degree in Doctor of Philosophy
© Mohammadreza Jelokhani-Niaraki 2013
Follow this and additional works at: https://ir.lib.uwo.ca/etd
Part of the Geographic Information Sciences Commons
Recommended Citation Recommended Citation
Jelokhani-Niaraki, Mohammadreza, "Web 2.0-based Collaborative Multicriteria Spatial Decision Support System: A Case Study of Human-Computer Interaction Patterns" (2013). Electronic Thesis and
Dissertation Repository. 1753.
https://ir.lib.uwo.ca/etd/1753
This Dissertation/Thesis is brought to you for free and open access by Scholarship@Western. It has been accepted for inclusion in Electronic Thesis and Dissertation Repository by an authorized administrator of
Web 2.0-based Collaborative Multicriteria Spatial Decision Support System: A Case Study of Human-Computer Interaction Patterns
(Thesis format: Monograph)
by
Mohammadreza Jelokhani-Niaraki
Graduate Program in Geography
A thesis submitted in partial fulfillment of the requirements for the degree of
Doctor of Philosophy
The School of Graduate and Postdoctoral Studies The University of Western Ontario
London, Ontario, Canada
ii
Abstract
The integration of GIS and Multicriteria Decision Analysis (MCDA) capabilities into the Web 2.0 platform offers an effective Multicriteria Spatial Decision Support System (MC-SDSS) with which to involve the public, or a particular group of individuals, in
collaborative spatial decision making. Understanding how decision makers acquire and integrate decision-related information within the Web 2.0-based collaborative MC-SDSS
has been one of the major concerns of MC-SDSS designers. This study examines human-computer interaction patterns (information acquisition behavior of decision makers) within the Web 2.0-based MC-SDSS environment. It reports the results of an experimental study that investigated the effects of task complexity, information aids, and decision modes on information acquisition metrics and their relations. The research involved three major steps: (1) developing a Web 2.0-based MC-SDSS for parking site selection in Tehran, Iran to analyze human-computer interaction patterns, (2) conducting experiments using this system and collecting the human-computer interaction data, and (3) analyzing the log data to detect information acquisition metrics.
Using task complexity, decision aid, and decision mode as the independent factors, and the information acquisition metrics as the dependent variables, the study adopted a repeated-measures experimental design (or within-subjects design) to test a number of hypotheses. Task complexity was manipulated in terms of the number of alternatives and attributes at four levels. At each level of task complexity, the participants carried out the decision making process in two different GIS-MCDA modes: individual and group modes. The decision information was conveyed to participants through common map and decision table information structures. The map and table were used, respectively, for the exploration of geographic (or decision) and criterion outcome spaces.
The study employed a process-tracing method to directly monitor and record the decision makers’ activities during the experiments. The data on the decision makers’ activities were recorded as Web-based event logs using a database logging technique. Concerning
iii
complexity results in a decrease in the proportion of information searched and proportion of attribute ranges searched, as well as an increase in the variability of information searched per attribute. This finding implies that as task complexity increases decision makers use a more non-compensatory strategy. Regarding the decision mode effects, it was found that the two decision modes are significantly different in terms of: (1) the proportion of information search, (2) the proportion of attribute ranges examined, (3) the variability of information search per attribute, (4) the total time spent acquiring the information in the decision table, and (5) the average time spent acquiring each piece of information. Regarding the effect of the information/decision aids (map and decision table) on the information acquisition behavior, the findings suggest that, in both of the decision modes, there is a significant difference between information acquisition using the map and decision table. The results show that decision participants have a higher number of moves and spend more time on the decision table than map.
The study presented in this dissertation has implications for formulating behavioral theories in the spatial decision making context and practical implications for the development of MC-SDSS. Specifically, the findings provide a new perspective on the
use of decision support aids, and important clues for designers to develop an appropriate user-centered Web-based collaborative MC-SDSS. The study’s implications can advance public participatory planning and allow for more informed and democratic land-use allocation decisions.
Key Words: Web 2.0-based MC-SDSS, GIS-MCDA, human computer interaction,
iv
Acknowledgments
My first and most sincere appreciation goes to my supervisor, Dr. Jacek Malczewski, for all I have learned from him and for his continuous help and support in all stages of this thesis. I have been amazingly fortunate to have an advisor who gave me the freedom to
explore on my own, and at the same time the guidance to recover when my steps faltered. I am extremely grateful to him for being open to ideas, and for encouraging and helping
me to shape my interest and ideas. His motivation, valuable suggestions, and scholarly advice added considerably to my Ph.D. experience.
I would like to express my gratitude to my supervisory committee members, Dr. Micha Pazner, Dr. Claus Rinner and Dr. Milford Green, who gave me valuable suggestions during my study. A special thanks goes to the second reader of my thesis, Dr. Marco Van de Wiel, for his time spent reading through my thesis. I’m thankful to Dr.Soheil Boroushaki for his great support through my Ph.D. program. I extend thanks to my thesis examiners for their time spent reading through my thesis. I wish to thank the staff in the Department of Geography at Western University; special thanks to Lori Johnson and Caroline Majeau for all their assistance over the duration of my study. I would like to thank all my fellow graduate students in the department: Francisco Flores de Santiago, Johnathan Osborne,Yannick Rousseau, Chris Hewitt, Hossein Hosseini, and others.
v
Table of Contents
Abstract ... ii
Acknowledgments ... iv
Table of Contents ... v
List of Tables ... x
List of Figures ... xiii
List of Appendices ... xvii
List of Abbreviations ... xviii
Chapter 1 ... 1
1 Introduction ... 1
1.1 Background ... 1
1.2 Research problem ... 5
1.3 Research questions and hypotheses ... 8
1.4 Methodology ... 16
1.5 Structure of thesis ... 19
Chapter 2 ... 21
2 Literature review ... 21
2.1 Participatory spatial planning ... 21
2.2 Participation ... 24
2.3 Participatory GIS-based planning ... 26
vi
2.3.2 Collaborative multicriteria spatial decision support systems ... 27
2.3.3 GIS-based MCDA ... 29
2.4 Web 2.0, Web 2.0-based GIS, and Web 2.0-based collaborative GIS-MCDA . 40 2.4.1 Web 2.0 ... 40
2.4.2 Geospatial Web 2.0 (GeoWeb) ... 41
2.4.3 Web 2.0 and collaborative GIS-MCDA ... 44
2.5 Information acquisition in collaborative GIS-MCDA ... 45
2.5.1 Decision strategies and information acquisition metrics ... 47
2.5.2 Task complexity and its effect on the information acquisition metrics ... 49
2.5.3 The effect of task complexity, information aids and decision modes in spatial decision making ... 51
Chapter 3 ... 53
3 OWA-based approach for collaborative GIS-MCDA ... 53
3.1 The OWA-based GIS-MCDA decision rule ... 53
3.1.1 The OWA operator ... 53
3.1.2 Attribute value standardization ... 54
3.1.3 Deriving the order weights ... 55
3.2 OWA-based collaborative GIS-MCDA ... 59
3.2.1 Information acquisition ... 61
vii
3.2.3 Deriving individual orderings using the OWA-based MCDA decision rule 64
3.2.4 Deriving group orderings using the group decision rule... 66
Chapter 4 ... 69
4 The metrics of information acquisition ... 69
4.1 Information acquisition in the decision table ... 72
4.1.1 The proportion of information search ... 72
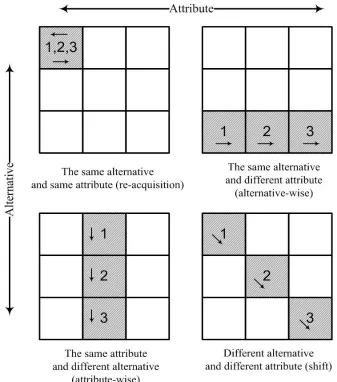
4.1.2 The direction of search ... 73
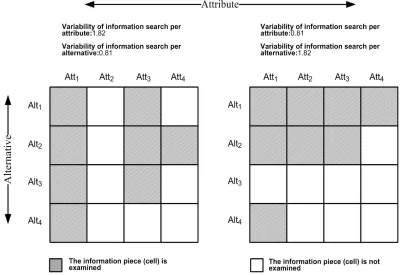
4.1.3 The variability of information search... 76
4.1.4 The time spent acquiring information ... 78
4.1.5 Proportion of attribute ranges ... 79
4.2 Information acquisition on the map ... 79
4.3 Information acquisition on the group decision map ... 80
Chapter 5 ... 81
5 Data, system implementation, and experimental procedure ... 81
5.1 Study area: District # 22 of Tehran ... 81
5.2 Alternative sites and evaluation criteria ... 84
5.3 Experimental design ... 87
5.4 The Web 2.0-based collaborative MC-SDSS ... 89
5.4.1 System development ... 89
viii
5.5 Web implementation and participants ... 102
5.6 Collecting the human-computer interaction event log data: input data for the experiments ... 103
Chapter 6 ... 106
6 Results and analysis ... 106
6.1 The effect of task complexity on the information acquisition metrics ... 107
6.2 The effect of decision mode on the information acquisition metrics ... 124
6.3 The effect of aid on the information acquisition metrics ... 134
6.4 The relationship between time spent examining the decision table/map and the time spent viewing the group decision ... 139
6.5 The relationship between information acquisition metrics ... 141
6.6 The effect of task complexity on the relationship between the information acquisition in the decision table and map ... 144
6.7 The effect of task complexity on the relationship between the time spent on the decision table/map and the group decision ... 146
6.8 The effect of decision mode on the relationship between decision table and map 147 Chapter 7 ... 148
7 Conclusions ... 148
7.1 Research contributions ... 148
7.1.1 Theoretical contribution ... 148
7.1.2 Technical contribution ... 150
7.1.3 Empirical contribution ... 151
ix
7.3 Limitations ... 158
7.4 Recommendations for future Work... 161
References ... 164
Appendices ... 184
x
List of Tables
Table 1. Methods and tools for collaborative decision making derived from macro-micro decision strategy (Source:Jankowski & Nyerges, 2001a). ... 36
Table 2. The order weights and the corresponding decision/combination strategies for
specific ORness values (or α parameter). ... 58
Table 3. The order weights (vj) of the six attributes for particular ORness values. ... 59
Table 4. The decision table: matrix of alternatives and the associated attribute values. ... 63
Table 5. The Borda score and group ordering of the five alternatives. ... 68
Table 6. The population and urban growth in Tehran from 1921 to 2006 (Source: Roshan, Zanganeh, Sauri, & Borna, 2010). ... 83
Table 7. Evaluation criteria for parking site location... 85
Table 8. The decision situations (or experimental treatments) according to the task
complexity and the decision mode. ... 88
Table 9. The number of participants according to their levels of experience with GIS, Internet and urban planning. ... 102
Table 10. Descriptive statistics for the proportion of information search in the
GIS-MCDA individual mode. ... 108
Table 11. Descriptive statistics for the proportion of information search in the
GIS-MCDA group mode. ... 109
xi
Table 13. Descriptive statistics for the proportion of attribute ranges searched in the GIS-MCDA group mode. ... 111
Table 14. Descriptive statistics for the average time spent acquiring per item of
information in the GIS-MCDA individual mode. ... 113
Table 15. Descriptive statistics for the average time spent acquring per item of
information in the GIS-MCDA group mode. ... 113
Table 16. Descriptive statistics for the variability of information search per attribute in the GIS-MCDA individual mode. ... 114
Table 17. Descriptive statistics for the variability of information search per attribute in the GIS-MCDA group mode. ... 115
Table 18. Descriptive statistics for the variability of information search per alternative in the GIS-MCDA individual mode. ... 116
Table 19. Descriptive statistics for the variability of information search per alternative in the GIS-MCDA group mode. ... 116
Table 20. Descriptive statistics for the SI index in the GIS-MCDA individual mode. .... 117
Table 21. Descriptive statistics for the SM index in the GIS-MCDA individual mode. .. 117
Table 22. Descriptive statistics for the SI in the GIS-MCDA group mode. ... 119
Table 23. Descriptive statistics for the SM in the GIS-MCDA group mode. ... 119
Table 24. Descriptive statistics for the total time spent on the table under the use of the GIS-MCDA individual mode. ... 120
xii
Table 26. Descriptive statistics for the total time spent on the map in the GIS-MCDA individual mode. ... 122
Table 27. Descriptive statistics for the total time spent on the map in the GIS-MCDA group mode. ... 122
Table 28. Descriptive statistics for the number of map moves in the GIS-MCDA
individual mode. ... 123
Table 29. Descriptive statistics for the number of map moves in the GIS-MCDA group mode. ... 123
Table 30. Descriptive statistics for the time spent viewing the group decision. ... 124
Table 31. The correlation between the time spent on the table and map, as well as the table and map moves. ... 139
Table 32. The correlation coefficients between the time spent on the decision table/ map and time spent viewing the group decision. ... 140
Table 33. The correlation coefficients among the information acquisition metrics in the decision table. ... 141
Table 34. The effect of task complexity and decision mode on the information acquisition
metrics. ... 154
Table 35. The effect of information aid on the information acquisition metrics. ... 155
Table 36. The significance of correlation among the information acquisition metrics in the decision table ... 155
xiii
List of Figures
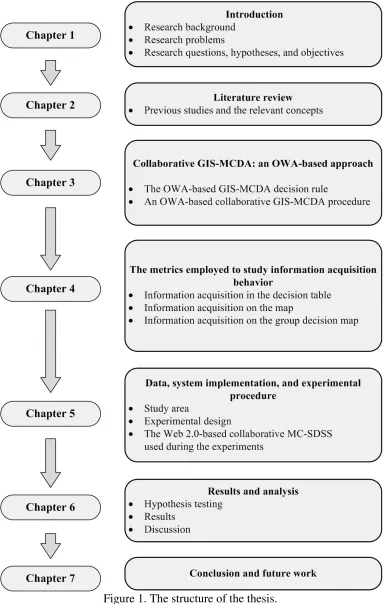
Figure 1. The structure of the thesis. ... 20
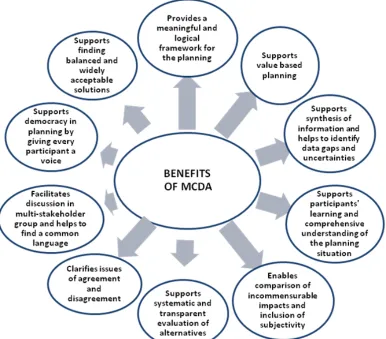
Figure 2. Benefits of MCDA in planning (Source:Marttunen, 2011). ... 28
Figure 3. A hierarchical structure for the MCDA (Source:Malczewski, 1999a). ... 31
Figure 4. Framework for multicriteria analysis (Source:Malczewski, 1999a). ... 32
Figure 5. Structure of a collaborative GIS-MCDA process (Source:Boroushaki & Malczewski, 2010a). ... 38
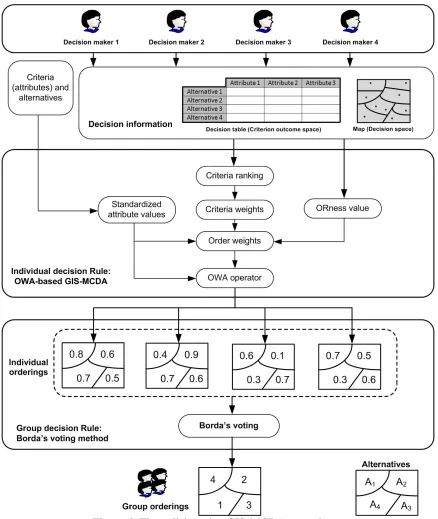
Figure 6. The collaborative GIS-MCDA procedure. ... 60
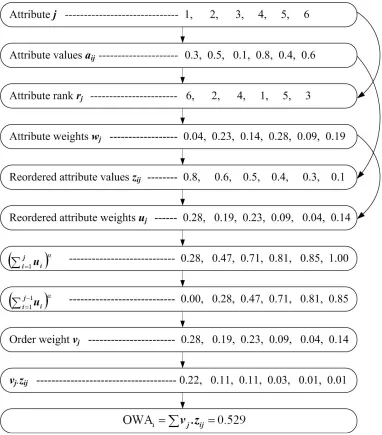
Figure 7. Example computation of the OWA for the i-th location and ORness = 0.5. ... 65
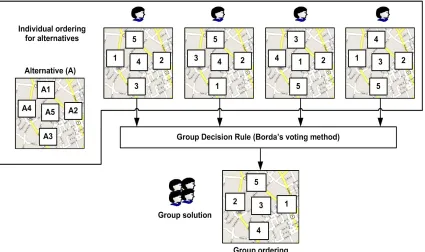
Figure 8. Deriving the group alternative orderings from the individual orderings. ... 67
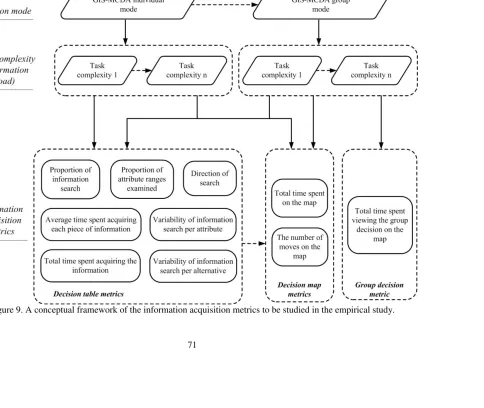
Figure 9. A conceptual framework of the information acquisition metrics to be studied in the empirical study. ... 71
Figure 10. Examples of the transitions for the four search patterns. ... 74
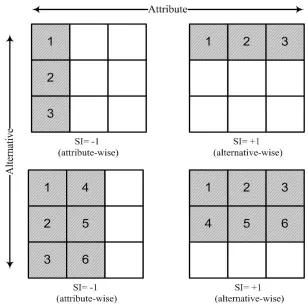
Figure 11. Examples of the information search for the attribute- and alternative-wise patterns. ... 75
Figure 12. Illustration of the distinction between variability of search per attribute and variability of search per alternative (modified from Klayman, 1983). ... 78
Figure 13. District # 22 of Tehran, Iran. ... 83
Figure 14. The candidate sites for new parking in District # 22. ... 85
Figure 15. An example of counterbalanced decision situations for four participants... 88
xiv
Figure 17. The user registration form. ... 94
Figure 18. The GUI for the GIS-MCDA individual mode in decision situation “5×2”. ... 96
Figure 19. The GUI for the GIS-MCDA individual mode in decision situation “15×6”. . 96
Figure 20. The windows for specifying the criteria priorities and ORness value in decision situations “5×2” and “15×6”, respectively. ... 98
Figure 21. The GUI for the GIS-MCDA group mode in decision situation “5×2”. ... 100
Figure 22. The GUI for the GIS-MCDA group mode in decision situation “15×6”. ... 100
Figure 23. The group decision window for decision situation “5×2”. ... 101
Figure 24. The group decision window for decision situation “15×6”. ... 101
Figure 25. Querying the log data using the Navicat for MySQL. ... 105
Figure 26. Results for the query “what is the number of information cells acquired by each participant in a particular decision situation within a particular decision mode?”. . 105
Figure 27. A comparison between the proportions of information search in the two decisions modes. ... 125
Figure 28. A comparison between the proportions of attribute ranges searched in the two decisions modes. ... 126
Figure 29. A comparison between the average decision times in the two decision modes. ... 127
Figure 30. Comparing the variability of information search per attribute in the two decisions modes. ... 128
xv
Figure 32. A comparison between the directions of information search (SI index) in the two decision modes. ... 130
Figure 33. A comparison between the directions of information search (SM index) in the
two decision modes. ... 130
Figure 34. A comparison between the total times spent acquiring the information in the two decision modes. ... 131
Figure 35. A comparison between the total times spent on the map in the two decision modes. ... 132
Figure 36. A comparison between the number of map moves in the two decision modes. ... 133
Figure 37. A comparison between the number of table and map moves in the individual decision mode. ... 135
Figure 38. A comparison between the number of table and map moves in the GIS-MCDA group mode. ... 136
Figure 39. A comparison between the time spent on the decision table and map in the GIS-MCDA individual mode. ... 137
Figure 40. Comparing the time spent on the decision table and map in the GIS-MCDA group mode. ... 138
Figure A1. A part of source code in the in the Java IDE environment IntelliJ IDEA 10.5. ... 184
Figure C1. The GUI for the GIS-MCDA individual mode in decision situation “5×2”. . 193
Figure C2.The GUI for the GIS-MCDA group mode in decision situation “5×2”. ... 193
xvi
Figure C4. The GUI for the GIS-MCDA group mode in decision situation “10×4”. ... 194
Figure C5. The GUI for the GIS-MCDA individual mode in decision situation “15×6”. ... 195
Figure C6. The GUI for the GIS-MCDA group mode in decision situation “15×6”. ... 195
Figure C7. The GUI for the GIS-MCDA individual mode in decision situation “20×8”. ... 196
Figure C8. The GUI for the GIS-MCDA group mode in decision situation “20×8”. ... 196
Figure C9. The windows for specifying the criteria priorities and ORness value in the four decision situations “5×2”, “10×4”, “15×6”, and “20×8”. ... 197
xvii
List of Appendices
Appendix A
:
Sample source code for developing the Web 2.0-based MC-SDSSAppendix B
:
The tutorial of the Web 2.0-based collaborative MC-SDSS (in Persian)Appendix C
:
The GUIs for the GIS-MCDA individual and group modes in the fourdecision situations (in Persian)
xviii
List of Abbreviations
AHP Analytic Hierarchy Process
AJAX Asynchronous JavaScript and XML ANOVA Analysis of Variance
API Application Programming Interface GIS Geographic Information Systems
GIS-MCDA Geographic Information Systems based-Multicriteria Decision Analysis GUI Graphical User Interface
GWT Google Web Toolkit
HCI Human-computer interaction
LMM Linear Mixed Model
MCDA Multicriteria Decision Analysis
MC-SDSS Multicriteria Spatial Decision Support Systems MySQL My Structured Query Language
OWA Ordered Weighted Averaging PGIS Participatory GIS
SDSS Spatial Decision Support Systems
1
Chapter 1
1
Introduction
1.1 Background
There is some evidence to show that spatial decisions made collectively tend to be more effective than decisions made by an individual decision maker (e.g., Carver, 1999; Dragićević & Balram, 2004; Jankowski, 2009; Joerin, Desthieux, Beuze, & Nembrini, 2009; Simão, Densham, & Haklay, 2009). Thus, it is suggested that spatial planning/decision making should involve the use of a collaborative/participatory
approach, where individuals with different backgrounds can be brought together to solve a decision problem (e.g., Bailey, Goonetilleke, & Campbell, 2003; Kyem, 2004; Bugs, Granell, Fonts, Huerta, & Painho, 2010). Participatory approaches provide an interactive, open, democratic, communicative, collaborative and well informed deliberative process in which both experts and non-experts communicate, negotiate, and develop solutions (Esnard & MacDougall, 1997; Klosterman, 1997). Only through such a process, it is possible to find a solution that reconciles the conflicting objectives that result from different people’s opinions and the final outcome can be accepted by the majority (Sipilä & Tyrväinen, 2005; Simão et al., 2009).
2
The concept of Web-based GIS has been proposed as an effective tool for participatory planning. The Web can be used as an information infrastructure for delivering spatial data and GIS functionalities to the general public. GIS offers a wide spectrum of visual and computational decision support tools that can be used by both planners and lay participants on the Web for selection, prioritization, and integration of decision options (Sadagopan, 2000; Tang & Waters, 2005). Studies on the use of asynchronous GIS-based approaches for participatory planning suggest that the space-time distributed environment of the Web not only provides the flexibility to work in different places and times for the convenience of the participants, but also offers equal participation opportunity (Zhu & Dale, 2001; Sikder & Gangopadhyay, 2002; Malczewski, 2006b). Web 2.0 technologies and concepts have recent been adapted to Participatory GIS (PGIS) projects (Rinner, Keßler, & Andrulis, 2008; Bugs et al., 2010; Sani & Rinner, 2011; Dessì, Garau, & Pes, 2012). The ability of Web 2.0 in advancing participation, interactivity, and collaboration has played a significant role in PGIS in general and collaborative decision making in particular. Web 2.0 technologies shift Web applications from a perceived information display medium that provides the Web content to many people through websites, to a
fully interactive platform that allows collaboration. They allow two-way communication; that is, a read-write web by means of which the users are contributing as well as consuming information.
3
Spatial Decision Support System (MC-SDSS) for public participation, which provides appropriate analytical tools and platforms for direct involvement of the public in the spatial planning process. A MC-SDSS integrates previously separate GIS and MCDA tool sets into a unified whole more valuable than the sum of the parts. At the most basic level, a MC-SDSS can be viewed as a decision support tool that integrates geospatial data and value judgments (the decision maker’s preferences) to produce information for decision making (Laaribi, Chevallier, & Martel, 1996; Malczewski, 1999a; Joerin, Thériault, & Musy, 2001). The underlying idea behind incorporating MCDA techniques into GIS is that the MCDA capabilities can complement GIS tools during the decision making stages. Using GIS to store, manage, produce, analyze, retrieve, organize, and visualize geographically referenced and associated tabular attribute data offers the capability of efficiently developing techniques and methods for modeling spatial decision making problems. Planners can use GIS to reveal hidden information, analyze the data from different perspectives and summarize them into useful information, extract spatial patterns, analyze spatial relationship, identify problematic areas, and recommend possible computational policy solutions. As an analytical system, MCDA can serve spatial
decision making process by providing a wide range of powerful techniques and approaches for structuring decision problems, designing, evaluating, and prioritizing geographic alternatives. It is in the context of the combined capabilities of GIS and MCDA that the significance of advancing theoretical and applied research on MC-SDSS becomes obvious (Malczewski, 2006a).
4
Tucker, Hursthouse, & Fyfe, 2004; Norese & Toso, 2004). The GIS-MCDA approach offers a platform for organizing data relevant to the decision and helps to select the set of criteria for assessing and prioritizing alternative courses of action. The members of the decision making group can examine the spatial characteristics (locations) of alternatives, visualize them, and evaluate them according to their preferences (Voss et al., 2004). Third, an incorporation of MCDA into GIS can assist collaborative work by providing a tool for structuring group decision-making problems and facilitating communication in a group setting (e.g., Zhu & Dale, 2001; Rosmuller & Beroggi, 2004; Mau-Crimmins, de Steiguer, & Dennis, 2005; Boroushaki & Malczewski, 2010a). Fourth, an integration of GIS and MCDA allows for minimizing conflict over the choice of the best alternative course of action by providing mechanisms for revealing participants’ preferences, identifying and discussing various alternatives, and building a consensus among decision makers (Feick & Hall, 1999; Jankowski & Nyerges, 2001a; Kyem, 2001; Sharifi, van den Toorn, Rico, & Emmanuel, 2002; Boroushaki & Malczewski, 2010a). Evidence shows that MCDA for individual decision making combined with proper voting rules offers a valuable tool for group decision making in the GIS environment (Malczewski, 1996;
Jankowski & Nyerges, 2001a; Norese & Toso, 2004). The incorporation of MCDA into Web 2.0-based GIS allows democratization of spatial data and spatial decision-making process by offering open accessibility and wide distribution of geospatial information. Web 2.0-based MC-SDSS tools change multicriteria decision making from a closed, place-based (fixed time and location), synchronous procedure to an open, asynchronous, distributed, and active decision making process. Such tools enable participants to input their preferences regarding the decision problem based on different time/ location of the spatial-temporal dimensionality of collaborative decision-making (Boroushaki & Malczewski, 2010a). These tools offer a broadly-distributed and optimal solution for spatial planning, as well as provide easy access to the general public for active participation in the decision making process.
5
planning process: deliberative and analytic (Rinner, 2006; Boroushaki, 2010). The deliberative area of that process can be improved by consensus among various stakeholders and decision-makers through organizing discussion processes and facilitating negotiation and communication (Rinner, 2006; Rinner et al., 2008). The analytic area of decision-making and spatial planning process can be enhanced by providing a mechanism that enables individual decision-makers to use their value judgments about the decision issue, thereby producing a group solution that represents best the preferences of all participants (Malczewski, 1996; Feick & Hall, 1999; Jankowski & Nyerges, 2001a; Feick & Hall, 2004; Malczewski, 2006b; Simão et al., 2009).
1.2 Research problem
Over the last decade or so, significant research efforts have been made to integrate GIS and MCDA methods into the Web (or Web 2.0) environment (Rinner & Malczewski, 2002; Sikder & Gangopadhyay, 2002; Dragićević & Balram, 2004; Evans, Kingston, & Carver, 2004; Voss et al., 2004; Hall & Leahy, 2006; Chen, Jiang, & Li, 2007; Karnatak, Saran, Bhatia, & Roy, 2007; Rao et al., 2007; Jankowski, Zielinska, & Swobodzinski, 2008; Simão et al., 2009; Taranu, 2009; Boroushaki, 2010). However, the research into Web-based MC-SDSS has so far tended to concentrate on the technical questions of how to integrate GIS and MCDA (Carver, 1999; Sakamoto & Fukui, 2004; Karnatak et al., 2007). In a research agenda about geovisual analytics for decision support analysis, Andrienko et al. (2007) argue that MCDA methods are essential for supporting the involvement of humans in complex spatial problem-solving. However, they also suggest that a simple combination of geovisualization techniques and GIS methods with MCDA modelling is not sufficient for facilitating the mutual reinforcement of the abilities of humans and computers and call for research about human-computer interaction (HCI) (see MacEachren et al., 2004).
Little empirical research has been performed to understand the way decision makers, stakeholders, planners, and citizens acquire and use the relevant decision information
6
Our understandings of the benefits of MC-SDSS applications are currently limited by the scarce empirical studies on the usage patterns of decision support tools. The major reason for the limited empirical critiques is that most research about MC-SDSS has focused on software design and development rather than use. This limited knowledge on how people search through and combine information to make spatial decisions leaves the design and development side without sound scientific bases for advancing the technology. Evidence shows that the effects of advanced information technologies on individuals and groups are less a function of the technologies themselves than how they are used by people (DeSanctis & Poole, 1994; Crossland, Wynne, & Perkins, 1995; Jankowski & Nyerges, 2001a). The motivation for research coming out of this conclusion is that studying the patterns of human-commuter interaction under MC-SDSS conditions is as important as developing the decision support software. Web technology provides a distinctive opportunity for studying the usage patterns of MC-SDSS by means of the online system events log data analysis.
Given the importance of understanding decision makers’ information acquisition behavior, it is equally important to understand this behavior across different types of
7
involve the combination of available information and an evaluation process where high values on some evaluation criteria can compensate for low values on other criteria. Non-compensatory search strategies, on the other hand, involve various simplifying heuristics for evaluating and combining information. With a non-compensatory strategy, comparisons and combinations across evaluation criteria are avoided and evaluation may be qualitative rather than quantitative. Non-compensatory search strategies are less cognitively demanding and may result in different decisions than when compensatory strategies are used. Consequently, the decision maker is faced with a tradeoff between reduced cognitive effort and potentially less than optimal decisions (Bodily, 1985; Malczewski & Rinner, 2005).
Access to different information aids, such as tables, graphs and maps has also been found to influence the decision process and outcomes (Crossland et al., 1995; Smelcer & Carmel, 1997; Dennis & Carte, 1998; Speier, 2006; Andrienko et al., 2007). Therefore, it is reasonable to expect that the type of decision aids offered for use in the GIS-MCDA environment has an influence on the number of times they are used and the way they are brought into use. The human-computer interaction (the pattern of decision aid moves)
will likely be different between maps and decision tables because of the advantages or disadvantages of information associated with each (Contractor & Seibold, 1993). Jankowski and Nyerges (2001b) examined the usage of four different types of geographic information structures including: Map, MCDA (decision table), Consensus (rank map), and Table/Text aids in a collaborative GIS-MCDA environment. In an examination of the use of map and MCDA decision aids, they found that the time that participants spend on these information aids is significantly different.
8
this need by carrying out an experimental study of information acquisition behavior in a collaborative GIS-MCDA process. In addition to task complexity and information aid effects, this study examines the effects of decision mode (individual versus group decision making) on the information acquisition behavior. Several studies suggest that the information acquisition strategies used by decision makers differ between the different modes of decision making process (Abdul-Muhmin, 1994; Schrah, Dalal, & Sniezek, 2006). For example, Schrah et al. (2006) suggested that decision makers employ different information acquisition strategies in the decision modes where they are provided with advice (alternative choice recommendations) and where they are not. There is no empirical study in the literature exploring how decision maker’ information acquisition behavior is affected by the use of different GIS-MCDA modes. Decision makers may exhibit different information search behaviors with or without having an access to the group decision results (group choice recommendations).
Given the study’s focus on describing the process leading to a decision and an interest in dynamics of human-computer-human interaction during collaborative decision making, the study will adopt a process tracing approach to measure the information acquisition
metrics (Ford et al., 1989; Jankowski & Nyerges, 2001a). Process tracing is a data collection technique that allows the researchers to directly monitor and record decision maker’ activities during the decision making process (Takemura & Selart, 2007). It provides a detailed understanding of what information is examined, when, how, and for how long the information is processed by tracking the steps leading to the decision (Pfeiffer, 2012). The use of process tracing technique allows for uncovering the cognitive processes that underlie how task complexity, information aid, and decision mode affect the way people deal with decision problems.
1.3 Research questions and hypotheses
The main objective of this dissertation is to examine the patterns of human-computer interaction (information acquisition behavior) in the use of a Web 2.0-based collaborative
9
achieve this objective, the following set of research questions and corresponding hypotheses have been formulated.
Research question 1
How does the complexity of a decision task affect information acquisition strategies in the collaborative GIS-MCDA procedure? This research question is examined using the following hypotheses:
H1a: There is a significant relationship between task complexity in the individual
decision making (the GIS-MCDA individual mode) and the proportion of information
searched. It is expected that an increased task complexity in the GIS-MCDA individual
mode will result in a decrease in the proportion of information search (Payne, 1976; Ford et al., 1989; Chinburapa, 1991; Roe, Busemeyer, & Townsend, 2001; Katz, Bereby-Meyer, Assor, & Danziger, 2010; Schram & Sonnemans, 2011; Queen et al., 2012). H1b:
There is a significant relationship between task complexity in the group (collaborative)
decision making (the GIS-MCDA group mode) and the proportion of information search.
It is anticipated that the proportion of information search in the GIS-MCDA group mode will decrease along with an increasing task complexity.
H2a: There is a significant relationship between task complexity in the GIS-MCDA
individual mode and the proportion of information searched across the attribute ranges
(the ranges of attribute values). It is expected that an increased task complexity in the
GIS-MCDA individual mode will result in a decrease in the proportion of information searched. H2b: There is a significant relationship between task complexity in the
GIS-MCDA group mode and the proportion of information searched across the attribute
ranges. It is anticipated thatan increased task complexity in the GIS-MCDA group mode
will decrease the proportion of attribute ranges searched.
H3a: There is a significant relationship between task complexity in the individual
decision makingand the average amount of time spent on each piece of information. It is
10
in a decrease in the average amount of time spent on each piece of information (Ford et al., 1989; Klemz & Gruca, 2001). H3b: There is a significant relationship between task
complexity in the GIS-MCDA group mode and the average amount of time spent on each
piece of information. It is anticipated that that an increased task complexity in the
GIS-MCDA group mode will result in a decrease in the average amount of time spent oneach piece of information.
H4a: There is a significant relationship between task complexity in the GIS-MCDA
individual mode and variability in the proportion of information searched per attribute. It
is expected that an increased task complexity in the GIS-MCDA individual mode will result in increased variability in the proportion of information searched per attribute (Chinburapa, 1991; Abdul-Muhmin, 1994; Bröder & Schiffer, 2003; Schmeer, 2003). H4b: There is a significant relationship between task complexity in the GIS-MCDA group
mode and variability in the proportion of information searched per attribute. It is
anticipated that an increased task complexity in the GIS-MCDA group mode will result in increased variability in the proportion of information searched per attribute.
H5a: There is a significant relationship between task complexity in the GIS-MCDA
individual mode and variability in the proportion of information searched per alternative.
The anticipated result is that an increased task complexity in the GIS-MCDA individual mode will result in increased variability in the proportion of information searched per alternative (Payne et al., 1993; Abdul-Muhmin, 1994; Bröder & Schiffer, 2003; Schmeer, 2003; Carrigan, Gardner, Conner, & Maule, 2007; Glaholt, 2010). H5b: There is a
significant relationship between task complexity in the GIS-MCDA group mode and
variability in the proportion of information searched per alternative. It is expected that an
increased task complexity in the GIS-MCDA group mode will result in increased variability in the proportion of information searched per alternative.
H6a: In the GIS-MCDA individual mode, decision makers use a more attribute-wise
strategy (direction of search) than an alternative-wise strategy in the information search
11
organized by attributes rather than by alternatives. H6b: In the GIS-MCDA group mode,
decision makers use a more attribute-wise strategy than an alternative-wise in the
information search process. The anticipated result is that, in the GIS-MCDA group mode,
search will become organized by attributes rather than by alternatives. H6c: There is a
significant relationship between task complexity in the GIS-MCDA individual mode and
direction of search (Payne, 1976; Abdul-Muhmin, 1994; Roe et al., 2001; Katz et al.,
2010). It is expected that increased task complexity in the GIS-MCDA individual mode will result in a direction of search that is more attribute-wise than alternative-wise. H6d:
There is a significant relationship between task complexity in the GIS-MCDA group mode
anddirection of search. It is suggested that increased task complexity in the GIS-MCDA
group mode will result in a direction of search that is more attribute-wise than alternative-wise.
H7a: There is a significant relationship between task complexity in the GIS-MCDA
individual mode and the total time spent acquiring the information in the decision table.
It is expected that an increased task complexity in the GIS-MCDA individual mode will result in increased time spent acquiring the information in the decision table (Chinburapa,
1991; Abdul-Muhmin, 1994). H7b: There is a significant relationship between task
complexity in the GIS-MCDA group mode and total time spent acquiring the information
in the decision table. It is anticipated that an increased task complexity in the GIS-MCDA
group mode will result in increased time spent acquiring the information in the decision table.
H8a: There is a significant relationship between task complexity in the GIS-MCDA
individual mode and time spent acquiring the information on the map. It is expected that
an increased task complexity in the GIS-MCDA individual mode will result in increased time spent acquiring the information on the map. H8b: There is a significant relationship
between task complexity in the GIS-MCDA group mode and time spent acquiring the
information on the map. It is anticipated that an increased task complexity in the
12
individual mode and the number of moves on the map. It is expected that an increased
task complexity in the GIS-MCDA individual mode will result in a higher number of moves on the map. H8d: There is a significant relationship between task complexity in
the GIS-MCDA group mode and the number of moves on the map. It is anticipated that an
increased task complexity in the GIS-MCDA group mode will result in a higher number of moves on the map.
H9: There is a significant relationship between task complexity in the GIS-MCDA group
mode and the time spent viewing the group (collective) decision. It is expected that
increased task complexity in the GIS-MCDA group mode will result in increased time spent viewing the group (collective) decision. As task complexity increases, the participants may find the decision task difficult, and therefore will tend to use the group advice (e.g., group debates and ranking of the alternatives) (Schrah et al., 2006; Gino & Moore, 2007).
Research question 2
How do information acquisition and integration strategies used in the collaborative GIS-MCDA individual mode differ from strategies used in the collaborative GIS-GIS-MCDA
group mode? This question is addressed by the following hypotheses:
H10a: There is a significant difference in the proportions of information searched
between the two decision modes. H10b: There is a significant difference in the proportion
of attribute ranges searchedbetween the two decision modes. H10c: There is a significant
difference in the average amount of time spent on each piece of information between the
two decision modes. H10d: The two decision modes are significantly different in terms of
variability in the proportion of information searched per attribute. H10e: The two
decision modes are significantly different in terms of the variability in the proportion of
information searched per alternative. H10f: There is a significant difference in the
direction of information searched between the two decision modes. H10g: The two
13
information in the decision table. H10h: The two decision modes are significantly
different in terms of the time spent acquiring the information on the map. H10i: The two
decision modes are significantly different in terms of the number of moves on the map. I
expect that the two decision modes would be significantly different in terms of: (i) the proportion of information search, (ii) the variability of information search per attribute, (iii) the variability of information search per alternative, (iv) the direction of search (sequence of information search), (v) the total time spent acquiring the information, (vi) the average time spent acquiring each piece of information, (vii) the total time spent on the map exploration, and (viii) the number of moves on the map.
Research question 3
How do the types of geographic information structures (e.g., maps and tables) affect decision makers’ information acquisition behaviors? To answer this research question, the following set of hypotheses is examined:
H11a: There is a significant relationship between the type of information aid in the
GIS-MCDA individual mode and information search moves. It is suggested that, in the
GIS-MCDA individual mode, the number of moves in the decision table is significantly higher
than that on the map. H11b: There is a significant relationship between the type of
information aid in the GIS-MCDA group mode and the number of moves. It is expected
that, in the GIS-MCDA group mode, the number of moves in the decision table will be significantly higher than that on the map (Jankowski & Nyerges, 2001b). H11c: There is
a significant relationship between the type of information aid in the GIS-MCDA
individual mode and the time spent acquiring the decision information. It is anticipated
that the amount of time spent on the decision table in the GIS-MCDA individual mode will be significantly more than that on the map. H11d: There is a significant relationship
between the type of information aid in the GIS-MCDA group mode and the time spent
acquiring the decision information. The expected result is that the amount of time spent
14
modes, there is a significant relationship between the time spent on the decision table and
the time spent on the map. H11f: In both the GIS-MCDA individual and group modes,
there is a significant relationship between the number of table moves and map moves.
Research question 4
Is there a relationship between the time spent searching for information in the decision table/map and the time spent viewing the group decision? This question can be answered in terms of the following hypotheses:
H12a: There is a significant relationship between the time spent on the map and the time
spent viewing the group decision in the GIS-MCDA group mode. H12b: There is a
significant relationship between the time spent on the decision table and the time spent
viewing the group decision. It is expected that the time spent on the decision table/map
and the time spent viewing the group decision will be significantly correlated.
Research question 5
Is there relationship between the information acquisition metrics used in the decision table? This research question can be addressed using the following hypothesis:
H13: In both of the GIS-MCDA individual and group modes, there is a significant
relationship among the information acquisition metrics. It is anticipated that there will be
15
Research question 6
Does task complexity affect the relationship between the information acquisition in the decision table and the map? The answer to this question can be derived from the following hypotheses:
H14a: Increased task complexity in the GIS-MCDA individual mode has an insignificant
impact on the relationship between the time spent on the decision map and table. H14b:
Increased task complexity in the GIS-MCDA group mode has an insignificant impact on
the relationship between the time spent on the map and table. H14c: Increased task
complexity in the GIS-MCDA individual mode has an insignificant impact on the
relationship between the number of map and table moves. H14d: Increased task
complexity in the GIS-MCDA group mode has an insignificant impact on the relationship
between the number of map and table moves. It is expected that,in both the GIS-MCDA
individual and group modes, an increase in decision task complexity will affect both the relationship between the time spent on the decision map and table and the relationship between the number of moves on the map and in the decision table (Jankowski & Nyerges, 2001b).
Research question 7
Does task complexity affect the relationship between the time spent on the decision table/ map and the time spent viewing the group decision? To examine this question, the following hypotheses have been developed:
H15a: Increased task complexity in the GIS-MCDA group mode has an insignificant
impact on the relationship between the time spent viewing the group decision and the time
spent on the decision table. H15b: Increased task complexity in the GIS-MCDA group
mode has an insignificant impact on the relationship between the time spent viewing the
group decision and the time spent on the map. It is anticipated that increased task
16
Research question 8
Does the decision mode influence the relationship between the information acquisition in the decision table and the map? To answer this question, the following hypotheses have been constructed:
H16a: The decision mode has an insignificant effect on the relationship between the time
spent on the map and table. H16b: The decision mode has an insignificant effect on the
relationship between the number of map and table moves. I expect that the decision mode
will influence both the relationship between the time spent on the map and table and the relationship between the number of map and table moves.
1.4 Methodology
The main focus of this research is on the examination of the set of hypotheses derived from the research questions in the context of a Web 2.0-based MC-SDSS application. To achieve the research objectives, the methodology used in the study involves a three stage procedure:
(1) Developing and implementing a Web 2.0-based collaborative MC-SDSS for
tackling a site selection problem in the City of Tehran, Iran
17
group/compromise rankings of alternatives, which are obtained by aggregating individual rankings using the Borda approach (Jankowski & Nyerges, 2001a; Boroushaki, 2010).
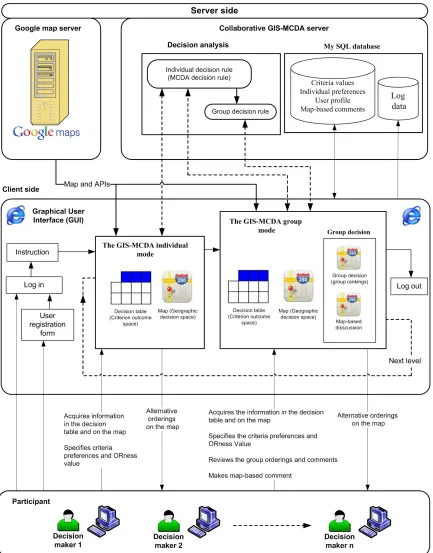
The system can be used in two decision modes: (i) the individual decision making mode (or GIS-MCDA individual mode) and (ii) the group (collaborative) decision making mode (or GIS-MCDA group mode) (Jankowski & Nyerges, 2001a). In the individual mode, the participants have access to the two modules. The individual decision making module (i) provides participants with a decision table and map for exploring the decision information, and allows the participants to determine the criteria preferences, and eventually evaluate the alternatives. The decision table and map have been respectively used for the representation of decision space (alternative location space) and the criterion outcome space (criterion value space) (see Malczewski, 1999b). Locations of feasible decision alternatives along with the underlying spatial relationships constitute the geographic decision space. To each of the alternative locations there is assigned a binary decision variable, which takes 1 if the corresponding location is selected, or otherwise 0. Each location in the decision space (map) has its associated criterion values in the decision outcome space (decision table or criterion outcome table). Jankowski,
Andrienko, and Andrienko (2001) argue that an integrated visualization of the decision space and criterion outcome space can be useful for understanding the structure of a decision problem (see also Rinner, 2007). They suggest that the simultaneous representation of criterion and decision spaces opens a possibility of eliciting a decision maker’s preferences for decision criteria not only on the basis of attribute data but also geography.
18
preferences in an effort to get their decision close to the group decision. Both the decision modes will be used for the case study of parking site selection in district # 22 of Tehran.
(2) Conducting experiments using the system and collecting the human-computer
interaction data
The study makes use of a decision-making experiment involving different decision situations based on the levels of task complexity, the types of information aids and decision modes. The primary field research activities center on using the MC-SDSS by a “virtual” non-mediated group comprised of community members interacting with the MC-SDSS tools accessed via Internet. Each individual in the group is able to participate in the experiments after registering online as a user in order to track the human-computer interaction patterns. The data on the participants’ activities during the experiment is recorded based on a database logging approach. The Web-based event logs (database log) provide an efficient and non-intrusive method for collecting data from the participants for the purpose of analyzing computer-human interactions. Each time a user performs an interaction with MC-SDSS, the system writes records to the database.
(3) Analyzing the event log data for testing the hypotheses
19
1.5 Structure of thesis
The thesis is divided into seven chapters (see Figure 1). Chapter 1 discusses the research background and outlines the research questions, hypotheses, and methodology. Chapter 2 explores the relevant literature. It gives a background on the pertinent concepts including:
spatial planning, PGIS, collaborative multicriteria spatial decision analysis (Collaborative GIS-based MCDA), and Web 2.0 and Web 2.0-based collaborative GIS-MCDA. The
20
21
Chapter 2
2
Literature review
This chapter gives an overview of the theories, concepts, and practices that are relevant to this dissertation. It reviews the existing literature on studying information acquisition behavior in the process of decision making in general, and collaborative GIS-MCDA in particular. The chapter begins with a description of the pertinent concepts, including spatial planning, PGIS, GIS-based MCDA methods and framework, collaborative spatial multicriteria decision analysis (collaborative GIS-MCDA), and Web 2.0 and Web 2.0-based collaborative GIS-MCDA. Next, the theories and empirical studies from other areas of decision making that can contribute to a better understanding of the information acquisition/search behavior in collaborative GIS-MCDA are reviewed. The empirical studies of information acquisition in the decision making process and methodologies concerning information acquisition behavior are also examined. Attention is given to the information processing metrics commonly used in the literature, as well as how the metrics are operationalized. Finally, the theoretical and empirical perspectives on the effects of different types of decision situations (i.e., decision situations manipulated by task complexity, information aid, and decision mode) on the information acquisition
metrics are reviewed.
2.1 Participatory spatial planning
22
environment, and to achieve the social and economic objectives (Däne & Van Den Brink, 2007).
The approaches to spatial planning have been traditionally recognized as centralized, bureaucratic and top-down activity carried out by planning offices, planning authorities and other stakeholders (Krek, 2005). Typically, planners and professionals carry out almost all activities by themselves, starting from problem identification to plan formulation, with very little or no consideration given to the views of beneficiaries and other stakeholders1. Such approaches have been criticized for failing to provide an adequate solution for solving complex and wicked spatial problems, engaging diverse participants as competent stakeholders (experts and lay-persons), generating a nonconflictual decision or plan, democratizing planning process, etc. (Voss et al., 2004; Tang, 2006).
Rittel and Webber (1973) argue that planning problems are typically “complex”, “wicked” and “ill-structured”. The problems cannot be adequately solved by the rational comprehensive planning approaches. The contradictory issues and the number of environmental, economic, and social factors directly or indirectly influence planning, and
make it a complex process (Nidumolu, de Bie, van Keulen, Skidmore, & Harmsen, 2006; Yang et al., 2008). Such planning problems cannot effectively be addressed by a centralized approach (Tang, 2006; Joerin et al., 2009).
According to Massam (1988), a generic planning problem can be defined as follows: “given a set of N plans or alternatives, and for each an evaluation on a set of M criteria, for a set of G interest groups, classify the N alternatives in such a way as to identify their relative attractiveness so that agreement among interested groups is maximized” (p. 19). This definition implies that the diverse values, objectives, and interests of the interested groups (decision-makers and the recipients of the outcome of the planning process) form an integral part of the planning process (Hodge, 2003; Tang, 2006). Tang (2006) argues
1
23
that the main goal of planning to reconcile the diverse values, objectives, and interests into acceptable community interests may not be achieved by centralized planning approaches that rely only on planners’ judgment, which is based on their knowledge, culture, and values. In other words, the conflicting interests caused by the differences as a matter of worldviews and values, experience and trust, and knowledge and expertise are not considered in the centralized approaches.
The tendency of centralized planning ignores the principles of democratic planning. In a democratic society, one of the fundamental freedoms is the right of a citizen to know and participate in a decision situation, when decisions about valued-concerns affect the welfare (taken broadly) of those people and the places in which they live (Jankowski & Nyerges, 2001a). Citizens are the key players in urban planning as they are the ones who will be affected by the consequences of planning (Simão et al., 2009; Wu et al., 2010) and they also know the reality and the issues around them better than anybody else. A democratic government based on pluralist participation must first obtain different and opposing opinions and preferences from interest groups and the public at large, analyze them and then develop a single policy platform that will reflect the will of the majority of
24
accountability, effectiveness and coherence through contributions to empowerment, legitimacy, and equity (McCall & Dunn, 2012).
2.2 Participation
Participation refers to a process by which the public can express opinions and exert
influence regarding political, economic, management or other decisions. Jankowski and Nyerges (2001a) argue that at least four cumulative levels of “social interaction” fall
under the umbrella term of “participation”: communication, cooperation, coordination, and collaboration. At a basic level of participation, people communicate with each other to share and exchange ideas, concerns,viewpoints, and knowledge as an essential process of social interaction. A cooperative interaction is defined by a set of processes which help people interact together in order to accomplish a specific goal or develop2. Cooperative interactions occur when a constructive change for one individual also increases the collective benefit of a group of individuals3. In a coordinated interaction, participants agree to cooperate, but they also agree to sequence their cooperative activity for mutual, synergistic gain (Jankowski & Nyerges, 2001a). A collaborative interaction is the process through which participants in a group agree to work on the same task simultaneously or at least with a shared understanding of a situation in a near-simultaneous manner (Roschelle & Teasley, 1995). The collaboration of people representing diverse areas of competence, political agendas, objectives and conflicting goals, scenarios, and social interests provide a synergic solution during planning. Through such a process, interested parties can have an active role from the initial stages (formulation of goals, exploration of alternatives) right up to the final stage of planning (Carsjens & Ligtenberg, 2007).
There are a number of advantages of a participatory approach to the planning process. A participatory process:
2 http://www.londonmet.ac.uk/deliberations/collaborative-learning/panitz-paper.cfm 3
25
• enables individuals to voice their concerns and work on a compromise solution, leading to consensus decision-making practices.
• “encompasses a group of procedures designed to consult, involve, and inform the public to allow those affected by a decision to have an input into that decision; “input” is the key phrase, differentiating participation methods from other
communication strategies.” (Rowe & Frewer, 2000, p.6);
• provides a rich source of updated information that helps to improve the quality of the analysis, leading to different solutions (Bugs et al., 2010);
• helps decrease the complexity level as a group of people including local or neighborhood citizens, planning experts, and government employees has more information (knowledge) to understand and tackle the decision problem;
• assures sustainability, stability and longevity of plan which stays intact over time4;
• may improve the general sense of community and trust in government, since individuals themselves participate in planning and affect decisions (Tang & Waters, 2005);
• can avoid the problems associated with bureaucratic governance (Pennington, 2004);
• promotes the development process; the plans and decisions, which are well-designed but have not included public involvement, may face opposition which will slow or stop the project.
4
26
2.3 Participatory GIS-based planning
2.3.1 Participatory GIS (PGIS)
GIS-based approaches have the potential to improve the quality of plans, helping planners to achieve more informed, consistent, timely, and accurate spatial decisions by producing relevant information (Fischer & Nijkamp, 1993; Esnard & MacDougall, 1997; Voss et al., 2004; Witlox, 2005; Sieber, 2006). Dai, Lee, and Zhang (2001) describe the main advantages of using GIS in planning as follows: the increase of efficiency, the automation of planning tasks, accuracy improvement, accessibility at low costs, ease of use by public, very short time for data manipulation, the possibility to explore diverse scenarios, providing decision support, and ease of handling the graphic output.
While the planners and decision-makers have full access to relevant spatial data/information and GIS tools, there are relatively few GIS-based spatial planning and decision-making tools that are available to the general public. This division has been one of the main criticisms of GIS (Pickles, 1995; Carver, 1999; Carver & Peckham, 1999; Dragićević, 2004). During the 1990s, the critiques of the uses of traditional GIS in society
and calls for enhanced public participation in spatial planning have led to the use of GIS for participatory planning/decision making. GIS and its offspring spatial decision support systems (SDSS) were suggested as information technology aids to facilitate geographic problem understanding and decision making in a participatory setting (Jankowski & Nyerges, 2001a). In general, these technologies lie within the broad umbrella of what has become known as Participatory GIS (PGIS). PGIS shifts the spatial planning from a closed, expert-oriented process to an open, community-oriented process (Malczewski, 2004). There are many definitions of the concept of PGIS. For example, PGIS is defined as:
27
• an integrative and inclusive process-based set of GIS methods and technologies amenable to public participation, multiple viewpoints, and diverse forms of information (Krygier, 2002);
• a computer-aided approach that creates an environment to facilitate analysis and deliberation in a group decision setting (Jankowski & Nyerges, 2001a), allowing participants to access and understand information, incorporate local knowledge, integrate and contextualize complex spatial information, dynamically interact with input, and analyze alternative plans (Sieber, 2006);
• a system that facilitates the meaningful introduction of appropriate forms of spatial information and analytical tools for widening public participation in the policy-making process, and promotes the goals of nongovernmental organizations, grassroots groups, and community-based organizations (Tang & Waters, 2005).
2.3.2 Collaborative multicriteria spatial decision support
systems
While the mainstream GIS technology is focused on the creation of easy-to-use, ubiquitous mapping and spatial analysis tools, it has lacked a capability to collate
28
providing a rich collection of techniques and procedures for eliciting the decision-makers’ preferences; structuring decision problems; as well as designing, evaluating, and prioritizing decision alternatives (Feick & Hall, 1999; Jankowski & Nyerges, 2001a; Kyem, 2004; Malczewski, 2006a). Marttunen (2011) summarizes the potential benefits of the use of MCDA in planning (see Figure 2).