Article
Effects of Time, Temperature, and Solvent Ratio on
the Extraction of Non-Extractable Polyphenols with
Anticancer Activity of Barhi Date Palm Kernels
Extracts Using Response Surface Methodology
Israa A. Mahmud 1*, Mohamed E. S. Mirghani 1,2*, Faridah Yusof 1 and Ma'an Al-khatib 1.
1 Department of Biotechnology Engineering, Kulliyyah (Faculty) of Engineering, International Islamic
University Malaysia (IIUM), P. O. Box 10 Gombak, 50728 Kuala Lumpur, Malaysia;
[email protected] (I.M.); [email protected] (M.E.S.M.); [email protected] (F.Y.); [email protected] (M.A.).
2 International Institute for Halal Research and Training (INHART), IIUM, Malaysia; [email protected]
(M.M.)
* Correspondence: [email protected] (M.E.S.M.); [email protected] (I.M.)
Abstract: Dietary polyphenols exist in two forms; extractable polyphenols (EPP) or compounds
solubilised by aqueous/organic solvents, and non-extractable polyphenols (NEPP) or compounds remain in the corresponding residues after the extraction. At present, most researchers focus on EEP fractions, while NEPP is neglected. Thus, this study aimed to release NEPP from the remaining powder residue of Barhi date palm kernels (BDPK) with acid hydrolysis. The related extraction conditions were determined and optimised using response surface methodology (RSM) for maximisation of NEPP with highest cytotoxic and antioxidant activities. The face-centred central composite design (FCCCD) was used to establish treatments based on three independent variables, namely; extraction temperature, time, and solvent/sample ratio. Under the optimal conditions, the experimental values for DPPH radical-scavenging capacity of NEPP (IC50=57.52µg/mL), and cytotoxicity of NEPP against A549 and HT29 cells were IC50=17.4 µg/mL and 31.4µg/mL, respectively. The experimental values were in agreement with those predicted by RSM models, confirming the suitability of the model employed and the success of RSM for optimisation of the extraction conditions for NEPP from BDPK. These results indicate that NEPP from industrial date fruit waste could be promising candidate as natural antioxidants with significant antiproliferation effect against A549 and HT29 cancer cells in-vitro.
Keywords: Barhi date palm kernels (BDPK); non-extractable polyphenols (NEPP); anticancer
activity; antioxidant activity; response surface methodology; optimisation.
1. Introduction
The kernel of the date palm tree (Phoenix dactylifera L.), which constitutes 10% of the fruit weight, is the major by-product of date processing industry. Date palm kernels (DPK) could be considered an excellent source of many valuable substances such as dietary fibres, carbohydrates, protein, oil, minerals, vitamins, amino acids and bioactive polyphenols with potential applications of DPK and their constituents in the human nutrition, cosmetics, and pharmaceutical applications that may be beneficial to human health [1,2]. DPK, in general, contain higher concentration of secondary metabolites compared to the edible fruit [3]. Given the scale of the international date industry, a large quantity of DPK can easily be collected from the date processing industries or from the date palm groves [2].
Such inexpensive, largely abundant and low-value date palm fruit waste could, however, potentially be industrially exploited [4,5]. A healthy caffeine–free coffee, which can be produced from
roasted or unroasted DPK powders are produced commercially and are widely consumed in Middle Eastern countries [6]. Recently, DPK have been recognised as a source of bioactive compounds including dietary fibre, high amounts of polyphenols and natural antioxidants [7]. Additionally, DPK extracts have shown some positive molecular activities, including prevention or management of neurodegenerative diseases [6], inflammation [8] and cancer [9,10]. Previous studies suggested that the polyphenolic compounds are primarily responsible for the antioxidant and biological activities of DPK [3,7,11], and this was experimentally confirmed in the lab [12,13].
Plant secondary metabolites such as polyphenols, play an important role in the defence against free radicals. Medicinal plant parts (roots, leaves, kernels, stems, flowers and fruits) are commonly rich in phenolic compounds, such as flavonoids, tannins, stilbenes, coumarins, lignans [14]. Polyphenolics exhibit a wide range of biological effects and such functions have been attributed to their free radical scavenging and antioxidant activities [15].
In view of these potential health benefits, there has been intensive research on natural antioxidants derived from plants. “Structurally, phenols comprise an aromatic ring bearing one or more hydroxyl substituents and range from simple molecules to highly polymerised compounds” [16]. It is well known that phenolic compounds exist in both extractable (free) and non-extractable (bound) forms in plant cells and that the extractable polyphenols (EPP) are solvent extractable. In contrast, the non-extractable polyphenols (NEEP), which are covalently bound to the plant matrix, cannot be extracted into water or aqueous/organic solvents mixtures [17].
Although the total phenolic contents and antioxidant activities of alcoholic DPK extracts have been investigated previously [3,9,11,18], these studies, only considered the extractable polyphenols (EPP) present in the DPK. Habib, et al. [19] and Ahmed, et al. [20] are the only ones who investigated the proanthocyanidins in their studies. “Proanthocyanidins are generally termed as NEPP when examining the TPC. NEPP represent the proportion of antioxidants remaining in the residue of the aqueous-organic extraction treatment of EPP, and this residue has been reported to contain large amounts of NEPP with specific biological activities” [2]. NEPP are large molecular weight, highly polymerised polyphenols, include hydrolysable tannins and proanthocyanidins covalently conjugated to cellulose, protein and polysaccharides through ester bonds, and can be difficult to hydrolyse [21,22]. NEPP are normally indigestible by intestinal enzymes [23]. It is anticipated that NEPP exert their antioxidant properties after being fermented by the colon microflora into bio -accessible phenolic compounds, which might be then beneficial to gastrointestinal health [24]. Furthermore, it is reported that the NEPP could contribute 60% to 90% to the total polyphenol content (TPC), which emphasises the fact that the main biological activities such as antioxidant and antiproliferative activities attributed to polyphenols would reflect the contribution of this fraction of polyphenols, which is usually neglected, to the content of total polyphenols in foodstuffs [2].
An appropriate experimental design is necessary for any optimisation study, and the two most common designs are one-factor-at-a-time (OFAT) experiments and response surface methodology (RSM). OFAT experiments were used here to provide data regarding extraction factors with significant effects on phenolic antioxidants from BDPK. Next, these factors were analysed by RSM using face-centred central composite design (FCCCD) to more precisely determine optimal extraction conditions, that enables the simultaneous evaluation of the effects of selected ranges of independent variablesand their interactions on response variables [29,30].
The extraction of polyphenols from plant materials is strongly influenced by many factors; extraction time, temperature and solvent-to-sample ratio among other factors [31,32]. Since the previous results [13] indicated that the EPP from BDPK were strong antioxidants and showed cytotoxic effects in selected human cancer cells, this research was carried out with the aim of optimising critical process parameters (extraction temperature, time and solvent/sample ratio) affecting the extraction of NEPP from BDPK using RSM in order to simultaneously maximise possible extraction of the TPC, TFC, TPAC with high DPPH• scavenging capacity and anticancer effects of NEPP extracts on A549 and HT29 human cancer cells.
2. Materials and Methods
2.1 Chemicals
Folin-Ciocalteu phenol reagent, gallic acid, ascorbic acid, catechin, aluminium chloride (AlCl3) and 2,2 diphenyl 1-picrylhydrazyl (DPPH), extraction solvents (methanol, butanol and ethanol), ferric chloride hexahydrate, and hydrochloric acid, sodium carbonate, were purchased from Sigma (St. Louis, MO, USA). Fetal bovine serum (FBS), RPMI 1640 medium, Penicillin-streptomycin solution and phosphate buffer saline (PBS) were from Nacalai Tesque INC. (Kyoto, Japan). Methanol and ethanol were from Merck Co. (Darmstadt, Germany). 3-(4,5 dimethylthiazol-2-yl)-2,5-diphenyltetrazolium bromide (MTT), Dimethyl sulfoxide (DMSO) and trypan blue were from Sigma (St. Louis, MO, USA). The human lung (A549) and human colon cancer cells (HT29) were obtained from American Type Tissue Collection (ATCC, Manassas, Va., USA.).
2.2. Extraction Procedure
2.2.1. Preparation of Extractable Polyphenols (EPP) Fraction.
Extraction of extractable polyphenols (EPP) was carried out under optimised extraction conditions (by extracting for 2.37 hours at 43.23°C in 75.39% methanol/ethanol-to-water concentration and 54.57 mL/g of solvent/sample ratios). In this paper, which is based on unpublished data [12] was carried out following the method described by [12]. The collected EPP residues were used to extract the corresponding non-extractable (NEPP) from BDPK.
2.2.2. Preparation of Non-Extractable Polyphenols (NEPP).
For the NEPP acid hydrolysis, the residue post-EPP extraction process under optimised conditions was collected and was used for the extraction of NEPP following the method described by Sirisena, et al. [33]. The extraction process was conducted in the absence of a metal catalyst. Sirisena and her colleagues compared the yield of NEPP extracted from DPK in the presence and the absence of Fe3+ ions, and the results were obtained using spectrophotometric scan at absorption wavelength range 500 to 550 nm [21,33]. The scan for extraction without added Fe3+ showed a significant increase in absorbance at λ550 nm indicating extraction of proanthocyanin. Based on these results, the NEPP extraction method was modified and performed without Fe3+ that could interfere with total flavonoid and antioxidant assays.
coloured procyanidins. From the EPP residue, 2 g (dry weight) was mixed with 25-ml butanol/HCl (97.5:2.5, v/v) and heated at 100°C in a conical flask placed in the centre of the magnetic stirrer, with stirring at a constant rate (at speed 7) for 3 hours (h). After the HCl-butanol depolymerisation, the mixture was centrifuged at 7000 rpm for 15 min, the supernatant was collected, and the residue was subjected to two times washings with 10 mL butanol. Supernatants were combined and evaporated at 60°C to a small volume, and the pH of the concentrated extract was adjusted to 4 with 1 M sodium hydroxide (NaOH). In a previous study [33], it was found that PH less than 4 and above 5 caused precipitation of the extract; hence PH ~4 was selected to maintain both intact extract and the compatibility with buffers. Using an amber reagent bottle, the dried extracts were collected, weighed to calculate the percent yield of the crude extract, capped tightly, freeze-dried and stored at -20°C until analysis. All the experiments were carried out in triplicate.
2.3. One-Factor-at-a-Time Experiments
Many factors can affect the extraction of NEPP with acid hydrolysis treatment. Three factors were selected, namely; extraction temperature, time and solvent/sample ratio. Firstly, the influence of the extraction time (1, 2, 3, 4, 5h) on the NEPP content was determined under the following fixed conditions butanol/HCl (97.5:2.5, v/v), solvent/sample ratio (12.5:1, ml/g) and extraction temperature 100°C. Secondly, the impact of the liquid/solid ratio (5:1, 10:1, 15:1, 20:1, 25:1 ml/g) on the NEPP content under the following fixed conditions: butanol/HCl (97.5:2.5, v/v), extraction time 3 h, temperature 100°C. Finally, the influence of temperature (40, 60, 80, 100°C) on the NEPP yield under the following fixed conditions: butanol/HCl (97.5:2.5, v/v), solvent/sample ratio (20:1, ml/g), extraction time 3 h.
2.4. Chemical Analysis
2.4.1. Determination of Non-Extractable TPC, TFC, TPAC Contents
The non-extractable TPC was determined by Folin-Ciocalteu colorimetric method [34]. The TFC was measured spectrophotometrically by using the aluminium chloride colorimetric assay [18]. While, total proanthocyanidin content (TPAC) in BDPK extract was determined using vanillin-HCl assay described in the previous study [35].
2.4.2 DPPH Free Radical Scavenging Assay
The electron donating ability of the obtained NEPP extracts was measured by bleaching a purple solution of 1,1- diphenyl-2-picrylhydrazyl (DPPH) radical and was estimated according to the method described previously [36]. Briefly, a solution of DPPH was freshly prepared by dissolving 6 mg DPPH in 50 mL methanol to obtain a final concentration (0.3 mM). 2.5 mL of DPPH solution was mixed together with the methanol extract with varying concentrations (20–100 µg/mL) in a test tube and vibrated using vortex mixer for 20 seconds (s). Then, the samples and controls were incubated in the dark at room temperature. After 30 min of incubation, the absorbance of the samples and control was read at 517 nm against the blank. The absorbance was recorded, and the antioxidant activity was expressed by the percent inhibition of DPPH radicals and calculated using the following equation;
%inhibition of DPPH activity = 𝐴control−𝐴 𝐴sample
control × 100 (1)
Acontrol: the absorbance of control (DPPH + methanol solution only, without test sample).
Asample: the absorbance of the test sample (DPPH solution mixed with test sample extract/standard).
All measurements were performed in triplicate, and graphs were plotted using the average of three determinations.
The potential antiproliferative/cytotoxic effect of non-extractable (NEPP) extracts against two human cancer cells lines (A549 and HT29) was tested using MTT assay. For screening, the cells were treated with the NEPP extracts at 0-1000 μg/ml concentration [13]. The IC50 (inhibiting 50 % of cell growth) values of NEPP extracts were measured, and their direct antiproliferative/cytotoxic effects were determined.
2.5 Experimental Design and Statistical Analysis
After determining the preliminary range of extraction variables through the single-factor test, a three-level-three-factor, FCCCD was employed in this optimisation study. Dependent variables (responses) measured were (TPC, mg GAE/g DW), (TFC, mg CE/g DW), (TPAC, mg CE/g DW), (DPPH SAC, IC50, µg/mL), (yield, %), (A549 IC50, µg/mL) and (HT29 IC50, µg/mL) of NEPP extract from BDPK, and represented as responses R1, R2, R3, R4, R5, R6 and R7 respectively, were optimised
using RSM. The independent variables of extraction temperature (°C), extraction time (h) and solvent/sample ratio (v/w, mL/g) were selected as three important factors to optimise the extraction of NEPP, and represented as variables A, B and C, and used to obtain the coefficients of the quadratic model using the aid of the Design-Expert software (version 7.0.2.; Stat-Ease, Inc., Minneapolis, MN, USA). The range and levels of the independent variables used in the experimental design in this study are shown in Table 1.
Table 1. Independent variable values of the Barhi date palm kernels NEPP extraction process and their corresponding levels
Independent variable symbols Coded independent variable levels
-1 0 +1
Temperature (°C) [A] 70 85 100
Time (h) [B] 2 3 4
Solvent /sample ratio (v/w, mL/g) [C] 1:15 1:20 1:25
h, hour.
A total of 17 experiments were carried out as unveiled by the results in the single-factor experiments with three centre points to improve the precision of the method. Predicted (pred.) and adjusted (adj.) correlation coefficient (R2) was calculated to evaluate the quality of the fitted model, and its statistical significance was checked by F-test and p-value test. Analysis of variance (ANOVA) was performed to evaluate the effect of independent variables on the responses, and p < 0.05 was statistically significant. All the experiments were carried out at random to minimise the influence of the unexplained variability in the observed responses due to systematic errors. Three-dimensional surface graphs were drawn to display the experimental region and the effects of independent variables on the responses.
2.6 Verification of the Experimental Model
2.7 Statistical Analysis
The data analyses were performed with Minitab 17 (Minitab Inc., State College, PA, USA) software to analyse the data by ANOVA. The mean values were considered significantly different when p value is less than 0.05. All experiments were carried out in triplicate, and the data were expressed as the mean ± standard deviation (SD). The IC50 values were calculated from linear regression analysis. A Pearson correlation test was used to evaluate the relationship between the antioxidant activities, crude extract yield, total phenol content, total flavonoid content, total proanthocyanidin content and the anticancer activity of the NEPP crude extract from BDPK. The statistical significance level for correlation analysis was set up at p < 0.05. Optimal extraction conditions were estimated through three-dimensional response surface analyses of the three independent variables and the seven evaluated responses (dependent variables) using Design-Expert 7.0.1 analysis software.
3. Results and Discussion
Here we report for the first time a database regarding the levels of cytotoxic and antioxidant activities of the polyphenols (NEPP) from BDPK. A calibration curve of gallic acid was constructed to measure the content of phenolic compounds in the NEPP from BDPK. The calibration equation for gallic acid (TPC) was y = 0.0075x + 0.017 (R² = 0.9899). The calibration equation for catechin (TFC) was y = 0.0076x + 0.0442 (R² = 0.9755). While the calibration equation for catechin (TPAC) was y = 0.0082x + 0.0197 (R² = 0.9775). The calibration curve of ascorbic acid was also measured to determine the scavenging potential of TPC, TFC and TPAC by DPPH. The calibration equation for ascorbic acid was y = 0.0105x - 0.0102 (R² = 0.9802).All results in the present study were calculated based on the above calibration curve and expressed as gallic acid equivalent (GAE) in mg per g dry weight (DW); catechin equivalent (CE) in mg per g dry weight (DW); and IC50, µg/ml scavenging effect of extract by DPPH.
3.1. One-Factor-at-a-time Experiments for Extraction NEPP From Barhi Date Palm Kernels
The initial step of the preliminary experiment was to investigate whether extraction temperature, extraction time and solvent/sample could be optimised for extraction of phenolic, flavonoid, proanthocyanidin with high antioxidant and cytotoxicity properties using one-factor-at-a-time (OFAT) experiments, to determine appropriate experimental ranges for subsequent optimisation analyses. This was performed by changing one factor while keeping the other two factors constant.
3.1.1. Evaluation of Extraction Time:
Extraction time is an important parameter in optimising the recovery of phenolic compounds and antioxidant capacity. From literature, extraction time can be as small as few minutes or very long extending up to 24 hours depending on the phenolic compounds present in the plant material [30,38].
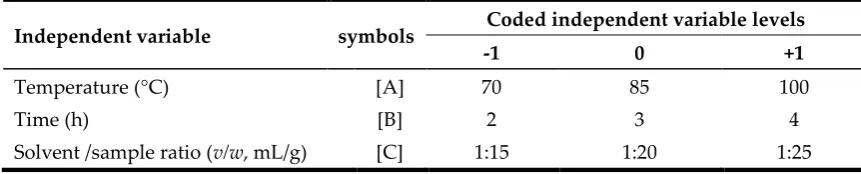
In the present study, extraction time played an important role in extraction of phenolic compounds (TPC, TFC and TPAC), crude extract yield, and their antioxidant/cytotoxic properties of BDPK NEPPs’ extract. With 12.5:1 mL/g solvent/sample ratio, extraction times from 1 to 5 hours and an extraction temperature of 100˚C were studied. As illustrated in Figure (1A, B, C), the extraction time affected TPC, TFC and TPAC significantly (p < 0.05).
compounds to oxidise due to prolonged exposure of polyphenols to temperature, light and oxygen [39,40].
DPPH radical is a widely accepted tool to evaluate the free radical scavenging ability of natural compounds (Nagai, Inoue, Inoue, & Suzuki, 2003). The antioxidant potential is inversely proportional to the IC50 value, which was calculated from the linear regression of the antioxidant activity versus the extract concentration. The maximum scavenging capacity of DPPH radicals of NEPP extract from BDPK occurred at 3h (IC50 = 61.82 ± 4.53 µg/mL). However, these yields (TPC, TFC, TPAC) and antioxidant capacity decreased significantly (p < 0.05) at 5h (7.02 ±0.40, 2.64 ± 0.27, 5.96 ± 0.68) and (IC50 = 64.33 ± 3.58 µg/mL), respectively (Figure 1A, B, C, D).
Our previous work [13] confirmed that the NEPP extracts of BDPK demonstrated selective cytotoxicity towards human lung (A549) and colon cancer (HT29) cell lines while being less cytotoxic against the normal cells. Such selective cytotoxic activity suggested that the “active substances interacted with special cancer-associated receptors or cancer cell special molecule, thus triggering some mechanisms that cause cancer cell death” [41].
Data in Figure 1F, G revealed similar antiproliferation property pattern on both cancer cells as of DPPH radical scavenging capacity, in which the inhibitory effect of NEPP on the cell growth improved significantly (p < 0.05) at 3 h; IC50 = 43.15 ± 7.79 µg/ml and IC50 = 47.32± 13.63 µg/ml, in both cancer cells A549 and HT29, respectively.
However, this effect started to decrease beyond 3h, but insignificantly (Figure 1F, G). Therefore, a longer extraction time had no effect on the extraction of phenolic compounds [42]. Furthermore, inordinately long extraction process might lead to oxidation of phenolic compounds owing to prolonged light or oxygen exposure, which might lead towards the decreased of free radical scavenging ability of NEEP extract from BDPK and accordingly decreased its antiproliferative effect against cancer cells. The decomposition in polyphenolic compounds is also manifested by a decline in antioxidant activity [40].
Thus, taking into account the economic point of view and also depending upon the quantification (yield) of phenolic compounds and antioxidant/cytotoxic activities of BDPK NEPP extract, 3 h was selected as the optimal extraction time because at this time period all responses showed the highest values. So, an extraction time of 2–4 h was chosen for RSM optimisation.
1 2 3 4 5 0
2 4 6 8 10 12
TP
C (
mg
GAE
/g DW)
Time (hr)
(B)
1 2 3 4 5
0 2 4 6 8 10 12
TF
C (
mg
CE
/g DW)
Time (hr)
1 2 3 4 5
0 2 4 6 8 10 12
TP
AC
(mg
CE
/g DW)
Time (hr)
(C)
(D)
1 2 3 4 5
0 20 40 60 80 100
DP
PH
(IC50
,
g/mL
)
Time (hr)
1 2 3 4 5
0 2 4 6 8 10 12
YIEL
D (
%)
Time (hr)
(E)
(F)
1 2 3 4 5
0 20 40 60 80 100
A5
49
(IC
50
,
g/mL
)
Time (hr)
1 2 3 4 5
0 20 40 60 80 100
HT
29
(IC
50
,
g/mL
)
Time (hr)
(G)
Figure 1. Effects of extraction time (h) on (A) TPC, (B) TFC, (C) TPAC, (D) DPPH scavenging capacity, (E) extracts yield and on the cytotoxicity of extracts in (F) A549 and (G) HT29 cells in non-extractable polyphenols extracts from Barhi date palm kernels. Extraction was conducted under these conditions;
extraction temperature = 100˚C and solvent/sample ratio = 12.5:1 mL/g.
3.1.2. Evaluation of Solvent/Sample Ratio:
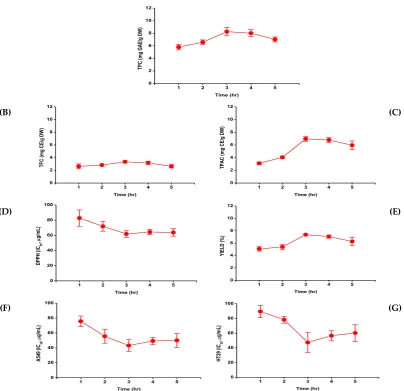
Different solvent/sample ratio was needed for the maximum recovery of phenolic, flavonoids and proanthocyanidins compounds and antioxidant and antiproliferation activities against cancer cells. Figure 2 reveals that the total extraction yield (TPC, TFC, TPAC), crude extract yield, DPPH radical scavenging activity and antiproliferative capacity of NEPP significantly (p < 0.05) increased by the solvent/sample ratio until the ratio was 20:1 mL g−1; after that, the NEPP yields and DPPH radical scavenging activity were almost unchanged (p > 0.05). A higher extraction solvent ratio can cause larger amounts of components from plant material to diffuse into solvent more effectively, bringing in a promoted extraction efficiency [43,44].
5 10 15 20 25 0 2 4 6 8 10 12 TP C ( mg GAE /g DW)
Solvent/Sample Ratio (mL/g)
(B)
5 10 15 20 25 0 2 4 6 8 10 12 TF C ( mg CE /g DW)
Solvent/Sample Ratio (mL/g)
5 10 15 20 25 0 2 4 6 8 10 12 TP AC (mg CE /g DW)
Solvent/Sample Ratio (mL/g)
(C)
(D)
5 10 15 20 25 0 20 40 60 80 100 120 140 DP PH (IC50 , g/mL )
Solvent/Sample Ratio (mL/g)
5 10 15 20 25 0 2 4 6 8 10 12 YIEL D ( %)
Solvent/Sample Ratio (mL/g)
(E)
(F)
5 10 15 20 25 0 40 80 120 160 200 A5 49 (IC 50 , g/mL )
Solvent/Sample Ratio (mL/g)
5 10 15 20 25 0 40 80 120 160 200 HT 29 (IC 50 , g/mL )
Solvent/Sample Ratio (mL/g)
(G)
Figure 2. Effects of solvent/sample ratio (mL/g) on (A) TPC, (B) TFC, (C) TPAC, (D) DPPH scavenging capacity, (E) extracts yield and on the cytotoxicity of extracts in (F) A549 and (G) HT29 cells in non-extractable polyphenols extracts from Barhi date palm kernels. Extraction was conducted under these
conditions; extraction temperature = 100˚C and extraction time = 3h.
The anticancer capacity of NEPP from BDPK was evaluated against human lung (A549) and colon (HT29) cancer cell lines. Results presented in Figure 2F, G are expressed as concentration inhibiting fifty percent of cell growth (IC50). Among the five NEPP extracts, extraction with 20:1 mL/g solvent-sample ratio exerted the most potent cytotoxic activity against human lung carcinoma A549 and colon cancer cells with IC50 values equal to 44.02 ± 8.854µg/ml and 49.03± 11.215µg/ml, respectively. However, these activities were less cytotoxic in lower or higher solvent ratio (Figure 2F, G). These data suggest that NEPP from BDPK reduces effectively human lung carcinoma and colon cancer cell viability. These results highlight for the first time the strong activity of BDPKs’ NEPP against lung carcinoma (A549) and human colon cancer (HT29) cell lines.
acting as anti-proliferative agents in-vitro [47]. Based on the given results, 20:1 mL g−1 was ascertained as the solvent/sample ratio for RSM.
3.1.3. Evaluation of Extraction Temperature:
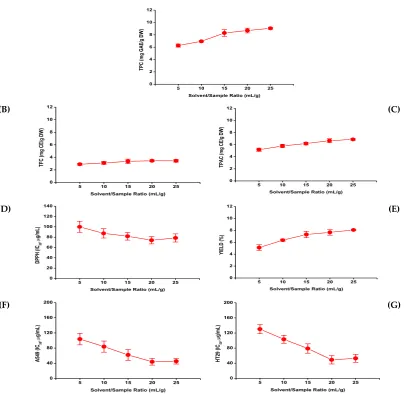
Heat can enhance the recovery of the phenolic compounds in some cases, as described by [7,42]. Generally, a high extraction temperature had a positive effect on the yield of phenolic compounds, but these increments are not consistent. Here, incubation temperatures for NEPP; TPC, TFC, TPAC recovery; crude extract yield, DPPH radical scavenging capacity and cytotoxicity were between 55– 100°C (20:1 mL/g solve/sample ratio, 3 hours extraction time). A direct relationship was observed between the extraction temperature and TPC recovery, as shown in Figure 2A. With respect to TFC and TPAC recovery, DPPH radical-scavenging capacity, and NEPP crude extract yield, the extraction temperature was optimal at 85, 70, 85, and 85°C, respectively (Figure 2B, C, D, E).
Increased temperature led to enhance the extraction efficiency through increases of surface contact area and decreases viscosity and density of solvent media. These factors favoured the release of NEPP (bound phenolics) from plant material and weaken the cell wall integrity, thus, enhancing solubility and diffusion coefficients [48]. Increasing temperature may accelerate the transfer of NEPP and disrupt plant cellular constituents which may lead to increased cell membrane permeability, thus helped to release NEPP [49]. According to the equilibrium principle, the elevated temperature could improve the extraction rate and thereby reduce the extraction time required to reach the maximum recovery of phenolic compounds [50].
However, elevated temperatures may not be suitable for all phenolic compounds, especially those thermally sensitive, and thus easily oxidised as a function of temperature [39]. The TFC recovery was maximised at 85°C, while TPAC recovery was maximised at 70°C (Figure 3B, C). After these points, the recovery of TFC and TPAC were decreased, and this could be attributed to the decomposition of some thermally unstable flavonoids and proanthocyanidins [39]. Similar results were observed with respect to DPPH radical-scavenging capacity, which peaked at 85°C (Figure 3D). NEEP extract was able to reduce the blue DPPH radical solution into a yellow stable compound at IC50 =71.62 ± 9.31 µg/mL but then declined moderately (p > 0.05) with further increases in temperature (Figure 3D).
Phenolic compounds which are powerful antioxidants are known to have, in many cases, anti-proliferative activities against most cancer cell lines [51]. Several methods have been used to measure the antioxidant activities of EPP from date fruit (Amari and Hallawi) varieties and were reported to possess antioxidant activity comparable to vitamin C [52]. The earlier investigation reported that date fruits have the highest concentration of total polyphenols among the dried fruits due to the greater exposure to sunlight and extreme temperature for date fruits compared to other fruits [53].
(A)
55 70 85 100
0 2 4 6 8 10 12 TP C ( mg GAE /g DW) Temperature (°C) (B)
55 70 85 100
0 2 4 6 8 10 12 TF C ( mg CE /g DW) Temperature (°C)
55 70 85 100
0 2 4 6 8 10 12 TP AC (mg CE /g DW) Temperature (°C) (C) (D)
55 70 85 100
0 2 4 6 8 10 12 YIEL D ( %) Temperature (°C) (E) (F)
55 70 85 100
0 40 80 120 160 200 A5 49 (IC 50 , g/mL ) Temperature (°C)
55 70 85 100
0 40 80 120 160 200 HT 29 (IC 50 , g/mL ) Temperature (°C) (G)
Figure 3.Effects of extraction temperature (˚C) on (A) TPC, (B) TFC, (C) TPAC, (D) DPPH scavenging
capacity, (E) extracts yield and on the cytotoxicity of extracts in (F) A549 and (G) HT29 cells in non-extractable polyphenols extracts from Barhi date palm kernels. Extraction was conducted under these conditions; extraction time = 3 h and solvent/sample ratio = 20:1 mL/g.
3.2. Fitting the Response Surface Models
This study aimed to determine the experimental conditions for the optimisation of TPC, TFC, and TPAC so as to maximise the bioactivity of the NEPP extract represented by the antioxidant capacity and antiproliferative property using response surface methodology. Based on the results of the one-factor-at-a time experiments (Figures; 1, 2 and 3), the levels of the three factors were determined; extraction temperatures (70°C, 85°C and 100°C), solvent-to-sample ratio (15:1 mL/g, 20:1 mL/g and 25:1 mL/g) and extraction time (2h, 3h, and 4h) were selected for the RSM experiment. The quadratic model from the FCCCD setup was used to generate a response surface image by identifying the relationship between each of the seven evaluation indices and process variables; extraction temperature (A), extraction time (B) and solvent/sample ratio (C), as well as to find out the conditions that optimised the extraction process for maximum value of TPC, TFC, TPAC, extract yield and minimum IC50 (µg/mL) of cytotoxicity and DPPH radical scavenging capacity of NEPP from BDPK. Hence, a quadratic model was selected and fitted well as suggested by the software for all three independent variables and the seven response variables. The experimental design and corresponding seven response variables are presented in Table 2.
55 70 85 100
1
Table 2. Central composite design matrix and corresponding responses
2
3
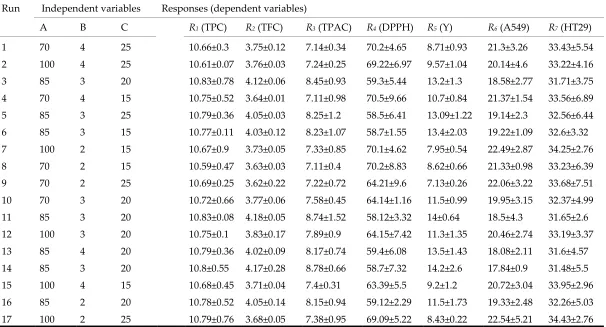
Run Independent variables Responses (dependent variables)
A B C R1 (TPC) R2 (TFC) R3 (TPAC) R4 (DPPH) R5 (Y) R6 (A549) R7 (HT29)
1 70 4 25 10.66±0.3 3.75±0.12 7.14±0.34 70.2±4.65 8.71±0.93 21.3±3.26 33.43±5.54
2 100 4 25 10.61±0.07 3.76±0.03 7.24±0.25 69.22±6.97 9.57±1.04 20.14±4.6 33.22±4.16
3 85 3 20 10.83±0.78 4.12±0.06 8.45±0.93 59.3±5.44 13.2±1.3 18.58±2.77 31.71±3.75
4 70 4 15 10.75±0.52 3.64±0.01 7.11±0.98 70.5±9.66 10.7±0.84 21.37±1.54 33.56±6.89
5 85 3 25 10.79±0.36 4.05±0.03 8.25±1.2 58.5±6.41 13.09±1.22 19.14±2.3 32.56±6.44
6 85 3 15 10.77±0.11 4.03±0.12 8.23±1.07 58.7±1.55 13.4±2.03 19.22±1.09 32.6±3.32
7 100 2 15 10.67±0.9 3.73±0.05 7.33±0.85 70.1±4.62 7.95±0.54 22.49±2.87 34.25±2.76
8 70 2 15 10.59±0.47 3.63±0.03 7.11±0.4 70.2±8.83 8.62±0.66 21.33±0.98 33.23±6.39
9 70 2 25 10.69±0.25 3.62±0.22 7.22±0.72 64.21±9.6 7.13±0.26 22.06±3.22 33.68±7.51
10 70 3 20 10.72±0.66 3.77±0.06 7.58±0.45 64.14±1.16 11.5±0.99 19.95±3.15 32.37±4.99
11 85 3 20 10.83±0.08 4.18±0.05 8.74±1.52 58.12±3.32 14±0.64 18.5±4.3 31.65±2.6
12 100 3 20 10.75±0.1 3.83±0.17 7.89±0.9 64.15±7.42 11.3±1.35 20.46±2.74 33.19±3.37
13 85 4 20 10.79±0.36 4.02±0.09 8.17±0.74 59.4±6.08 13.5±1.43 18.08±2.11 31.6±4.57
14 85 3 20 10.8±0.55 4.17±0.28 8.78±0.66 58.7±7.32 14.2±2.6 17.84±0.9 31.48±5.5
15 100 4 15 10.68±0.45 3.71±0.04 7.4±0.31 63.39±5.5 9.2±1.2 20.72±3.04 33.95±2.96
16 85 2 20 10.78±0.52 4.05±0.14 8.15±0.94 59.12±2.29 11.5±1.73 19.33±2.48 32.26±5.03
17 100 2 25 10.79±0.76 3.68±0.05 7.38±0.95 69.09±5.22 8.43±0.22 22.54±5.21 34.43±2.76
IC50, µg/ml was used to measure the capacity of non-extractable polyphenols (NEPP) from BDPK to neutralize 50% of DPPH free radicals. IC50, µg/ml
4
was also used to measure the ability of NEPP from BDPK to inhibit cell growth of A549 and HT29 by half (50%). Abbreviations: A, temperature; B, time;
5
C, solvent/sample ratio; TPC, total phenolic content; TFC, total flavonoid content; TPAC, total proacnthocyanidin content; DPPH,
(2,2-diphenyl-2-6
8
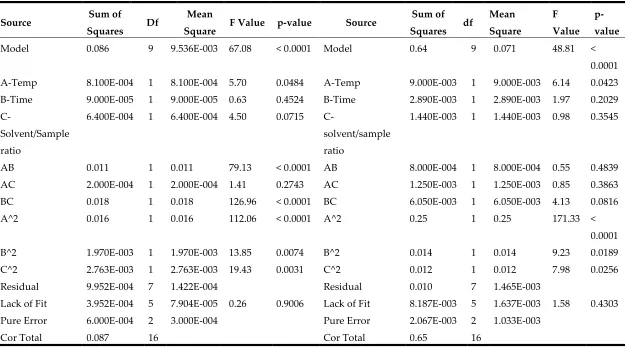
The statistical analysis of the quadratic models based on ANOVA is shown in Tables 3, 4, 5 and
9
6. The results indicated that the proposed models were significant (p < 0.0001). The coefficient of
10
determination (R2) were 0.9885, 0.9843, 0.9760, 0.9849, 0.9894, 0.9875 and 0.9887 for TPC, TFC, TPAC,
11
yield, DPPH and cytotoxic effect on A549 and HT29, respectively, indicating that the model can
12
predict ~99%, of the actual data for the responses. Whereas the adjusted coefficients of determination
13
(Adj. R2) were 0.9738, 0.9641,0.9451, 0.9655, 0.9759, 0.9714, and 0.9742, respectively revealed the high
14
degree of correlation between the empirical and predicted values. To ascertain the model further, the
15
lack of fit showed statistically-insignificant (p > 0.05), indicating that all the established quadratic
16
models were reliable and accurate for predicting the relevant responses.
17
Maximum recovery of TPC (10.83 ± 0.08mg GAE/g DW) and TFC (4.18 ± 0.05mg CE/g DW) was
18
recorded during Run No. 11. Maximum extract yield of NEPP (14.2±2.6%) and TPAC (8.78±0.66mg
19
CE/g DW) was recorded during Run No. 14. Minimum IC50 (µg/mL) of radical-scavenging capacity
20
of DPPH was recorded at 58.12±3.32 µg/mL during Run No. 11. The minimum IC50 (µg/mL) of
21
cytotoxicity of NEPP from BDPK on A549 and HT29 were recorded at 17.84±0.9µg/mL and 31.48±5.5
22
µg/mL during Run No. 5, respectively.
23
Multiple regression analysis was applied to the predicted data, and the software generated seven
24
regression equations which demonstrated the predicted relationship between the responses and the
25
three tested variables (Table 7), where R1, R2, R3, R4, R5, R6, R7 andR8 are the response values of TPC,
26
TFC, TPAC, yield, DPPH and cytotoxicity on both A549 and HT29 cancer cells, respectively.
27
While A, B and C, are the coded values of the temperature, extraction time and solvent/sample
28
ratio, respectively. A negative sign in each equation indicates an antagonistic effect of the variables,
29
whereas a positive sign indicates synergistic effect of the independent variables [54].
30
For the extraction yield of TPC, TFC, TPAC, crude extract yield, DPPH radical scavenging
31
activity and cytotoxicity, each response can be assigned a significant degree relative to the other
32
responses. The results indicated that TPC (R1), TFC (R2) and TPAC (R3) were significantly influenced
33
at (p < 0.05) by temperature (A) and all quadratic terms (A2, B2, C2) (Table 3, 4 and 5). Moreover,
34
interactions of AB and BC were significant (p ˂ 0.001) on TPC, while the three interactions of AB, AC
35
and BC were not significant (p > 0.05) on TFC and TPAC.
36
DPPH (R4) radical-scavenging capacity was not significantly influenced (p > 0.05) by all three
37
linear terms (A, B, C), while all interaction parameters (AB, AC, BC) and quadratic parameters (A2,
38
B2, D2) were significant on (R4) (Table 4). Extract yield was significantly affected at (p < 0.05) by linear
39
(B, C), interaction parameter (AB) and all quadratic (A2, B2, C2) parameters (Table 5). The inhibitory
40
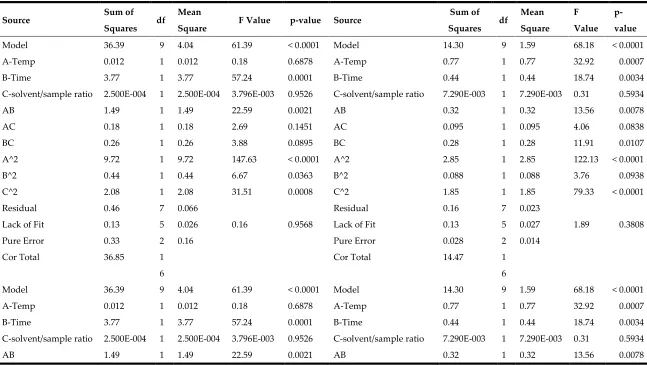
effect of BDPK extract on A549 cancer cells was highly significant influenced at (p < 0.001) by the
41
linear (B), interaction parameter (AB) and quadratic parameters (A2, B2, D2) (Table 6). Whereas the
42
inhibitory effect on HT29 cancer cells was influenced significantly at (p < 0.05) by linear parameters
43
(A and B). Additionally, two interactions of AB and BC were significant (p ˂ 0.01) on the viability of
44
HT29 cancer cells, while only two quadratic parameters (A2 and C2) had an effect (p < 0.0001) on the
45
same cells (Table 6).
59
60
Table 3. ANOVA results for responses R1 and R2 (TPC and TFC) in NEPP extract from BDPK.
61
Source Sum of
Squares Df
Mean
Square F Value p-value Source
Sum of
Squares df
Mean
Square
F
Value
p-value
Model 0.086 9 9.536E-003 67.08 < 0.0001 Model 0.64 9 0.071 48.81 <
0.0001
A-Temp 8.100E-004 1 8.100E-004 5.70 0.0484 A-Temp 9.000E-003 1 9.000E-003 6.14 0.0423
B-Time 9.000E-005 1 9.000E-005 0.63 0.4524 B-Time 2.890E-003 1 2.890E-003 1.97 0.2029
C-Solvent/Sample
ratio
6.400E-004 1 6.400E-004 4.50 0.0715
C-solvent/sample
ratio
1.440E-003 1 1.440E-003 0.98 0.3545
AB 0.011 1 0.011 79.13 < 0.0001 AB 8.000E-004 1 8.000E-004 0.55 0.4839
AC 2.000E-004 1 2.000E-004 1.41 0.2743 AC 1.250E-003 1 1.250E-003 0.85 0.3863
BC 0.018 1 0.018 126.96 < 0.0001 BC 6.050E-003 1 6.050E-003 4.13 0.0816
A^2 0.016 1 0.016 112.06 < 0.0001 A^2 0.25 1 0.25 171.33 <
0.0001
B^2 1.970E-003 1 1.970E-003 13.85 0.0074 B^2 0.014 1 0.014 9.23 0.0189
C^2 2.763E-003 1 2.763E-003 19.43 0.0031 C^2 0.012 1 0.012 7.98 0.0256
Residual 9.952E-004 7 1.422E-004 Residual 0.010 7 1.465E-003
Lack of Fit 3.952E-004 5 7.904E-005 0.26 0.9006 Lack of Fit 8.187E-003 5 1.637E-003 1.58 0.4303
Pure Error 6.000E-004 2 3.000E-004 Pure Error 2.067E-003 2 1.033E-003
Cor Total 0.087 16 Cor Total 0.65 16
R2= 0.9885, adj. R2= 0.9738 and pred. R2= 0.9592 (TPC) R2= 0.9843, adj. R2= 0.9641 and pred. R2= 0.9287 (TFC)adj., adjusted; pred., predicted; ANOVA,
62
Table 4. ANOVA results for response R3 and R4 (TPAC and DPPH) of NEPP extract.
64
65
Source Sum of
Squares df
Mean
Square F Value p-value Source
Sum of
Squares df
Mean
Square F Value
p-value
Model 5.42 9 0.60 31.61 < 0.0001 Model 391.96 9 43.55 50.70 <
0.0001
A-Temp 0.12 1 0.12 6.12 0.0426 A-Temp 1.09 1 1.09 1.27 0.2973
B-Time 1.690E-003 1 1.690E-003 0.089 0.7745 B-Time 1.000E-005 1 1.000E-005
1.164E-005
0.9974
C-solvent/sample
ratio
2.500E-004 1 2.500E-004 0.013 0.9120 C-solvent/sample
ratio
0.28 1 0.28 0.32 0.5866
AB 1.250E-005 1 1.250E-005
6.559E-004
0.9803 AB 20.70 1 20.70 24.10 0.0017
AC 7.813E-003 1 7.813E-003 0.41 0.5424 AC 15.43 1 15.43 17.96 0.0038
BC 0.011 1 0.011 0.55 0.4818 BC 19.63 1 19.63 22.85 0.0020
A^2 1.53 1 1.53 80.40 < 0.0001 A^2 128.52 1 128.52 149.62 <
0.0001
B^2 0.29 1 0.29 15.42 0.0057 B^2 11.16 1 11.16 12.99 0.0087
C^2 0.17 1 0.17 8.87 0.0206 C^2 5.11 1 5.11 5.95 0.0448
Residual 0.13 7 0.019 Residual 6.01 7 0.86
Lack of Fit 0.069 5 0.014 0.42 0.8108 Lack of Fit 5.32 5 1.06 3.05 0.2648
Pure Error 0.065 2 0.032 Pure Error 0.70 2 0.35
Cor Total 5.55 16 Cor Total 397.97 16
R2= 0.9760, adj. R2= 0.9451, pred. R2= 0.9222 (TPAC); R2= 0.9849, adj. R2= 0.9655, pred. R2= 0.9341 (DPPH)
66
adj., adjusted; pred., predicted; ANOVA, analysis of variance; TPAC, total proanthocyanidin content; DPPH, (2,2-diphenyl-2-picrylhydrazyl) radical scavenging activity; IC50,
67
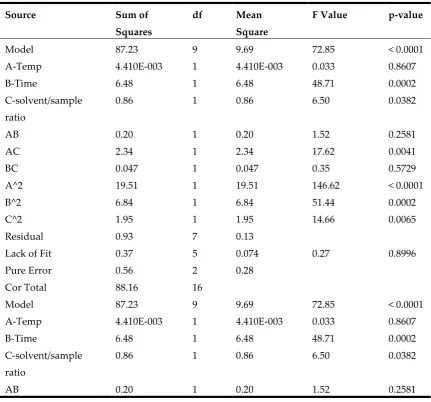
Table 5. ANOVA results for response R5 (YIELD) of NEPP extract.
Source Sum of
Squares
df Mean
Square
F Value p-value
Model 87.23 9 9.69 72.85 < 0.0001
A-Temp 4.410E-003 1 4.410E-003 0.033 0.8607
B-Time 6.48 1 6.48 48.71 0.0002
C-solvent/sample
ratio
0.86 1 0.86 6.50 0.0382
AB 0.20 1 0.20 1.52 0.2581
AC 2.34 1 2.34 17.62 0.0041
BC 0.047 1 0.047 0.35 0.5729
A^2 19.51 1 19.51 146.62 < 0.0001
B^2 6.84 1 6.84 51.44 0.0002
C^2 1.95 1 1.95 14.66 0.0065
Residual 0.93 7 0.13
Lack of Fit 0.37 5 0.074 0.27 0.8996
Pure Error 0.56 2 0.28
Cor Total 88.16 16
Model 87.23 9 9.69 72.85 < 0.0001
A-Temp 4.410E-003 1 4.410E-003 0.033 0.8607
B-Time 6.48 1 6.48 48.71 0.0002
C-solvent/sample
ratio
0.86 1 0.86 6.50 0.0382
AB 0.20 1 0.20 1.52 0.2581
R2= 0.9894, adj. R2= 0.9759and pred. R2= 0.9622.
Table 6. ANOVA results for response R6 and R7 (IC50 concentration of NEPP on A549 and HT29 cancer cells).
1
Source Sum of
Squares df
Mean
Square F Value p-value Source
Sum of Squares df
Mean Square
F Value
p-value
Model 36.39 9 4.04 61.39 < 0.0001 Model 14.30 9 1.59 68.18 < 0.0001
A-Temp 0.012 1 0.012 0.18 0.6878 A-Temp 0.77 1 0.77 32.92 0.0007
B-Time 3.77 1 3.77 57.24 0.0001 B-Time 0.44 1 0.44 18.74 0.0034
C-solvent/sample ratio 2.500E-004 1 2.500E-004 3.796E-003 0.9526 C-solvent/sample ratio 7.290E-003 1 7.290E-003 0.31 0.5934
AB 1.49 1 1.49 22.59 0.0021 AB 0.32 1 0.32 13.56 0.0078
AC 0.18 1 0.18 2.69 0.1451 AC 0.095 1 0.095 4.06 0.0838
BC 0.26 1 0.26 3.88 0.0895 BC 0.28 1 0.28 11.91 0.0107
A^2 9.72 1 9.72 147.63 < 0.0001 A^2 2.85 1 2.85 122.13 < 0.0001
B^2 0.44 1 0.44 6.67 0.0363 B^2 0.088 1 0.088 3.76 0.0938
C^2 2.08 1 2.08 31.51 0.0008 C^2 1.85 1 1.85 79.33 < 0.0001
Residual 0.46 7 0.066 Residual 0.16 7 0.023
Lack of Fit 0.13 5 0.026 0.16 0.9568 Lack of Fit 0.13 5 0.027 1.89 0.3808
Pure Error 0.33 2 0.16 Pure Error 0.028 2 0.014
Cor Total 36.85 1
6
Cor Total 14.47 1
6
Model 36.39 9 4.04 61.39 < 0.0001 Model 14.30 9 1.59 68.18 < 0.0001
A-Temp 0.012 1 0.012 0.18 0.6878 A-Temp 0.77 1 0.77 32.92 0.0007
B-Time 3.77 1 3.77 57.24 0.0001 B-Time 0.44 1 0.44 18.74 0.0034
C-solvent/sample ratio 2.500E-004 1 2.500E-004 3.796E-003 0.9526 C-solvent/sample ratio 7.290E-003 1 7.290E-003 0.31 0.5934
AB 1.49 1 1.49 22.59 0.0021 AB 0.32 1 0.32 13.56 0.0078
R2= 0.9875, adj. R2= 0.9714 pred. R2= 0.9560 (A549); R2= 0.9887, adj. R2= 0.9742 pred. R2= 0.9184 (HT29); adj., adjusted; pred., predicted; ANOVA, analysis
2
of variance; IC50, concentration of a substance/treatment required to inhibit cell growth by half (50%); NEPP, non-extractable polyphenols.
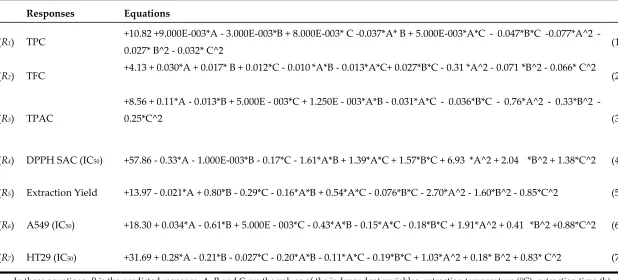
Table 7. Quadratic equations for the seven responses in terms of coded factors.
4
Responses Equations
(R1) TPC
+10.82 +9.000E-003*A - 3.000E-003*B + 8.000E-003* C -0.037*A* B + 5.000E-003*A*C - 0.047*B*C -0.077*A^2 -
0.027* B^2 - 0.032* C^2 (1)
(R2) TFC
+4.13 + 0.030*A + 0.017* B + 0.012*C - 0.010 *A*B - 0.013*A*C+ 0.027*B*C - 0.31 *A^2 - 0.071 *B^2 - 0.066* C^2 (2
(R3) TPAC
+8.56 + 0.11*A - 0.013*B + 5.000E - 003*C + 1.250E - 003*A*B - 0.031*A*C - 0.036*B*C - 0.76*A^2 - 0.33*B^2 -
0.25*C^2 (3)
(R4) DPPH SAC (IC50) +57.86 - 0.33*A - 1.000E-003*B - 0.17*C - 1.61*A*B + 1.39*A*C + 1.57*B*C + 6.93 *A^2 + 2.04 *B^2 + 1.38*C^2 (4)
(R5) Extraction Yield +13.97 - 0.021*A + 0.80*B - 0.29*C - 0.16*A*B + 0.54*A*C - 0.076*B*C - 2.70*A^2 - 1.60*B^2 - 0.85*C^2 (5)
(R6) A549 (IC50) +18.30 + 0.034*A - 0.61*B + 5.000E - 003*C - 0.43*A*B - 0.15*A*C - 0.18*B*C + 1.91*A^2 + 0.41 *B^2 +0.88*C^2 (6)
(R7) HT29 (IC50) +31.69 + 0.28*A - 0.21*B - 0.027*C - 0.20*A*B - 0.11*A*C - 0.19*B*C + 1.03*A^2 + 0.18* B^2 + 0.83* C^2 (7)
In these equations, R is the predicted response, A, B and C are the values of the independent variables, extraction temperature (°C), extraction time (h)
5
3.3. Optimisation by RSM
RSM plays a key role in efficiently identification of the optimum values of the independent variables. Three-dimensional response surface plots were proposed to depict the individual or interactive effects of these three selective parameters on the response variables, namely; extraction yield of NEPP (TPC, TFC, TPAC), crude extract yield, and its DPPH radical scavenging activity and its antiproliferative effect on two human cancer cells; A549 and HT29, respectively (Figure 4, 5, 6, 7, 8, 9, 10).
In the response surface plot and contour plot, the extraction yield of NEPP was obtained along with two continuous independent variables with their coded terms obtained from RSM, while the other independent variable was fixed constant at its zero level (the centre value of the test ranges). The centre value of the test ranges, namely; (3h, extraction time), (20:1 mL/g, solvent-to-sample ratio), (85°C, extraction temperature), and were chosen from previous single-factor experiments, and were selected for the RSM experiment.
To determine the optimum extraction conditions for NEPP; TPC, TFC, TPAC; percentage yield of crude extract; antioxidant and cytotoxic recovery from BDPK using acid hydrolysis method, the extraction process was conducted at different extraction time, temperature, and liquid/ solid ratio. The response surface plots predicting the specific surface area of NEPP extraction by the acid hydrolysis versus levels of the independent variables are presented in Table 2. The effect of investigated extraction parameters on each evaluated response was expressed as significant (p < 0.05) or insignificant (p > 0.05) according to P values for the regression coefficients in the quadratic model (Table 3, 4, 5, 6).
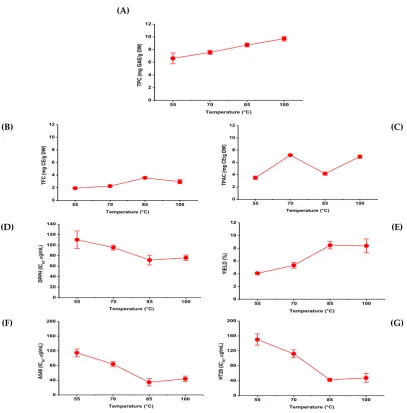
3.3.1. Response Surface Analysis of Total Phenolic Content
The analysis variance of total phenolic content (TPC) is noticed to be significantly (p < 0.05) affected by the linear and quadratic effects of the extraction temperature. It was found that the linear term of extraction temperature had a positive linear effect on TPC while showing a negative quadratic effect, contributing to a saddled shape. TPC increased when temperature increased to reach an optimum of 87˚C. the beneficial effect of temperature on the extraction efficiency of phenolic compounds was reported in many studies [49,55,56]. It ameliorates the mass transfer, weakens the cell wall integrity, hydrolyses the bonds of bound phenolic compounds (phenol-protein or phenol polysaccharide), improves the solubilisation of the solutes in the solvent and reduces the surface tension and viscosity, thus more phenolics would distribute to the solvent [57,58].
Nevertheless, and beyond a certain value, some antioxidants like some phenolic compounds can be denatured by chemical reactions [59]. This limit temperature is different amongst extraction studies; it is 73.9°C˚ for some [26] or up to 63 °C [60], and 94 °C for others [55]. Regarding the duration of the extraction process, short [61,62] and long extraction periods can be proposed in the literature [26,63]. The present study showed a negative quadratic effect of time on the TPC as shown in Table 7, equation (1), which indicates that TPC increased with increasing extraction time to a certain level (approximately 2.7 h). However, further increase in extraction time shows decrease in TPC. The obtained results in this study were contrary to that obtained by El Hajj, et al. [64] who found that the extraction of total phenolics from cabernet sauvignon grapes (Vitisvinifera L.) increased with the increase of time. This contradiction is probably due to the working high temperatures employed in this study, which required short periods of time to avoid the possible polyphenols degradation.
sample/solvent ratio was not significant (p > 0.05) indicating that temperature worked independently of the sample/solvent ratio (Table 3 and Figure 4B).
3.3.2. Response Surface Analysis of Total Flavonoid and Proanthocyanidin Contents
Flavonoids and proanthocyanidins are the most abundant polyphenols in human diets. Experimental results of TFC and TPAC in Barhi date palm kernels extracts are presented in Table 2. TFC was between 3.62±0.22 mg catechin (CE) per g dry weight (DW), obtained with 70°C temperature, 2 h time and 25:1 (mL/g) solvent/sample ratio, and 4.18±0.05 mg CE per g DW, obtained with 85°C, 3 h and 20:1 mL/g sample/solvent ratio.
A
B
C
Figure 4. Response surface plots and contour plots for the effect of temperature and time (A); temperature and solvent/sample ratio (B); time and solvent/sample ratio (C) on the non-extractable total phenolic content (TPC, mg GAE/g DW) of BDPK.
Lower TPAC yields (7.11±0.4 mg CE per g DW) were obtained using 70°C, 2 h and 15:1 mL/g, while the highest TPAC yields (8.78±0.66 mg CE per g DW) were obtained with 85°C, 3 h and 20:1 mL/g sample/solvent ratio as was the case with TFC (Table 2).
There was a good correlation (r =0.748) and (r =0.807) respectively, observed between experimentally obtained TFC and TPC, and strong correlation (r =0.972) observed between TFC and TPAC suggesting that similar extraction parameters provide good extraction of both groups of compounds (Table 8). Moreover, the good negative correlation was observed between TPC, TFC, TPAC and (IC50) of DPPH radical scavenging activity (0.735, 0.874, 0.907, respectively), which means
Des ign-Expert® Software
TPC
Des ign Points 10.83
10.59
X1 = A: Tem p X2 = B: Tim e
Actual Factor
C: Sam ple/s olvent ratio = 20.00
70.00 77.50 85.00 92.50 100.00
2.00 2.50 3.00 3.50
4.00 TPC
X1: A: Temp X2: B: Time 10. 6925 10. 7172 10. 7172 10. 7419 10. 7419 10. 7666 10. 7666 10. 7913 10. 8156 10. 816 10. 8153 10. 8139 3 3 3 Design-Expert® Software TPC 10.83 10.59
X1 = A: Temp X2 = B: Time
Actual Factor C: Sample/solvent ratio = 20.00
70.00 77.50 85.00 92.50 100.00 2.00 2.50 3.00 3.50 4.00 10.66 10.7025 10.745 10.7875 10.83 T P C A: Temp B: Time
Des ign-Expert® Software
TPC
Des ign Points 10.83
10.59
X1 = A: Tem p
X2 = C: Sam ple/s olvent ratio
Actual Factor B: Tim e = 3.00
70.00 77.50 85.00 92.50 100.00
15.00 17.50 20.00 22.50
25.00 TPC
X1: A: Temp X2: C: ratio 10. 7172 10. 7172 10. 7419 10. 7419 10. 7666 10. 7666 10. 7913 10. 8156 10. 816 10. 816 10. 8153 10. 8139 10. 8086 3 3 3 Design-Expert® Software TPC 10.83 10.59
X1 = A: Temp X2 = C: Sample/solvent ratio
Actual Factor B: Time = 3.00
70.00 77.50 85.00 92.50 100.00 15.00 17.50 20.00 22.50 25.00 10.69 10.725 10.76 10.795 10.83 T P C A: Temp C: ratio
Des ign-Expert® Software
TPC
Des ign Points 10.83
10.59
X1 = B: Tim e
X2 = C: Sam ple/s olvent ratio
Actual Factor A: Tem p = 85.00
2.00 2.50 3.00 3.50 4.00
15.00 17.50 20.00 22.50
25.00 TPC
X1: B: Time X2: C: ratio 10. 7172 10. 7419 10. 7419 10. 7666 10. 7666 10. 7913 10. 7913 10. 8156 10. 816 10. 816 10. 8153 10. 8139 10. 8086 10. 818 10. 8179 10. 8174 3 3 3
Des ign-Expert® Software
TPC
10.83
10.59
X1 = B: Time X2 = C: Sample/s olvent ratio
Actual Factor A: Temp = 85.00
that IC50 decrease, i.e. antioxidant activity increases, with increasing TPC, TFC and TPAC. This suggests that NEPP play an important role in the antioxidant activity of BDPK.
It can be seen that only the linear term of extraction temperature and the quadratic terms of extraction temperature, time and sample/solvent ratio had a significant influence (p < 0.05) on TFC, while all other effects were insignificant (p > 0.05). The same situation was observed for TPAC extractions, as confirmed by a strong correlation (r = 0.972) (Table 8).
Table 8. Correlation coefficients between the antioxidant and cytotoxicity capacity of NEPP extract from BDPK and the total content of phenolic, flavonoid, proanthocyanidin, and extract yield.
Factor Responses
TPC TFC TPAC DPPH YIELD A549 (IC50,
µg/mL)
HT29 (IC50,
µg/mL) TPC 1.000 0.748* 0.807*** -0.735* 0.752* -0.594* -0.585*
TFC 1.000 0.972*** -0.874*** 0.901*** -0.902*** -0.866***
TPAC 1.000 -0.907*** 0.903*** -0.874*** -0.842***
DPPH 1.000 -0.816*** 0.964*** 0.789***
YIELD 1.000 -0.933*** -0.888***
A549 1.000 ̶
HT29 1.000
TPC, , total phenolic content; TFC, total flavonoid content; TPAC, total proanthocyanidin content;
DPPH, (2,2-diphenyl-2-picrylhydrazyl) radical scavenging activity; IC50, concentration of a
substance/antioxidant required to inhibit DPPH radical by half (50%); NEPP, non-extractable polyphenols. *p < 0.01, ***p < 0.0001.
The linear term of extraction temperature exhibited a positive effect on TFC and TPAC, which means that high temperature, is necessary for complete flavonoid and proanthocyanidin extractions (Figure 5, 6).The negative effect of the quadratic terms of temperature, time and solvent/sample ratio suggested that TFC and TPAC reaches a maximum near lower level of extraction parameters and then starts to decrease rapidly with more heating, prolonged time, increasing solvent ratio with a saddle point between lower and middle levels of these parameters.
3.3.3. Response Surface Analysis of Crude Extract Yield
The results in this study are similar to another study performed on grape by-products, and showed that the total phenolics from grape by-products increased with the increment of temperature and reduction of time [55]. In the current study, the interaction between the extraction time and extraction temperature had a highly significant (p < 0.0001) effect on TPC (Figure 4A). In other terms, extraction temperature influenced TPC synergistically with the extraction time. Similarly, there was an interaction between extraction time and sample/solvent ratio (p < 0.0001), which indicates that there was a synergistic interaction between extraction time and sample/solvent ratio on the yield of TPC (Figure 4C). However, the interaction between extraction temperature and sample/solvent ratio was not significant (p > 0.05) indicating that temperature worked independently of the sample/solvent ratio (Table 3 and Figure 4B).
The crude extract (NEPP) was weighted to determine the crude extract yield. The extraction yield (%, w/w) from each condition was estimated by the ratio of the weight of dry matter of BDPK after being extracted by acid hydrolysis to the weight of total dry matters before extraction.
the yield was described in equation 5, Table 7. Based on the ANOVA test, the most significant factor (p < 0.001, F = 48.71) affecting the obtained yield was the positive effect of time in its linear term (Table 7, equation 5). It is concluded that longer extraction time had positive effects on the yield of extraction. There were also significant (p < 0.01) positive interaction effects of extraction time and solvent to sample ratio (equation 5, Table 7), indicating that yield extraction increases considerably with an increase in a solvent to sample ratio and extraction time (Figure 7B). Table 7 and equation 5, demonstrated negative quadratic effects of temperature, time and solvent to sample ratio on extract yield.
A
B
C
Figure 5. Response surface plots and contour plots for the effect of temperature and time (A); temperature and solvent/sample ratio (B); time and solvent/sample ratio (C) on the non-extractable total flavonoid content (TFC, mg CE/g DW) of BDPK.
Des ign-Expert® Software
TFC
Des ign Points 4.18
3.62
X1 = A: Tem p X2 = B: Tim e
Actual Factor
C: Sam ple/s olvent ratio = 20.00
70.00 77.50 85.00 92.50 100.00
2.00 2.50 3.00 3.50
4.00 TFC
X1: A: Temp X2: B: Time 3.76626 3.8389 3.8389 3.91153 3.91153 3.98416 3.98416 4.05679 4.12889 4.12762 4.12596 4.1175 3 3 3 Design-Expert® Software TFC 4.18 3.62
X1 = A: Temp X2 = B: Time
Actual Factor C: Sample/solvent ratio = 20.00
70.00 77.50 85.00 92.50 100.00 2.00 2.50 3.00 3.50 4.00 3.69 3.8125 3.935 4.0575 4.18 T F C A: Temp B: Time
Des ign-Expert® Software
TFC
Des ign Points 4.18
3.62
X1 = A: Tem p
X2 = C: Sam ple/s olvent ratio
Actual Factor B: Tim e = 3.00
70.00 77.50 85.00 92.50 100.00
15.00 17.50 20.00 22.50
25.00 TFC
X1: A: Temp X2: C: ratio 3.76626 3.8389 3.8389 3.91153 3.91153 3.98416 3.98416 4.05679 4.12889 4.12762 4.12596 4.1175 4.10348 3 3 3 Design-Expert® Software TFC 4.18 3.62
X1 = A: Temp X2 = C: Sample/solvent ratio
Actual Factor B: Time = 3.00
70.00 77.50 85.00 92.50 100.00 15.00 17.50 20.00 22.50 25.00 3.7 3.82 3.94 4.06 4.18 T F C A: Temp C: ratio
Des ign-Expert® Software
TFC
Des ign Points 4.18
3.62
X1 = B: Tim e
X2 = C: Sam ple/s olvent ratio
Actual Factor A: Tem p = 85.00
2.00 2.50 3.00 3.50 4.00
15.00 17.50 20.00 22.50
25.00 TFC
X1: B: Time X2: C: ratio
3.98416 4.05679 4.12889 4.12762 4.12596 4.1175 4.10348 3 3 3 Design-Expert® Software TFC 4.18 3.62 X1 = B: Time X2 = C: Sample/solvent ratio
Actual Factor A: Temp = 85.00
A
B
C
Figure 6. Response surface plots and contour plots for the effect of temperature and time (A); temperature and solvent/sample ratio (B); time and solvent/sample ratio (C) on the non-extractable total proanthocyanidin content (TPAC, mg CE/g DW) of BDPK.
Des ign-Expert® Software
TPAC
Des ign Points 8.78
7.11
X1 = A: Tem p X2 = B: Tim e
Actual Factor
C: s olvent/s am ple ratio = 20.00
70.00 77.50 85.00 92.50 100.00
2.00 2.50 3.00 3.50
4.00 TPAC
X1: A: Temp X2: B: Time 7.55466 7.55466 7.75685 7.75685 7.75685 7.95905 7.95905 8.16124 8.16124 8.36343 8.56541 8.56478 8.55663 8.54403 3 3 3 Design-Expert® Software TPAC 8.78 7.11
X1 = A: Temp X2 = B: Time
Actual Factor C: solvent/sample ratio = 20.00
70.00 77.50 85.00 92.50 100.00 2.00 2.50 3.00 3.50 4.00 7.3 7.675 8.05 8.425 8.8 T P A C A: Temp B: Time
Des ign-Expert® Software
TPAC
Des ign Points 8.78
7.11
X1 = A: Tem p
X2 = C: s olvent/s am ple ratio
Actual Factor B: Tim e = 3.00
70.00 77.50 85.00 92.50 100.00
15.00 17.50 20.00 22.50
25.00 TPAC
X1: A: Temp X2: C: solvent/sample ratio 7.75685 7.95905 7.95905 8.16124 8.16124 8.36343 8.56541 8.55663 8.54403 3 3 3 Design-Expert® Software TPAC 8.78 7.11 X1 = A: Temp X2 = C: solvent/sample ratio
Actual Factor B: Time = 3.00
70.00 77.50 85.00 92.50 100.00 15.00 17.50 20.00 22.50 25.00 7.4 7.75 8.1 8.45 8.8 T P A C A: Temp C: solvent/sample ratio
Des ign-Expert® Software
TPAC
Des ign Points 8.78
7.11
X1 = B: Tim e
X2 = C: s olvent/s am ple ratio
Actual Factor A: Tem p = 85.00
2.00 2.50 3.00 3.50 4.00
15.00 17.50 20.00 22.50
25.00 TPAC
X1: B: Time X2: C: solvent/sample ratio 8.16124 8.16124 8.16124 8.16124 8.36343 8.55663 8.54403
8.56163333
Design-Expert® Software
TPAC
8.78
7.11 X1 = B: Time X2 = C: solvent/sample ratio
Actual Factor A: Temp = 85.00
Figure 7. Response surface plots and contour plots for the effect of temperature and time (A); temperature and solvent/sample ratio (B); time and solvent/sample ratio (C) on the non-extractable polyphenols crude extract (%) of BDPK.
3.3.4. Response Surface Analysis of DPPH Radical Scavenging Activity
Current research on dietary antioxidants misses the so-called non-extractable polyphenols (NEPP), which are not significantly released from the food matrix either by mastication, acid pH in the stomach or action of digestive enzymes, reaching the colon nearly intact. NEPP, not detected by the usual analytical procedures, are made up of macromolecules and single phenolic compounds associated with macromolecules. Therefore, NEPP is not included in food and dietary intake data nor in bioavailability, intervention or observational studies. DPPH radical scavenging capacity of BDPK’s NEPP extracts was evaluated by DPPH assay, which is widely used in evaluating the antioxidant activity of plant polyphenols in-vitro [65]. IC50, as a reciprocal measure of DPPH radicals scavenging capacity of BDPK extracts, ranged between 58.12±3.32 and 70.5±9.66 µg/mL. The lowest IC50, i.e. highest DPPH radical scavenging capacity of NEPP, was found to be a function of the positive quadratic effect (p < 0.05) of all independent variables (temperature, time, solvent/sample
A
B
C
Des ign-Expert® Software
Yield
Des ign Points 14.2
7.13
X1 = A: Tem p X2 = B: Tim e
Actual Factor
C: Sam ple/s olvent ratio = 20.00
70.00 77.50 85.00 92.50 100.00
2.00 2.50 3.00 3.50
4.00 Yield (%)
X1: A: Temp X2: B: Time 9.62129 9.62129 10.5114 10.5114 11.4015 11.4015 11.4015 12.2916 13.1817 14.0619 14.0299 13.9308333
Design-Expert® Software
Yield
14.2
7.13 X1 = A: Temp X2 = B: Time
Actual Factor C: Sample/solvent ratio = 20.00
70.00 77.50 85.00 92.50 100.00 2.00 2.50 3.00 3.50 4.00 8.7 10.075 11.45 12.825 14.2 Y ie ld ( % ) A: Temp B: Time
Des ign-Expert® Software
Yield
Des ign Points 14.2
7.13
X1 = A: Tem p
X2 = C: Sam ple/s olvent ratio
Actual Factor B: Tim e = 3.00
70.00 77.50 85.00 92.50 100.00
15.00 17.50 20.00 22.50
25.00 Yield (%)
X1: A: Temp X2: C: ratio 10.5114 11.4015 11.4015 12.2916 12.2916 13.1817 13.9308 13.9871 13.9716 13.7688 3 3 3 Design-Expert® Software Yield 14.2 7.13 X1 = A: Temp X2 = C: Sample/solvent ratio
Actual Factor B: Time = 3.00
70.00 77.50 85.00 92.50 100.00 15.00 17.50 20.00 22.50 25.00 9.6 10.75 11.9 13.05 14.2 Y ie ld ( % ) A: Temp C: ratio
Des ign-Expert® Software
Yield
Des ign Points 27.5
1.5
X1 = B: Tim e
X2 = C: Sam ple/s olvent ratio
Actual Factor A: Tem p = 85.00
2.00 2.50 3.00 3.50 4.00
15.00 17.50 20.00 22.50
25.00 Yield (%)
X1: B: Time X2: C: ratio 15.5803 18.488 18.488 21.3957 21.3957 24.3033 27.2081 27.1698 27.062 26.7713 25.904526.6422 26.6815 26.5775 27.2803 3 3 3 Design-Expert® Software Yield 14.2 7.13 X1 = B: Time X2 = C: Sample/solvent ratio
Actual Factor A: Temp = 85.00