© 2006 by the Arizona Board of Regents on behalf of the University of Arizona LSC 2005, Advances in Liquid Scintillation Spectrometry
Edited by Stanis≥aw Cha≥upnik, Franz Schönhofer, John Noakes. Pages 417–422.
Ivo SvÏtlík1,2 • Petr Rulik3 • Václav Michálek3 • LenkaTomášková1 • Ji¯í Mizera1
ABSTRACT. At present, the most significant artificial sources of radiocarbon in the environment are effluents from nuclear energy facilities, even though they represent a minor contribution in comparison with the natural production of 14C.
Never-theless, 14C is a major contributor to the collective effective dose from all radionuclides released by nuclear power plants
(NPP) with light-water pressurized reactors (LWPR) during normal operation. This paper aims to develop a 14C determination
method for grab samples from NPPs’ stack air. This method enables separate determination of 14CO
2 and 14C in combustible
compounds. Treated samples are counted by LSC with an indication of interferences. Our results of 14C activity
concentra-tions in stack air grab samples are compared with results of 14C determinations performed by the NPP’s laboratory, which
uti-lizes monthly/weekly accumulated samples.
INTRODUCTION
Currently, the most significant artificial sources of radiocarbon in the environment are effluents from nuclear energy facilities, even though they represent a minor contribution in comparison with natural 14C production. Nevertheless, 14C is a major contributor to the collective effective dose from
all radionuclides released by nuclear power plants (NPP) with light-water pressurized reactors (LWPR) during normal operation (UNSCEAR 2000), as reported in Table 1 for 1990–1994. The Czech Republic has 2 LWPR-equipped NPPs, Temelin and Dukovany, with installed power outputs of 2 × 1000 MW and 4 × 440 MW, respectively.
14C from the NPP’s gas outlet can be captured from the surroundings or dissipated in the
atmo-sphere, depending on the form of 14C. The most stable chemical forms are hydrocarbons with
pre-vailing 14CH
4 (Kunz 1985), which is not significantly captured in the NPP vicinity and contributes
to the increase of the 14C activity level on a regional and/or global scale (Eisma et al. 1995). The
1Department of Radiation Dosimetry, Nuclear Physics Institute AS CR, Na Truhlá¯ce 39/64, 180 86 Prague, Czech Republic. 2Corresponding author. Email: [email protected].
3National Radiation Protection Institute, Šrobárova 48, 10000 Prague, Czech Republic.
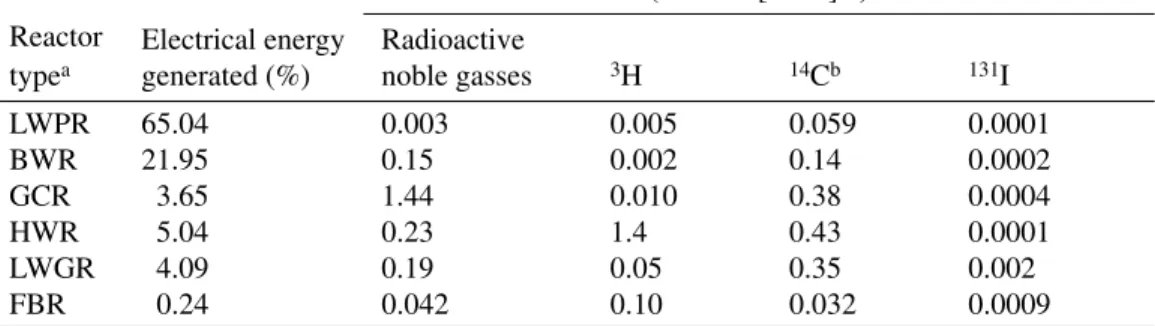
Table 1 Normalized collective effective dose from radionuclides released from nuclear reactors, 1990–1994, airborne effluents (UNSCEAR 2000).
Collective effective dose per unit of electrical energy generated (man Sv [GWa]–1)
Reactor typea
aLWPR – light-water pressurized reactor; BWR – boiling water reactor; GCR – gas-cooled reactor; HWR – heavy-water
reactor; LWGR – light-water, graphite-moderated reactor; FBR – fast breeder reactor.
Electrical energy generated (%)
Radioactive
noble gasses 3H 14Cb
bLocal and regional components only.
131I LWPR 65.04 0.003 0.005 0.059 0.0001 BWR 21.95 0.15 0.002 0.14 0.0002 GCR 3.65 1.44 0.010 0.38 0.0004 HWR 5.04 0.23 1.4 0.43 0.0001 LWGR 4.09 0.19 0.05 0.35 0.002 FBR 0.24 0.042 0.10 0.032 0.0009
biota in the vicinity of NPPs takes in 14CO
2 especially during calm weather, rainfall, haze, or
atmo-spheric inversion. 14C in the form of CO
2 is assimilated by plant photosynthesis and then transferred
into the food chain. The abundance of 14CO
2 in airborne effluents from LWPRs varies between 5 and
43% (Kunz 1985; Uchrin et al. 1992; EPRI 1995; Smith et al. 2002; Pintér and Molnár 1997; Molnár et al. 2005).
This paper aims to develop a method of 14C determination for NPPs’ stack air in order to determine
an independent grab sample control. Experiments connected with the method development started in 2001. In the following years, grab sampling was performed at Czech NPPs. This method enables us to distinguish between 14CO
2 and 14C in combustible compounds, similar to the continual
sam-pling routines in NPPs. SAMPLING
Grab samplings were performed in the Temelin NPP for both reactors, HVB1 and HVB2. For HVB1, 2 samplings were done in 2002, 4 in 2003, and 3 in 2004; sampling for HVB2 started in 2004 (4 samplings). Stack air samples were collected into high-pressure stainless bombs (~200 atm). The apparent sampling time did not exceed 30 min.
SAMPLE TREATMENT
All samples were stored for at least 1 month to reduce the activity of short-lived radionuclides. In the laboratory, a gas sample was transferred into a low-pressure gas storage bag equipped with 2 inlet/ outlet tubings on opposite sides. The gas was passed through a gas-meter and traps with humidifying and washing solution (1% H3PO4), sorption solution (3M NaOH), and a condensation flask with 1%
H3PO4 cooled solution (+5 °C), to avoid water vapor condensation in other parts of the system.
When a sample was transferred into a low-pressure bag, a cycling pump was connected between the condensation flask and the gas storage input. The gas then flowed from the bag’s output into the gas-meter input. The pressure inside the gas-gas-meter and flasks was lower than the atmospheric pressure, to avoid leaking of the gas sample. The total volume cycled corresponds to 13 volumes of a gas sam-ple processed to reach a sufficiently high yield (above 98%) of CO2 sorption in the NaOH solution.
According to the sorption yield experiments, testing a single sample passage through a trap with NaOH (i.e. 1 sorption cycle), the yield was 33–36%, depending on the gas flow rate. Thus, long-term cycling allows us to achieve a high yield with negligible 14CO
2 residue in the gas. To determine 14C in combustible compounds, a catalyst (CuO, heated to 700 °C) in a quartz tube was inserted
between the cycling bag output and the gas-meter input.
The solution with the 14C sample was sequentially stripped by nitrogen (5.0 purity) to remove the
residual radioactive noble gasses. After sample processing, the low-pressure gas storage bag was depleted and twice flushed out with nitrogen.
Consequently, from the sample solution (apparent mass ~50 g) 8 g were repeatedly recovered into a 20-mL glass vial to prepare duplicate samples for measurement. The pH in the vials was gently reduced by diluted H2SO4 dosed from a capillary tube onto the bottom while stirring, to avoid
sur-face acidification resulting in CO2 escape. To minimize chemiluminescence interferences, the final
pH value was adjusted to 9.3, indicated by thymolftalein (solution color changed from blue to col-orless). A background sample was prepared from 3M NaOH using the same routine after fossil CO2
addition. Finally, 5 g of the sample solution was mixed with 15 mL of Hionic-Fluor (PerkinElmer, USA) scintillation cocktail in a 20-mL low-potassium glass vial. The yield of the sample treatment
was determined at random by the standard addition of a 14C-labeled sodium carbonate solution into
a fraction of the sample solution subsequently processed by the routine described above.
To check the accuracy of the routine, barium carbonate was precipitated from a fraction of randomly selected samples. After the addition of a sodium carbonate carrier with a small controlled amount of
14C, the precipitate was washed and dried, and 1 g was treated in an ultrasound bath with 7 mL of
water. The yield from precipitation and washing was 97%. Finally, the carbonate sample was homogenized with 12 mL of an InstaGel (Packard Instrument Co., USA) cocktail.
SAMPLE MEASUREMENT
All samples including blanks and standards were counted for 60 min by a Tri-Carb 1050 or 3170 TR/SL in normal mode. Measurement of each sample series was repeated in 2-week intervals, 3 times at minimum. For carbonate solution counting, a counting window derived from the optimized one was utilized, with the lower edge above the maximum energy of tritium beta emission. Counting efficiency was determined individually, usually by standard addition (0.05 g of carbonate solution spiked with a known activity of 14C) into the sample after the third counting.
After each measurement, the spectra were checked in the region above the maximum energy of 14C
beta emission. Resulting count rates in parallel samples were compared; if a significant discrepancy was observed, a new sample solution treatment for LSC was performed. Such a case happened only 3 times during the entire experimental campaign. After the third measurement, count rates from each sample measurement with their combined uncertainties were compared. Significant differences in the results obtained could indicate the presence of interfering radionuclides with shorter half-lives and/or the instability of the sample scintillation mixture.
Precipitate samples were measured for 60 min in a full 14C counting window (channels 1–90), and
quenching corrections depending on the tSIE parameter were consequently performed.
In 2001, the laboratory was equipped with a Tri-Carb 1050; hence, the experimental results in Table 2 relate to this instrument. Later measurements of barium precipitate were performed on a Tri-Carb 3170 TR/LL purchased in 2004. For yield tracing and calibration (14C-labeled sodium
carbon-ate solution), radioactive standards were utilized of type ER 25, produced by the Czech Metrology Institute-Inspectorate for Ionizing Radiation, Prague.
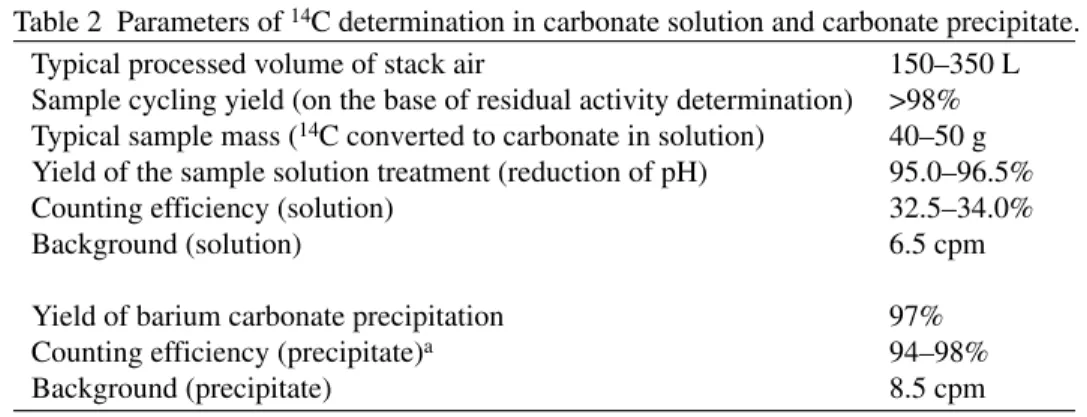
Table 2 Parameters of 14C determination in carbonate solution and carbonate precipitate.
Typical processed volume of stack air 150–350 L
Sample cycling yield (on the base of residual activity determination) >98% Typical sample mass (14C converted to carbonate in solution) 40–50 g
Yield of the sample solution treatment (reduction of pH) 95.0–96.5%
Counting efficiency (solution) 32.5–34.0%
Background (solution) 6.5 cpm
Yield of barium carbonate precipitation 97%
Counting efficiency (precipitate)a
aWithin the range of tSIE values 200–175.
94–98%
RESULTS
Figure 1 illustrates results of the grab sampling of stack air from the reactor HVB1 in NPP Temelin, and its comparison with data from the continual sampling performed by the NPP’s laboratory.
Table 3 presents 14C activities determined in grab samples using both carbonate solution processing
and carbonate precipitation procedures. Activities of total 14C (Σ) were calculated from the
determi-nation of 14C in combustible compounds and 14CO 2.
Results obtained by both methods agree well within the uncertainty margins. The relatively greater uncertainties associated with the carbonate precipitation method are due to only a minor part of the precipitate being measured during carbonate processing.
The average activities were calculated from data from the NPP Temelin laboratory (i.e. continual sampling data of total 14C and 14CO
2 for HVB1 and HVB2). The abundance of 14CO2 was calculated
from the averages. Data presented in Table 4 allow a comparison of the grab sampling with the
aver-Figure 1 A comparison of 14C activities (Bq/m3) determined in stack air from continual and grab sampling in NPP
Temelin, reactor HVB1.
Table 3 A comparison of 14C activities determined in HVB1 samples, Bq/m3. Reported
combined uncertainties correspond to ~68% probability.
Carbonate solution Carbonate precipitate
Sampling date Σ 14C 14CO2 Σ 14C 14CO2 4.II.2004 78.5 ± 3.7 56.9 ± 1.8 82.2 ± 5.0 52.6 ± 3.4 8.IX.2004 181.7 ± 4.7 2.7 ± 0.8 174.2 ± 8.9 3.6 ± 1.1 12.XII.2004 172.1 ± 4.3 7.1 ± 1.4 172.0 ± 7.3 5.5 ± 1.2 0 1 10 100 1000 10000
IV.01 XI.01 V.02 XII.02 VI.03 I.04 VIII.04 II.05
C-14 Bq.
m
-3
continual sampling (total 14C) continual sampling (14CO2)
age values for continual sampling in HVB1 and HVB2 from May 2002 to December 2004 and Feb-ruary to December 2004, respectively. The grab sampling averages were calculated from the values determined by the carbonate solution counting. Combined uncertainties of determination did not exceed 15% for activities above 10 Bq/m3.
Short-time pulses of 14C activity may have been the reason for the higher average activity found in
the grab samples from HVB1 (see Figure 1). Such a pulse was observed on 12.XII.2003, and could be connected with some routines of servicing operation. At that time, the stack air was sampled twice, in 1-hr intervals. The observed activity of 14C combustible compounds decreased from 1482
to 520 Bq/m3 during 1 hr, without a sharp change of 14CO
2 activity (from 22.1 to 15.6 Bq/m3).
Con-tinual sample cumulating1, performed by the NPP, includes these short-lived 14C pulses. During the
grab sampling, there is only a small probability for short-lived pulse detection, as is made obvious by the average activities in HVB1 after discarding the outlying values (72% of total 14C, 82% of 14CO
2). The average total 14C activity in HVB2 (but only from 4 results) can probably confirm this
effect as well (64% of total 14C). However, the observed average activity of 14CO
2 is closer to the
continual sampling results from HVB2. The percentage of 14CO
2 activity, calculated from the grab sampling averages, exceeds that
mea-sured by the continual monitoring in HVB1 and HVB2 by 0.5% and 1.2%, respectively. Results obtained in the grab sampling could also have been influenced by the high-pressure sampling and by procedures applied in the processing of relatively small grab samples. Nevertheless, the results from continual and independent grab sampling confirm a relatively small percentage (<5%) of 14CO
2 in
the airborne effluents from NPP Temelin. CONCLUSION
Several grab samplings of stack air from reactors HVB1 and HVB2 in NPP Temelin were per-formed. On the basis of 14C determination in combustible compounds and 14CO
2, average activities
determined in the grab sampling were below average values determined by continual monitoring during the relevant period. The maximum difference (36% of total 14C) was found in HVB2. After
discarding of outliers, the average values in HVB1 are below the continual sampling for total 14C
and 14CO
2 by 28% and 18%, respectively. These differences can be caused by short-lived pulses of 14C activity, as observed in samplings repeated with 1-hr intervals on 12.XII.2003.
Since the grab sampling results are affected by short-lived variations of 14C activity, the data from
the continual sampling are more representative for calculation of 14C releases. For the purpose of an
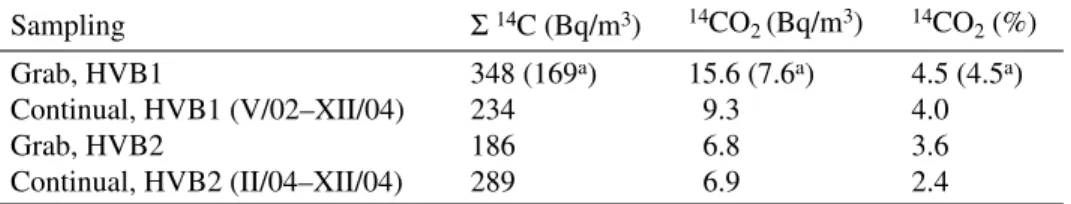
Table 4 Observed average activities in stack air grab samples from HVB1 and HVB2 compared with results of the continual sampling in the given time periods.
Sampling Σ 14C (Bq/m3) 14CO
2 (Bq/m3) 14CO2 (%)
Grab, HVB1 348 (169a)
aData reported in parentheses were calculated after discarding outlying values (couple): total 14C, twice sampled
12.XII.2003, 1-hr interval; 14CO 2, sampled 4.II.2004. 15.6 (7.6a) 4.5 (4.5a) Continual, HVB1 (V/02–XII/04) 234 9.3 4.0 Grab, HVB2 186 6.8 3.6 Continual, HVB2 (II/04–XII/04) 289 6.9 2.4
independent control of 14C amount in the airborne effluents, the grab sampling results can be utilized
for a comparison only as a basis for a greater number of samplings performed. Nevertheless, the resulting abundances of 14C in the CO
2 chemical form have been found to be close
to the results of the continual sampling. Part of the 14C in this form is captured by biota in the
sur-rounding environment and is consequently transferred into the food chain. Ingestion of 14C
repre-sents 99% of the collective effective dose from this radionuclide intake (UNSCEAR 2000). Regard-ing the released quantity of this radionuclide, the abundance of 14CO
2 can be validated without
additional data about the volume of stack air released. REFERENCES
Eisma R, Vermeulen AT, van der Borg K. 1995. 14CH 4
emissions from nuclear power plants in northwestern Europe. Radiocarbon 37(2):475–83.
EPRI [Electrical Power Research Institute]. 1995. Char-acterization of C-14 generated by the nuclear power industry. Report EPRI TR-105715. Palo Alto, Califor-nia, USA: EPRI.
Kunz C. 1985. Carbon-14 discharge at three light-water reactors. Health Physics 49:25–35.
Molnár M, Szántó Z, Svingor É, Palcsu L, Futo I, Elekes Z. 2005. Measurement of beta-emitters in the air around the Paks NPP, Hungary. In: Olariu A, Sten-ström K, Hellborg R, editors. Proceedings of the Inter-national Conference on Applications of High Preci-sion Atomic and Nuclear Methods. Neptun, Romania, 2–6 September 2002. p 32–8.
Pintér T, Molnár M. 1997. Radiocarbon in primary water, stack air and waste streams of Paks, Bohunice and
Krsko nuclear power plants. In: Proceedings of the 3rd International Seminar on Primary and Secondary Side Water Chemistry of Nuclear Power Plants. Paks, 16–20 September 1997.
Smith G, Merino J, Kerrigan E. 2002. Review of C-14 in-ventory for the SFR facility. 2002:14 report of the Swedish Radiation Protection Authority. URL: http:// www.ssi.se/ssi_rapporter/pdf/ssi_rapp_2002_14.pdf. Uchrin G, Hertelendi E, Volent G, Slavík O, Morávek J,
Kobal I, Vokal B. 1998. 14C measurements at
PWR-type nuclear power plants in three middle European countries. Radiocarbon 40(1):439–46.
UNSCEAR [United Nations Scientific Committee on the Effects of Atomic Radiation]. 2000. Exposures from man-made sources of radiation. Report 1, Annex C. 134 p. URL: http://www.unscear.org/docs/reports/an-nexc.pdf.