THE CENTRE FOR MARKET AND PUBLIC ORGANISATION The Centre for Market and Public Organisation (CMPO) is a leading research centre, combining expertise in economics, geography and law. Our objective is to study the intersection between the public and private sectors of the economy, and in particular to understand the right way to organise and deliver public services. The Centre aims to develop research, contribute to the public debate and inform policy-making.
CMPO, now an ESRC Research Centre was established in 1998 with two large grants from The Leverhulme Trust. In 2004 we were awarded ESRC Research Centre status, and CMPO now combines core funding from both the ESRC and the Trust.
Centre for Market and Public Organisation Bristol Institute of Public Affairs
University of Bristol 2 Priory Road Bristol BS8 1TX Tel: (0117) 33 10799 Fax: (0117) 33 10705 E-mail: [email protected]
Modelling the Impact of Pupil Mobility on
School Differences in Educational
Achievement
Harvey Goldstein, Simon Burgess and Brendon
McConnell
September 2006
Working Paper No. 06/156
CMPO Working Paper Series No. 06/156
CMPO is jointly funded by the Leverhulme Trust and the ESRC
Modelling the Impact of Pupil Mobility on School
Differences in Educational Achievement
Harvey Goldstein
1Simon Burgess
2and
Brendon McConnell
21
LSECentre for Multilevel Modelling, University of Bristol 2
CMPO, University of Bristol
September 2006
Abstract
The recently introduced National Pupil Database in England allows the tracking of every child through the compulsory phases of the state education system. The data from Key Stage 2 for three Local Education Authorities are studied, following cohorts of pupils through their schooling. The mobility of pupils among schools is studied in detail using multiple membership multilevel models that include prior achievement and other predictors and the results are compared with traditional ‘value added’ approaches that ignore pupil mobility. The analysis also includes a cross classification of junior and infant schools attended. The results suggest that some existing conclusions about schooling effects may need to be revised.
Keywords: Multilevel model, multiple membership model, mobility, value added, National Pupil database, educational attainment, cross classified model, random effects, school effectiveness
JEL Classification: I2
Acknowledgements
We are most grateful to Anna Barker and Catherine Blackham of the Department for Education and Skills for support and help with the datasets.
Address for Correspondence
CMPO, Bristol Institute of Public Affairs University of Bristol 2 Priory Road Bristol BS8 1TX [email protected] [email protected] www.bris.ac.uk/Depts/CMPO/
Introduction
Since the early 1980’s educational researchers have developed models for judging the comparative performance of schools and other institutions using what have come to be known as ‘value added’ techniques (see Goldstein et al, 1993 and Raudenbush and Bryk, 1989 for early discussions). Typical applications have compared the performance of pupils in public examinations or on the basis of routine test scores. In essence these models attempt to adjust simple comparisons of school mean values by using measures of pupil prior achievement and other variables in order to take account of selection and other procedures that are associated with pupil achievements but not related to any impact that the schools themselves may have upon achievement. Thus, a simple 2- level, variance component, model based on data from a random sample of schools can be written as follows where subscript i refers to the pupil, and j to the school:
2 2
0 1 ; ~ (0, ); ~ (0, )
ij ij j ij j u ij e
y =β +βx + +u e u N σ e N σ (1)
where yij, xij respectively are the response variable and prior achievement, and uj is an
underlying school effect (associated with school organisation, teaching, etc.) or residual. As is usual in models of this kind, we assume that eij and uj are uncorrelated and
uncorrelated with any explanatory variables – that is, we assume that any possible dependencies that may result from, for example, school selection mechanisms are accounted for. Posterior estimates ˆuj with associated confidence intervals are typically
used to rank schools in so called league tables or used as ‘screening devices’ in school improvement programmes (Goldstein et al., 2000).
Model (1) can be elaborated by introducing further covariates such as socio -economic background or peer group characteristics, in order to make additional adjustments and to investigate interactions. In addition, it is typically found that models such as (1) require random coefficients where, for example, the coefficient of prior achievement varies randomly across schools. In this case, using a more general notation, we have
0 1 0 0 0 1 1 1 2 0 2 0 2 1 01 1 ; ~ (0, ); ~ (0, ); ij ij j ij ij j ij j j u ij e u u u u y x u e u u e N N u β β β β β β σ σ σ σ = + = + + = + Ω Ω = (2)
These ‘multilevel’ models have also been extended to include further levels of hierarchy, such as education board or authority and random factors which are not contained within a simple hierarchy such as area of pupil residence or school attended during a previous phase of education. Such models are known as ‘cross classifications’. In the present paper we incorporate a cross classification for a previous phase of education, namely infant school attended when studying differences between junior schools. We also incorporate a ‘multiple membership’ structure to take account of the fact that many pupils change schools so that in terms of the ‘effect’ of school more than one school will contribute.
Goldstein (2003) gives full details of such models and their estimation. We also study the effects of further covariates measured on pupils and schools, including ‘compositional’ effects that are aggregates of student level variables such as whether or not a pupil is eligible for free school meals.
A major aim of our analyses is to see whether taking account of the cross classified and multiple membership nature of pupil achievement data substantially alters inferences about the importance of school effects, the coefficients associated with covariates and the relative values of the school effect estimates, ˆuj. Such analyses as we describe have only recently become possible with the release of the PLASC data, which we describe below. The importance of this work is related to the fact that the literature of the effects of schooling (see Goldstein, 2000 for a review) has largely ignored the existence of cross classifications and pupil mobility. In addition, educational policy in England and in certain other education systems, uses school effect estimates as part of a public accountability system, that also ignores these issues.
The next section describes the data set and variables used and is followed by the results of fitting a series of cross classified and multiple membership models.
The PLASC data set
In the following analysis, we use the National Pupil Database (NPD) that includes data from Key Stage tests and the Pupil Level Annual School Census (PLASC) dataset from the Department for Education and Skills (DfES). The database covers all pupils in state primary and secondary schools in England and can be linked to each pupil’s test score history. In addition, it contains a number of personal and school characteristics: ethnicity, gender, within-year age, mother tongue, an indicator of family poverty (eligibility for Free School Meals, FSM, which is dependent on receipt of some welfare benefits), and an indicator of Special Educational Needs. Three years of data have now been released: 2002, 2003, and 2004. For more details see
http://www.bris.ac.uk/Depts/CMPO/PLUG/whatisplug.htm.
From these datasets, we take a cohort of pupils who took their KS1 exams in 2000 and their KS2 exams in 2004. We know which school they were in at 5 time points – the 2 Key Stages, as well as the 3 census dates in PLASC – January 2002, 2003 and 2004. We consider the mobility of pupils in the last 3 years of Primary school, and cross classify them by their KS1 School.
Sample selection
The NPD only contains data on state school pupils. Consequently, these results will underestimate mobility as we will lose pupils who migrate to the private sector part way through primary school. Pupils are also dropped if they had missing school identification data at any of the 5 stages. This meant losing just under 5% of the data (28,687 out of an initial 586,622 pupils). Again this is likely to underestimate pupil mobility, as some of the missing data may be due to pupils moving between schools. Finally, pupils in schools with 5 or less pupils within the cohort were dropped. This dropped 0.4% of pupils (2264 / 557935).
We chose to restrict the analysis to three particular LEAs. This means that pupils were included if they took their KS2 exams in the LEA of interest, and not if they ever
attended a school within this LEA. Hampshire, Northamptonshire and Staffordshire were chosen as LEAs, being of a similar size and where the latter two have more pupil
mobility than the first. For present purposes we use data from Northamptonshire and Staffordshire. The latter LEA has 24% of pupils who move school over the 3-year period covered by years 4-6 and the former has 39%.
Pupil movement
Look ing at the national data, 15% of pupils moved between the PLASC census date of January 2002 and KS2, and 43% between KS1 and KS2 test dates. The variable pattern, tabulated below, shows the pattern of pupil movement in the final 3 years of primary school where we have taken the January 2002 status as equivalent to that at the start of school year 4.. The variable is constructed to give an overview of time spent in each school, with the time spent in the first school listed first.
Table 1. Time spent in years 4 (PLASC 2002),5,6. National data.
pattern | Freq. Percent Cum. --- +--- 1,1,0.4,0.6 | 208 0.04 0.04 1,1,1 | 5,017 0.90 0.94 1,1.4,0.6 | 541 0.10 1.04 1,2 | 53,274 9.59 10.62 2,0.4,0.6 | 493 0.09 10.71 2,1 | 24,131 4.34 15.06 2.4,0.6 | 2,144 0.39 15.44 3 | 469,863 84.56 100.00 --- +--- Total | 555,671 100.00
The pattern allows for up to four schools to be attended, with the lengths of time in each indicated. The final time of 0.6 refers to the period beween the final PLASC census date in year 6 (PLASC 04) and the time of the KS2 test.
Mobility differs across the 3 LEAs considered – For the period between PLASC02 and KS2, the proportion of those in the same school were: Northamptonshire (61%), Staffordshire (75%) and Hampshire (91%).
The pattern of mobility for each of the LEAs is shown in Table 2: Table 2. Mobility for three LEAs. Definitions as for Table 1.
Hampshire
pattern | Freq. Percent Cum. --- +--- 1,1,0.4,0.6 | 3 0.02 0.02 1,1,1 | 89 0.65 0.67 1,1.4,0.6 | 8 0.06 0.73 1,2 | 629 4.59 5.32 2,0.4,0.6 | 13 0.09 5.42 2,1 | 448 3.27 8.69 2.4,0.6 | 43 0.31 9.00 3 | 12,465 91.00 100.00 --- +--- Total | 13,698 100.00 Staffordshire
pattern | Freq. Percent Cum. --- +--- 1,1,0.4,0.6 | 1 0.01 0.01 1,1,1 | 67 0.70 0.71 1,1.4,0.6 | 5 0.05 0.76 1,2 | 2,001 20.89 21.65 2,0.4,0.6 | 5 0.05 21.70 2,1 | 258 2.69 24.39 2.4,0.6 | 24 0.25 24.64 3 | 7,220 75.36 100.00 --- +--- Total | 9,581 100.00 Northamptonshire
pattern | Freq. Percent Cum. --- +--- 1,1,0.4,0.6 | 4 0.05 0.05 1,1,1 | 628 8.22 8.27 1,1.4,0.6 | 12 0.16 8.43 1,2 | 2,088 27.33 35.76 2,0.4,0.6 | 2 0.03 35.79 2,1 | 225 2.95 38.73 2.4,0.6 | 27 0.35 39.08 3 | 4,654 60.92 100.00 --- +--- Total | 7,640 100.00
Because of the relatively low levels of mobility in Hampshire, and on the basis of preliminary analyses, we find little change when mobility is accounted for. For this reason we report only the detailed analyses for Nothamptonshire and Nottinghamshire.
Variables used in the analysis
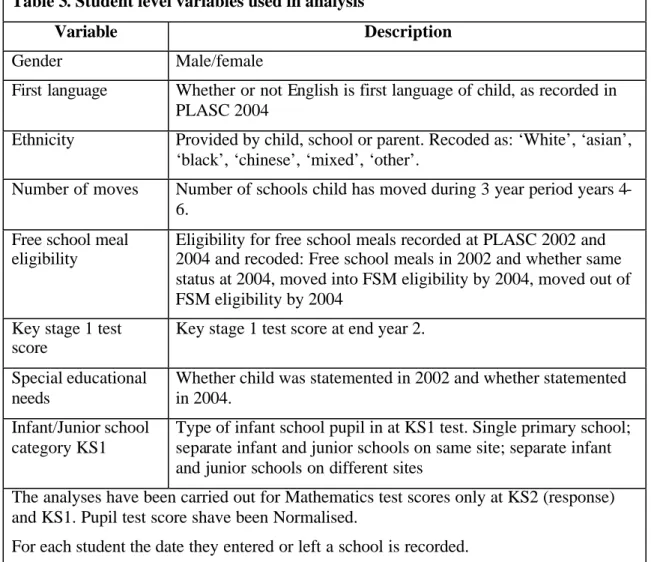
The data were selected from the NPD, recoded using STATA (STATACORP, 200?) and then input to MLwiN (Rasbash et al., 2004) via EXCEL for the model fitting. The student level variables used are set out in Table 3.
Table 3. Student level variables used in analysis
Variable Description
Gender Male/female
First language Whether or not English is first language of child, as recorded in PLASC 2004
Ethnicity Provided by child, school or parent. Recoded as: ‘White’, ‘asian’, ‘black’, ‘chinese’, ‘mixed’, ‘other’.
Number of moves Number of schools child has moved during 3 year period years 4-6.
Free school meal eligibility
Eligibility for free school meals recorded at PLASC 2002 and 2004 and recoded: Free school meals in 2002 and whether same status at 2004, moved into FSM eligibility by 2004, moved out of FSM eligibility by 2004
Key stage 1 test score
Key stage 1 test score at end year 2. Special educational
needs
Whether child was statemented in 2002 and whether statemented in 2004.
Infant/Junior school category KS1
Type of infant school pupil in at KS1 test. Single primary school; separate infant and junior schools on same site; separate infant and junior schools on different sites
The analyses have been carried out for Mathematics test scores only at KS2 (response) and KS1. Pupil test score shave been Normalised.
Table 4. School level variables used in analysis, aggregated from pupil level data.
Variable Description
KS1 mean maths score for KS2 cohort
The mean KS1 mathematics score of the children in the scho ol where the index child takes their KS2 test.
KS1 mean maths score for KS1 cohort
The mean KS1 mathematics score of the children in the school where the index child takes their KS1 test.
KS1 standard deviation of maths score for KS1 cohort
The standard deviation KS1 mathematics score of the children in the school where the index child takes their KS1 test.
% eligible for FSM at KS2
% of pupils in index child’s school at KS2 eligible for free school meals at KS2
% eligible for FSM at KS1
% of pupils in index child’s school at KS1 eligible for free school meals at KS1
% white at KS2 % of pupils in index child’s school at KS2 who are white ethnic
Note that for these variables, strictly speaking, we should use a weighted average over all the ‘peer groups’ that the child has been with for the KS1-KS2 period, but the
computations for this have not yet been possible. Mean math scores are not Normalised.
Other aggregated variables were used in exploratory analyses but not found to contribute to prediction or explanation and are not included here.
Data analysis
In MLwiN the data are stored by pupil record. For the multiple membership analyses MLwiN requires each pupil to have up to q columns reserved containing the school identification codes for each school attended together with a ‘weight’ used in the analysis. The different weighting systems are described below. The first column has to contain a superset of all possible identifiers for schools. A description of how to set up such an analysis is given in Browne (2004, Chapter 15).
The analysis is first described in detail for Staffordshire and results presented for Northamptonshire noting differences and similarities. We fit models of increasing complexity.
Basic variance component analysis using KS2 school identifier
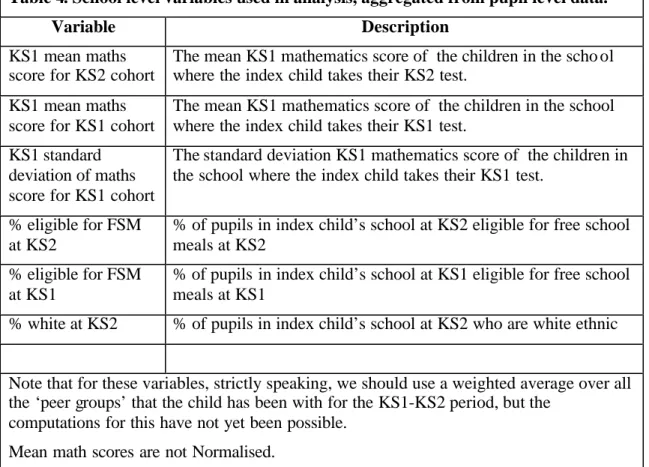
The first analysis, for Staffordshire, fits KS2 Maths test score as response with only an intercept. The level 2 identifier is the KS2 school. All the Maths test scores have been Normalised so that the overall distribution is a standard Normal distribution.TABLE 5: Mathematics KS2 score response for Staffordshire . TVA model* Estimate Standard error Fixed effects
Intercept -0.011
Random Parameters
Between-Junior school variance 0.094 0.011
Between-pupil variance 0.795 0.012
Deviance ( - 2 loglikelihood) 25107.1
TVA = Traditional Value Added. That is where each pupil is assigned to the school in which they take the test used as the response variable.
We now add the age of the child in months from the end of the school year so that the youngest child born in August is coded 1 and the oldest born in September is coded 12. Note that there are a very small number (less than 0.25%) not in the modal year group and we have not treated these separately since there are too few.
TABLE 6: Mathematics KS2 score response for Staffordshire . TVA model Estimate Standard error Fixed effects
Intercept -0.195
Age in months 0.029 0.003
Random Parameters
Between-Junior school variance 0.095 0.011
Between-pupil variance 0.784 0.012
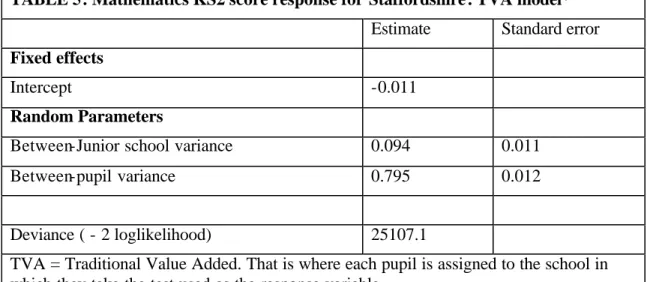
We see a positive relationship, as expected, whereby there is a difference of nearly a third of a standard deviation in Maths test score between the oldest and youngest pupils in the year. We now condition on the KS1 Maths score using a linear term which is sufficient to describe the relationship
TABLE 7: Mathematics KS2 score response for Staffordshire . TVA model Estimate Standard error Fixed effects
Intercept -0.093
Age in months -0.014 0.002
KS1 Maths score 0.754 0.006
Random Parameters
Between-Junior school variance 0.053 0.006
Between-pupil variance 0.301 0.004
Deviance ( - 2 loglikelihood) 15987.9
As expected, there is a substantial decrease in the variances at both levels and the percentage of variance at the school level (the variance partition coefficient, Goldstein, 2003) increases from 11% to 15%. The relationship with age is now negative so that given their KS1 performance the younger children do better indicating that they tend to ‘catch up’ over this period. See also Goldstein and Fogelman (1974) for a similar finding. The following analyses all include KS1 score so that the remaining effects can be
interpreted in terms of affecting the change between KS1 and KS2 scores. The next analysis summarises several explorations fitting different combinations of variables and retains both those statistically significant and those which have some substantive interest.
TABLE 8: Mathematics KS2 score response for Staffordshire: full model. TVA model
Estimate Standard error Fixed effects
Intercept 2.255
Age in months -0.014 0.002
KS1 Maths score 0.756 0.007
Not English first language – Eng. first lang. 0.048 0.092
Mixed-ethnic - white 0.050 0.047
Asian – white 0.038 0.088
Black – white -0.068 0.104
Chinese – white 0.524 0.160
Other ethnic – white 0.078 0.131
Number of school moves -0.052 0.020
Male - Female 0.089 0.011
Moved into FSM year 4 to year 6 – no FSM -0.101 0.036 Moved out of FSM year 4 to year 6 – no FSM 0.022 0.035 FSM in year 4 and year 6 – no FSM -0.083 0.022 Statemented in year 6 – non statemented -0.267 0.037 Proportion in pupil’s KS1 class with FSM -0.795 0.097 Proportion in pupil’s KS2 class with FSM -0.620 0.158 KS1 mean KS1 score in pupil’s KS1 school -0.118 0.009 KS1 S.D. of KS1 scores in pupil’s KS1 school -0.051 0.014 Random Parameters
Between-Junior school variance 0.039 0.004
Between-pupil variance 0.292 0.004
Deviance ( - 2 loglikelihood) 15359.1
We see that there is no significant effect for English a s a first language and the only ethnic group which shows a difference to the white group (used as base category) is Chinese. Boys show greater progress than girls, those who move more often tend to show
less progress, being eligible for free school meals in year 4 (2002) is associated with less progress as is moving into that category between year 4 and year 6 and statemented pupils show considerably less progress than non-statemented. The higher the percentage of free school meal pupils in the pupils KS1 school the less progress made and
additionally the higher the percentage in the pupil’s KS2 school the less progress made. The higher the mean KS1 maths score of the pupils in the pupils KS1 school the less progress is made and the greater the variability there the less progress is made. This result has been found elsewhere and suggests that there is a complex interaction between the pupils score and that of their peers. We have not investigated this in detail (see Bryk and Raudenbush, 2002 for a further discussion) but if we reparameterise using the deviation of the pupil’s score from the average school score instead of the pupil score alone we obtain
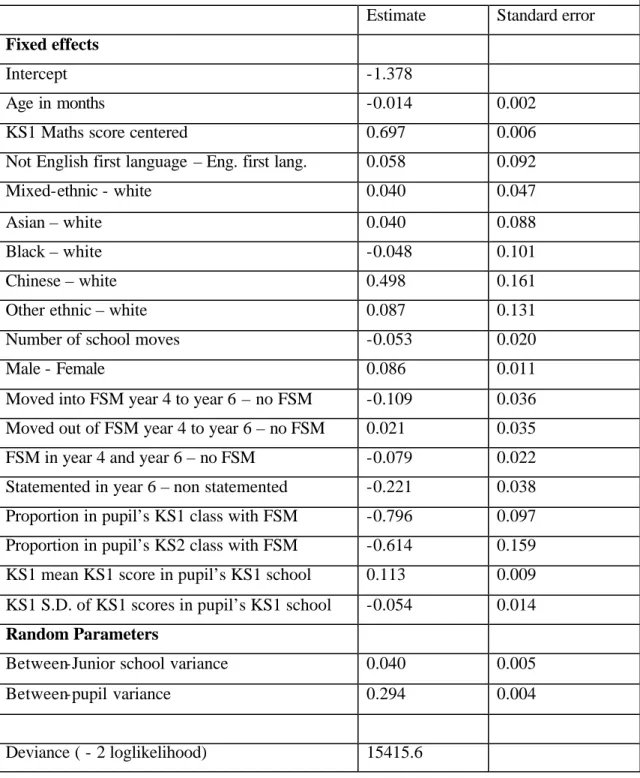
TABLE 9: Mathematics KS2 score response for Staffordshire . TVA model Estimate Standard error Fixed effects
Intercept -1.378
Age in months -0.014 0.002
KS1 Maths score centered 0.697 0.006
Not English first language – Eng. first lang. 0.058 0.092
Mixed-ethnic - white 0.040 0.047
Asian – white 0.040 0.088
Black – white -0.048 0.101
Chinese – white 0.498 0.161
Other ethnic – white 0.087 0.131
Number of school moves -0.053 0.020
Male - Female 0.086 0.011
Moved into FSM year 4 to year 6 – no FSM -0.109 0.036 Moved out of FSM year 4 to year 6 – no FSM 0.021 0.035 FSM in year 4 and year 6 – no FSM -0.079 0.022 Statemented in year 6 – non statemented -0.221 0.038 Proportion in pupil’s KS1 class with FSM -0.796 0.097 Proportion in pupil’s KS2 class with FSM -0.614 0.159 KS1 mean KS1 score in pupil’s KS1 school 0.113 0.009 KS1 S.D. of KS1 scores in pupil’s KS1 school -0.054 0.014 Random Parameters
Between-Junior school variance 0.040 0.005
Between-pupil variance 0.294 0.004
Deviance ( - 2 loglikelihood) 15415.6
with now a positive relationship with mean school score at KS1 and a deviance that suggests the model is not such a good fit to the data.
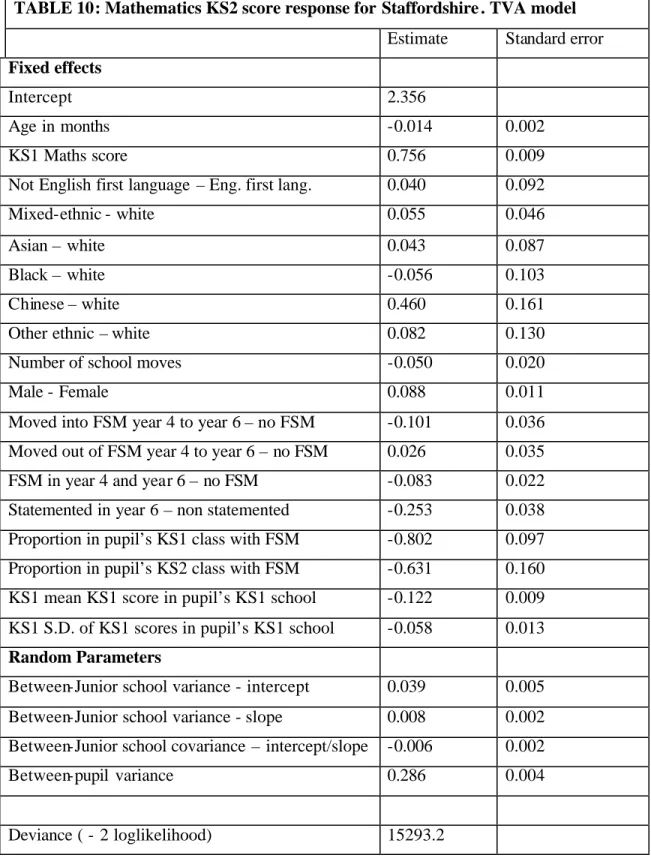
TABLE 10: Mathematics KS2 score response for Staffordshire . TVA model Estimate Standard error Fixed effects
Intercept 2.356
Age in months -0.014 0.002
KS1 Maths score 0.756 0.009
Not English first language – Eng. first lang. 0.040 0.092
Mixed-ethnic - white 0.055 0.046
Asian – white 0.043 0.087
Black – white -0.056 0.103
Chinese – white 0.460 0.161
Other ethnic – white 0.082 0.130
Number of school moves -0.050 0.020
Male - Female 0.088 0.011
Moved into FSM year 4 to year 6 – no FSM -0.101 0.036 Moved out of FSM year 4 to year 6 – no FSM 0.026 0.035 FSM in year 4 and year 6 – no FSM -0.083 0.022 Statemented in year 6 – non statemented -0.253 0.038 Proportion in pupil’s KS1 class with FSM -0.802 0.097 Proportion in pupil’s KS2 class with FSM -0.631 0.160 KS1 mean KS1 score in pupil’s KS1 school -0.122 0.009 KS1 S.D. of KS1 scores in pupil’s KS1 school -0.058 0.013 Random Parameters
Between-Junior school variance - intercept 0.039 0.005 Between-Junior school variance - slope 0.008 0.002 Between-Junior school covariance – intercept/slope -0.006 0.002
Between-pupil variance 0.286 0.004
There is clear evidence here of ‘differential effectiveness’. Since the main purpose of the present paper is to explore the effect of introducing multiple membership and cross classified models we shall not follow this up further, but it will be explored in a subsequent publication, especially in terms of the estimation of ‘school effects’. The following analyses therefore will use only a variance components model. We have also explored the type of Junior school/section attended but this variable is not significant. Finally, before carrying out a multiple membership model we fit the above variance components model in Table 9 using MCMC (using a burn in of 500 and a chain of 5000) for comparison with subsequent analyses that also use MCMC estimation
TABLE 11: Mathematics KS2 score response for Staffordshire . TVA model, M CMC estimates
Estimate Standard error Fixed effects
Intercept 2.262
Age in months -0.014 0.002
KS1 Maths score ce ntered 0.756 0.007
Not English first language – Eng. first lang. 0.048 0.092
Mixed-ethnic - white 0.050 0.047
Asian – white 0.038 0.089
Black – white -0.068 0.103
Chinese – white 0.523 0.161
Other ethnic – white 0.080 0.131
Number of school moves -0.052 0.021
Male - Female 0.089 0.011
Moved into FSM year 4 to year 6 – no FSM -0.101 0.037 Moved out of FSM year 4 to year 6 – no FSM 0.022 0.035 FSM in year 4 and year 6 – no FSM -0.083 0.022 Statemented in year 6 – non statemented -0.266 0.037 Proportion in pupil’s KS1 class with FSM -0.799 0.095 Proportion in pupil’s KS2 class with FSM -0.614 0.158 KS1 mean KS1 score in pupil’s KS1 school -0.118 0.009 KS1 S.D. of KS1 scores in pupil’s KS1 school -0.051 0.014 Random Parameters
Between-Junior school variance 0.040 0.005
Between-pupil variance 0.293 0.004
DIC 15182.0
The Deviance Information Criterion (DIC) has a value of 15182.02 for this model. This is a measure of model complexity and we shall use it to compare models (see Spiegelhalter et al., 2002).
We now fit a multiple membership model where the weights are proportional to the time a pupil spends in each school. Because the PLASC data covers the whole of England we have many pupils in Staffordshire schools at the time of the KS2 test who were in schools outside Staffordshire at some time between the start of year 4 and the KS2 tests, and these schools can be identified. In fact there are a total of 591 distinct schools in the data set of which only 241 are within Staffordshire. For most of these extra schools there is only one pupil represented in the data set.
We switch our estimation method to MCMC because for these models it is
computationally very much more efficient. A discussion of this is given by Browne et al., (2001).
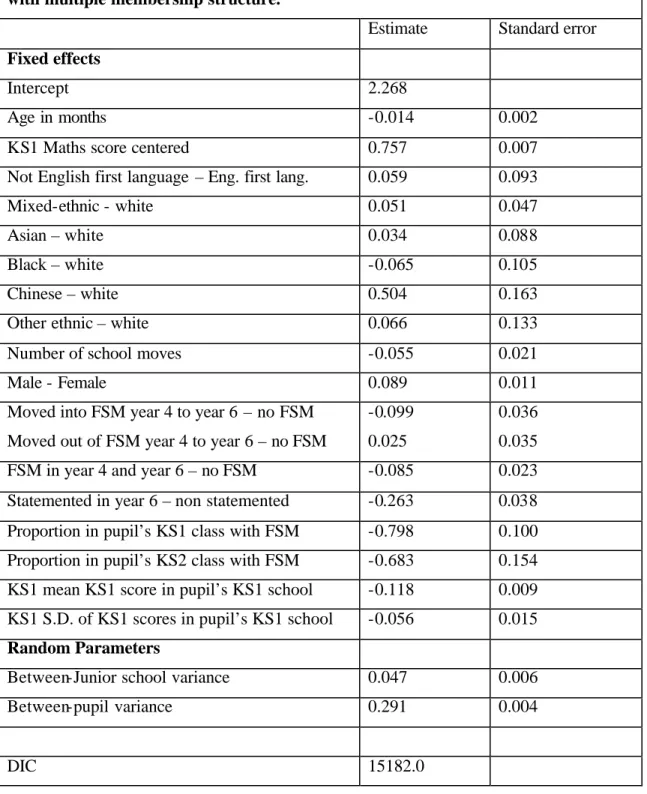
TABLE 12: Mathematics KS2 score response for Staffordshire . MCMC estimates with multiple membership structure.
Estimate Standard error Fixed effects
Intercept 2.268
Age in months -0.014 0.002
KS1 Maths score centered 0.757 0.007
Not English first language – Eng. first lang. 0.059 0.093
Mixed-ethnic - white 0.051 0.047
Asian – white 0.034 0.088
Black – white -0.065 0.105
Chinese – white 0.504 0.163
Other ethnic – white 0.066 0.133
Number of school moves -0.055 0.021
Male - Female 0.089 0.011
Moved into FSM year 4 to year 6 – no FSM -0.099 0.036 Moved out of FSM year 4 to year 6 – no FSM 0.025 0.035 FSM in year 4 and year 6 – no FSM -0.085 0.023 Statemented in year 6 – non statemented -0.263 0.038 Proportion in pupil’s KS1 class with FSM -0.798 0.100 Proportion in pupil’s KS2 class with FSM -0.683 0.154 KS1 mean KS1 score in pupil’s KS1 school -0.118 0.009 KS1 S.D. of KS1 scores in pupil’s KS1 school -0.056 0.015 Random Parameters
Between-Junior school variance 0.047 0.006
Between-pupil variance 0.291 0.004
DIC 15182.0
With DIC value 15144.23 compared with a value of 15182 before - a substantial
reduction. The main effect has been to increase the school level variance by 18% leaving the other effects relatively unaltered.
An issue with the multiple membership analysis is the choice of weights. We have investigated several choices, including giving more or less weight to periods spent in schools further away in time from the KS2 test. If we weight the time spent in each school by the time difference between the mid point of the period in the school and the time of KS2 this gives more weight to the earlier schools and we obtain a DIC of 15158 which is greater than that above. Simply giving equal weight to every school the pupil attends gives a DIC of 15146 which is close to the choice of weights proportional to time spent and we shall use this weighting system in subsequent analyses.
We now look at the effect of including the infant school or section attended. Since every pupil attends both an infant and a junior section or school there is a cross classification here and the next model incorporates both this cross classification and the multiple membership.
TABLE 13: Mathematics KS2 score response for Staffordshire . MCMC estimates with multiple membership structure for junior crossed with infant.
Estimate Standard error Fixed effects
Intercept 2.173
Age in months -0.014 0.002
KS1 Maths score 0.757 0.007
Not English first language – Eng. first lang. 0.070 0.091
Mixed-ethnic - white 0.042 0.046
Asian – white 0.037 0.087
Black – white -0.062 0.104
Chinese – white -0.500 0.158
Other ethnic – white 0.071 0.135
Number of school moves -0.056 0.020
Male - Female 0.090 0.011
Moved into FSM year 4 to year 6 – no FSM -0.094 0.036 Moved out of FSM year 4 to year 6 – no FSM 0.021 0.036 FSM in year 4 and year 6 – no FSM -0.084 0.022 Statemented in year 6 – non statemented -0.264 0.037 Proportion in pupil’s KS1 class with FSM -0.812 0.113 Proportion in pupil’s KS2 class with FSM -0.528 0.149 KS1 mean KS1 score in pupil’s KS1 school -0.113 0.010 KS1 S.D. of KS1 scores in pupil’s KS1 school -0.053 0.010 Random Parameters
Between-Junior school variance 0.012 0.004
Between-Infant school variance 0.038 0.005
Between-pupil variance 0.288 0.004
The DIC value of 15107 is a considerable reduction as would be expected. Most
noticeably, the infant variance is three times as large as the junior variance, even though we have not been able to fit a multiple membership model for infants. This finding that earlier school membership contributes more variation than later school membership is echoed by other analyses (Goldstein and Sammons, 1997) at different stages of schooling.
We can also look at the estimates of school effects, the level 2 residuals, and Figure 1 compares these estimates for the simple ‘value added’ model using KS2 school as identifier with the full multiple membership cross classified model. The estimates of the fixed effects and the level 1 variance are also very little changed across analyses.
Figure 1
The residuals are very highly correlated (0.98) and they also have similar standard errors. This suggests that at the junior stage of education movement between schools is
independent of school effects and that classifying schools ignoring both the multiple membership and cross classified structures will not result in any serious misclassification. We now look at the corresponding analyses for Northamptonshire. We present only the final set of analyses, omitting non-significant (at the 5% level) explanatory variables. For ethnic group we can only distinguish Asian, Black, White and Other. We include the
infant-junior transition type since this has a significant effect. The following uses just the KS2 school as identifier
TABLE 14: Mathematics KS2 score response for Northamptonshire . TVA model Estimate Standard error Fixed effects
Intercept 0.076
Age in months -0.009 0.002
KS1 Maths score 0.732 0.007
Not English first language – Eng. first lang. 0.245 0.063
Asian – white -0.113 0.071
Black – white 0.059 0.051
Other ethnic – white -0.035 0.040
Number of school moves -0.041 0.021
Male - Female 0.076 0.013
Moved into FSM year 4 to year 6 – no FSM -0.148 0.040 Moved out of FSM year 4 to year 6 – no FSM 0.079 0.039 FSM in year 4 and year 6 – no FSM -0.149 0.028 Statemented in year 6 – non statemented -0.345 0.070 Proportion in pupil’s KS1 class with FSM -0.239 0.076 Proportion in pupil’s KS2 class with FSM -0.459 0.200 Transition from infant school same site as junior
– infant department of primary school
-0.039 0.030
Transition from infant school different site from junior – infant department of primary school
-0.096 0.029
Random Parameters
Between-Junior school variance 0.040 0.006
Between-pupil variance 0.291 0.005
DIC 11920.0
The DIC is 11920
TABLE 15: Mathematics KS2 score response for Northamptonshire . Multiple membership model
Estimate Standard error Fixed effects
Intercept -0.045
Age in months -0.009 0.002
KS1 Maths score 0.735 0.007
Not English first language – Eng. first lang. 0.243 0.063
Asian – white -0.131 0.072
Black – white 0.052 0.051
Other ethnic – white -0.037 0.041
Number of school moves -0.041 0.021
Male - Female 0.076 0.013
Moved into FSM year 4 to year 6 – no FSM -0.150 0.040 Moved out of FSM year 4 to year 6 – no FSM 0.085 0.041 FSM in year 4 and year 6 – no FSM -0.145 0.028 Statemented in year 6 – non statemented -0.331 0.069 Proportion in pupil’s KS1 class with FSM -0.199 0.082 Proportion in pupil’s KS2 class with FSM -0.408 0.187 Transition from infant school same site as junior
– infant department of primary school
-0.026 0.033
Transition from infant school different site from junior – infant department of primary school
-0.083 0.032
Random Parameters
Between-Junior school variance 0.058 0.008
Between-pupil variance 0.286 0.005
DIC 11834.0
The DIC is substantially reduced and we see a 45% increase in the variance at level 2. Now fitting both the multiple membership and cross classification structure we obtain
TABLE 16: Mathematics KS2 score response for Northamptonshire . Cros s classified and multiple membership model.
Estimate Standard error Fixed effects
Intercept -0.010
Age in months -0.009 0.002
KS1 Maths score 0.740 0.007
Not English first language – Eng. first lang. 0.227 0.064
Asian – white -0.130 0.071
Black – white 0.042 0.051
Other ethnic – white -0.041 0.042
Number of school moves -0.042 0.019
Male - Female 0.078 0.013
Moved into FSM year 4 to year 6 – no FSM -0.152 0.040 Moved out of FSM year 4 to year 6 – no FSM 0.082 0.040 FSM in year 4 and year 6 – no FSM -0.139 0.028 Statemented in year 6 – non statemented -0.321 0.069 Proportion in pupil’s KS1 class with FSM -0.191 0.106 Proportion in pupil’s KS2 class with FSM -0.403 0.169 Transition from infant school same site as junior
– infant department of primary school
-0.030 0.041
Transition from infant school different site from junior – infant department of primary school
-0.060 0.040
Random Parameters
Between-Junior school variance 0.035 0.006
Between-Infant school variance 0.023 0.005
Between-pupil variance 0.280 0.005
DIC 11750.0
The DIC is 11750. Unlike in the case of Staffordshire, the infant school variance is now smaller than the junior variance and this is still the case if we do not include type of
infant school. As before, however, the correlation between junior school effects for the simple and the full models is very high at 0.97. We should note that there are 21 middle schools, where pupils transfer at year 5, out of 246 schools for pupils in years 4-6. These schools are not present at the time of the KS2 test and so function as if they are schools from outside the LEA.
If we fit a cross classified model but without multiple membership using KS2 school identification we obtain
TABLE 17: Mathematics KS2 score response for Northamptonshire . Cross classified without multiple membership model.
Estimate Standard error Fixed effects
Intercept -0.053
Age in months -0.009 0.002
KS1 Maths score 0.740 0.007
Not English first language – Eng. first lang. 0.225 0.062
Asian – white -0.135 0.070
Black – white 0.042 0.050
Other ethnic – white -0.044 0.041
Number of school moves -0.046 0.021
Male - Female 0.078 0.013
Moved into FSM year 4 to year 6 – no FSM -0.149 0.039 Moved out of FSM year 4 to year 6 – no FSM 0.076 0.040 FSM in year 4 and year 6 – no FSM -0.138 0.028 Statemented in year 6 – non statemented -0.329 0.070 Proportion in pupil’s KS1 class with FSM -0.200 0.107 Proportion in pupil’s KS2 class with FSM -0.422 0.185 Transition from infant school same site as junior
– infant department of primary school
-0.034 0.043
Transition from infant school different site from junior – infant department of primary school
-0.060 0.041
Random Parameters
Between-Junior school variance 0.024 0.006
Between-Infant school variance 0.028 0.005
Between-pupil variance 0.280 0.005
DIC 11748.0
Here the infant variance is just slightly larger than the junior one, so that fitting the multiple membership model not only changes our inference about the size of the junior variance but also the relative importance of infant and junior by increasing the estimate for the junior variance substantially more than the increase I the infant variance.
Conclusions and further work
In ‘school effectiveness’ studies of the contribution of schools to educational outcomes, pupils’ test scores are typically assigned to a single school, usually the one in which the outcome measure, a test or examination, is taken. In fact, pupils spend many years in school, their learning is cumulative and there is movement between schools both within a particular stage (for example the Junior school period) and across stages (for example from the infant to Junior stage). Hence, assignment of a pupil’s test or examination score to a single school is an approximation that may distort inferences about the effects of schooling. In this paper we have examined the impact of allowing for such movement on parameter estimates. We use recently available data to do this (PLASC/NPD) that allows us to track pupils across schools. The two issues that we focus on are whether this allowance for mobility influences rankings of schools (‘league tables’) and whether it substantially changes the estimate of the between-school variation.
We have two main results. First, we show that the traditional value added model (TVA) that ignores mobility, underestimates the importance of the school as measured by its contribution to the overall variance. We have also shown that the relationships among variances at different stages of schooling are changed. This suggests that many of the conclusions about school effects in the educational literature may need revision and that future studies should be designed so that pupil mobility is properly accounted for. The reason for the upward revision of the between-school variance is because when mobility is ignored the estimate obtained has the variance associated with an average over several schools (those actually attended) which is smaller than the true between-school variance. In such multiple membership models one issue is the choice of a weighting system. Our limited exploration suggests that a simple system that defines weights proportional to the time spent in each school is near optimum.
Secondly our analyses suggest that, for the purpose of ranking schools on the basis of their posterior ‘value added’ estimates, no serious errors will be made by ignoring either pupil mobility or earlier schools attended. We should, however, make the caveat that this conclusion may be modified when random coefficient, ‘differential effectiveness’ models are used. In addition, the use of cross classified models does provide further insight into the effects of prior stages of schooling, although this also does not appear to alter the rankings of the estimated school effects.
In future work we intend to introduce area of residence as another classification and additionally to take account of movements among areas.
Our procedures will apply to areas other than education, for example in repeated
measures designs that are treated as 2-level structures with measurement occasions nested within individuals. Thus in a study where there are measurer effects and measurers change over time, a multiple membership model is required. Another example is in panel studies of households where there is moveme nt of individuals among households over time and where the use of multiple membership models is necessary for certain types of question (Goldstein et al., 2000). In all of these cases one of the major problems is the availability of data that allows mobility to be tracked and this suggests that efforts should be made at the study design stage to ensure that these are collected.
References
Raudenbush, S. W. and Bryk, A. S. (1989). Quantitative models for estimating teacher and school effectiveness. Multilevel Analysis of Educational Data. R. D. Bock. New York, Academic Press.
Goldstein, H., Rasbash, J., Yang, M., Woodhouse, G., et al. (1993). A multilevel analysis of school examination results. Oxford Review of Education19: 425-433.
Goldstein, H. (2003). Multilevel Statistical Models. Third edition. London, Edward Arnold:
Goldstein, H., Huiqi, P., Rath, T. and Hill, N. (2000). The use of value added information in judging school performance. London, Institute of Education:
Rasbash, J., Steele, F. and Browne, W. (2004). A user's guide to MLwiN version 2.0. London, Institute of Education.
Browne, W. J. (2004). MCMC estimation in MLwiN. Version 2.0. London, Institute of Education.
Goldstein, H. and Fogelman, K. (1974). Age Standardisation & Seasonal Effects in Mental Testing. British Journal of Mathematical and Statistical Psychology44: 109-115. Spiegelhalter, D., Best, N., Carlin, B. P. and Van der Linde, A. (2002). Bayesian
measures of model complexity and fit (with discussion). Journal of the Royal Statistical Society, B64: 583-640.
Goldstein, H. and Sammons, P. (1997). The influence of secondary and junior schools on sixteen year examination performance: a cross-classified multilevel analysis. School effectiveness and school improvement.8: 219-230.
Goldstein, H. and Woodhouse, G. (2000). School effectiveness research and
Educational Policy. Oxford Review of Education26: 353-363.
Bryk, A. S. and Raudenbush, S. W. (2002). Hierarchical Linear Models. Newbury Park, California, Sage:
Browne, W., Goldstein, H. and Rasbash, J. (2001). Multiple membership multiple classification (MMMC) models. Statistical Modelling1: 103-124.
Goldstein, H., Rasbash, J., Browne, W., Woodhouse, G., et al. (2000). Multilevel models in the study of dynamic household structures. European Journal of Population16: 373-387.