Procedia - Social and Behavioral Sciences 170 ( 2015 ) 155 – 164
ScienceDirect
1877-0428 © 2015 The Authors. Published by Elsevier Ltd. This is an open access article under the CC BY-NC-ND license (http://creativecommons.org/licenses/by-nc-nd/4.0/).
Peer-review under responsibility of Centre for Environment-Behaviour Studies (cE-Bs), Faculty of Architecture, Planning & Surveying, Universiti Teknologi MARA, Malaysia.
doi: 10.1016/j.sbspro.2015.01.025
AcE-Bs2014Seoul
Asian Conference on Environment-Behaviour Studies
Chung-Ang University, Seoul, S. Korea, 25-27 August 2014
" Environmental Settings in the Era of Urban Regeneration"Users’ Perception of Energy Efficiency in School Design
Mohd Najib Mohd Salleh
*a, Mohd Zin Kandar
b, Siti Rasidah Md Sakip
c, Noraini
Johari
caSchool of Housing, Building & Planning, Universiti Sains Malaysia, Malaysia bFakulti Alam Bina, Universiti Teknologi Malaysia, Malaysia
cFaculty of Architecture, Planning and Surveying, Universiti Teknologi MARA, Seri Iskandar, Malaysia
Abstract
Increasing energy demands projected in the year 2030 (40%) requires the government to take action on energy-efficiency initiatives now. This study aims to determine the user perception on energy energy-efficiency and design of schools in Malaysia. The perception on energy efficiency (PEE) and perception on design (POD) are the construct to measure the perception of energy efficiency in school design (UPEESD). The result found that all construct achieved Cronbach’s Alpha coefficient level exceeding 0.60 (POD=0.73, PEE=0.80); indicating that all dimensions have good reliability values. This result also found that there is significant correlation between POD and PEE (r=0.282, p=0.00). © 2014 Published by Elsevier Ltd. Selection and peer-review under responsibility of theCentre for Environment-Behaviour Studies (cE-Bs), Faculty of Architecture, Planning & Surveying, Universiti Teknologi MARA, Malaysia.
Keywords: User perception; energy efficiency; school; school design
1.Introduction
Increase in global warming due to weather changes caused by greenhouse gas emission has led to the destruction of the earth’s habitats and loss of biodiversity (C. Filippin, 2000). Unchecked greenhouse gas emission is the direct effect of the rise in energy consumption that is the main factor influencing global warming. Based on forecasts by the International Energy Agency (IEA) increased energy consumption in 2030 will reach 40% higher than energy demands in 2007 (González A.B.R. et al., 2011). Energy consumption in buildings has been identified as a contributor to 40% of the world’s energy consumption;
* Corresponding author. Tel.: +60192788594; fax: +6053712657
E-mail address: [email protected]
© 2015 The Authors. Published by Elsevier Ltd. This is an open access article under the CC BY-NC-ND license (http://creativecommons.org/licenses/by-nc-nd/4.0/).
Peer-review under responsibility of Centre for Environment-Behaviour Studies (cE-Bs), Faculty of Architecture, Planning & Surveying, Universiti Teknologi MARA, Malaysia.
25% of the world’s water consumption and 40% of the world’s resources. Buildings also recorded 1/3 of the world’s greenhouse gas emission derived from their users. Despite all these, buildings have the potential to reduce their energy consumption between 30% to 80% (SBCI, 2012). Increased energy consumption has been identified to be caused by three main sectors of the world’s energy consumption: (1) industries; (2) transportation; and (3) others (including residential buildings). Energy consumption in 2008 for other sectors including buildings recorded the largest value of 36% compared to 28% for industries and 27% for transportation. Energy consumption in buildings (residential, commercial, offices) has contributed between 20% to 40% of the total energy consumption in the world (WBCSD, 2009, R. Saidur, 2009, The IEA website, 2012).
Energy consumption in Malaysia has also recorded increases. According to R. Saidur (2009) direct increase in energy consumption, will lead to increased amount of greenhouse gas (GHG) emission. Malaysia recorded increases totalling 31.2% electrical energy consumption for the ten (10) year period from 2000 to 2010. The end rate of national energy demand is poised to record increases of almost 80% in 2030 (Ninth Malaysia Plan, 2006-2010). The Malaysian Public Works Department (JKR) has taken initiatives to design and implement development projects focused on efficient energy consumption in government buildings in line with the Malaysian government’s target of reducing greenhouse gas emission by 40% from 2005 until 2020 (Y.R. Rashid et al., 2011). Some of the initiatives include fixing building air-conditioning temperature to be not less than 24 degrees Celsius as one of the steps towards energy efficiency (Bernama, 2011).
Today demands for energy consumption steadily increased in tandem with development and modernisation especially in developing countries such as Malaysia. Effects from these increases are the main causes of the world’s climate changes, and they should be overcome. To handle these issues, the factors contributing to building energy consumption must be identified, and a thorough understanding of these factors is required. Building energy efficiency may be influenced by three factors namely: a) building design; b) services and operations design; and c) building user behaviour (Anwar Al-Mofleh et al., 2009, M.Z. Kandar et al., 2009). Design that consists of passive design (building envelope design) and active design (building services and operational system design) are interrelated and interdependent with the building’s user behavioural characteristics.
Based on a study by the New Building Institute (2008), 30% of LEED certified buildings achieved the expected performance based on a design produced while 25% performed dismally contrary to expectations. This scenario may be due to technical failings, too high expectations, operational purposes or influenced by user behaviour (Jay Aaron Keazer, 2007). According to Hoes et al. (2009), “Energy use in buildings is closely linked to their operational and space utilisation characteristics and the behaviour of their occupants." This demonstrates that human behaviour influences the entire energy consumption in the building. It is thus perceived that design and energy consumption in a building are interrelated in determining the level of user comfort and the production of energy efficient design. Therefore, this research aims to investigate user perception of energy efficiency in school design (UPEESD) which consisted of the two dimensions; (1) perception on design (POD) and (2) perception on energy efficiency (PEE).
2.Literature Review
2.1.Energy efficiency design elements
The term Energy Efficiency is a generic one. In other words, it denotes the efficient consumption of energy. Energy efficiency refers to low energy consumption and simultaneously produces the same or better total consumption value (William Chung et al., 2006). Some views state that energy efficiency
means “energy conservation” as it refers to the same meaning. Energy conservation refers to low energy consumption, but the energy produced is also low (M.Z. Kandar et al., 2009). The use of the term “energy consumption” reflects the total energy consumed. There is a close relationship between the terms above whereby the focus is intertwined with “energy consumption towards efficient use." To build an energy efficient building, designers must understand the principles of energy exchanges. In principle and practice, there are eight (8) main concepts in constructing energy efficient building which are: Wind Break; Plants and Water; Indoor/Outdoor Rooms; Earth Sheltering; Solar Walls and Windows; Material Thermal Envelope; Sun Shading; and Natural Ventilation. According to Watson D. & Labs K. (1983) energy exchanges, within and outside the building occur through walls, roof, windows, floor and other forms that allow such exchanges to happen (D. Watson, 1983). Apart from building design, environmental climate also influences energy consumption in buildings. Malaysia, which is located almost on the Equator receives an average of ten hours of daily sunlight and average luminance of 500 W/m2 as well as extreme luminance up to 1000 kW/m2. Malaysia enjoys pleasant skies throughout the year with 60% to 90% cloudy. Clear skies are between 700 – 850 cd/m2. Malaysia is also categorised as a receiver of heavy rains followed by thunderstorms with annual rainfall averaging 2,000 to 5,000 mm. Wind velocity comes from various directions with long still periods averaging 1.5 m/s. Average temperatures in Malaysia range from 27oC to 32oC in the daytime and hovers around 22oC at night. Relative humidity in Malaysia is about 75% but can reach 100%. Abdul Malek Abdul Rahman (2000) reported that in Malaysia thermal comfort reflected when relative humidity (RH) achieved between 45% - 80.6% and dry bulb temperature reach between 25.5oC – 28.5oC with wind velocity of 1.5 m/s could not provide comfort to people whether they are outside or inside the building (Rahman A.M.A., 2000). 2.2.User behaviour and building design
A building must perform the function for which it was designed. However, user behaviour is about to influence its returns especially in influencing energy efficiency in the building because users have a direct relationship with the utilisation behaviour within a space where its activities are carried out (P. Hoes et al., 2009). User behaviour also influences the pattern of energy consumption in a building. Frequently, user behaviour studies in buildings are based on behaviour assumptions without the implementation of actual observation analysis or reference to prediction models. Such assumptions result in limitations in analyses results and may lead to weak findings. Differences in findings for energy efficiency based on expectations as compared to the actual scenario will occur. This is proven when a study provided without taking into consideration user factor in its study analysis. O. Masoso (2010) proved this by revealing in his study that “normal energy wastage periods in a building occur when it is not occupied” (O. Masoso and L. Grobler, 2010). This statement shows that user behaviour that does not switch off electrical points upon leaving a space or the building leads to wastage of energy.
Energy consumption behaviour in buildings has captured researcher attention since the 1970s in the wake of the energy crisis (Jay Aaron Keazer, 2007). Most research involving user behaviour is focused on energy consumption behaviour in residential buildings. It is only lately that the focus has shifted to commercial buildings. User and energy behaviour studies in institutional buildings are very isolated such as that produced by Ron Widman (Shengwei Wang et al., 2012).
The significance of research on energy consumption behaviour in school buildings deserve attention as indicated in Power Save School Program where energy savings of between 5% to 15% can be achieved based only on changes in user behaviour in the school (Ismail M. et al., 2009). This shows that user behaviour on energy efficiency is a real issue that very much influences energy issues in buildings. This study have carried out questionnaire survey on building users as respondents with the aim of investigating the relationship between user behaviours with building design in evaluating school building design. The
use of questionnaires is most economical and effective methods to collect the required data. Observatory method is another method used to obtain validity. User perception assessment in the building can provide information on the user performance and satisfaction level.
2.3.School building in Malaysia BEI and OEI
The importance of education is reflected in its priority in national planning, spurred by the need for information technology infrastructure which has directly augmented energy demands in school buildings. Unfortunately, the significance and control of energy consumption in schools monitored by the school authorities is insufficient. In developed countries, this significance has begun to draw attention (Kim Tae-Woo et al., 2012). Reduction in energy consumption in school buildings is believed to directly reduce management costs and building expenditures. Simultaneously the national rate of electrical energy demand is expected to drop.
Reduction in energy demands is crucial but specifically in Malaysia towards realising 40% reduction in greenhouse gas emission and countering global climate changes besides channelling cost savings towards more significant budgetary needs. Results from the All Malaysia Secondary School Energy and Renewable Energy (KT&DT) Efficiency Project Contest 2003 recorded findings of school building energy index value (BEI) averaging 19kWh/m2/year and school occupant energy index (OEI) at an average of 115kWh/occupant/year. Based on the current electricity tariff, the cost of RM5.47 for every square metre of floor area per annum and RM33.12 for every student per annum were spent on energy consumption in schools (K. Ibrahim et al., 2005).
These values involved school average values and based on those totals it is estimated that the government spent a total of RM88 million per annum on electricity energy expenditure in secondary schools in Malaysia. The difference between data findings recorded by Salleh M.N.M, (2008) for school building energy index value (BEI) was 10kWh/m2/year and occupant energy index (OEI) was 77kWh/occupant/year (Salleh M.N.M., 2008). This study involved a total of eight (8) secondary schools in the District of Perak Tengah, Perak. Based on current tariff applicable for that year, energy costs of RM2.88 for every square metre of floor area per annum, and the cost of RM22.18 for every student per annum were spent. In accordance with these values, it is estimated that every school will spend approximately RM 20,388.24 per annum on energy consumption.
3. Methodology
There are 14 secondary schools in the District of Perak Tengah, but only four schools contributed in this study as a sample. 500 questionnaires were distributed at the selected schools, which are Sekolah Menengah Kebangsaan Seri Iskandar (SMKSI), Sekolah Menengah Kebangsaan Dato’ Abdul Rahman Yaakob (SMKDARY), Sekolah Menengah Teknik Seri Iskandar (SMTSI) and Sekolah Menengah Kebangsaan Agama Sultan Azlan Shah (SMKASAS) meaning 125 questionnaires were distributed in each school. The respondents involved in this study are teachers, staff and Form 4 and Form 5 students. The questionnaire is divided into three parts: Part 1- background information, Part 2- the construct of perception on design (POD) and Part 3 – the construct of perception on energy efficiency (PEE).
3.1.Variable and measurement
This study employed two dimensions of user perception of energy efficiency in school design (UPEESD): perception on design (POD) and perception on energy efficiency (PEE). The dimension of POD included 16 items and PEE with 14 items. The measurement of UPEESD was rated using a Likert
scale ranging from 1 to 5 from “Highly Disagree” to “Highly Agree." The high score will indicate that the user perception on energy efficiency (UPEESD) is high and vice versa if the score obtained is low. The technique of providing the scales “Highly Disagree” to “Highly Agree” will give the result intensity from respondents, thus impacting the distribution of the respondents’ score.
4.Findings
4.1.Validation of user perception on energy efficiency construct
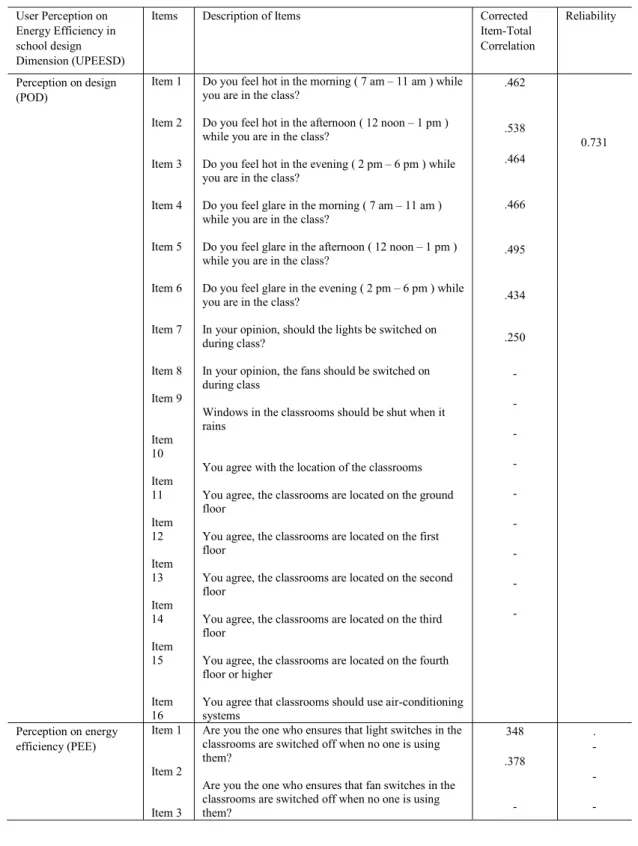
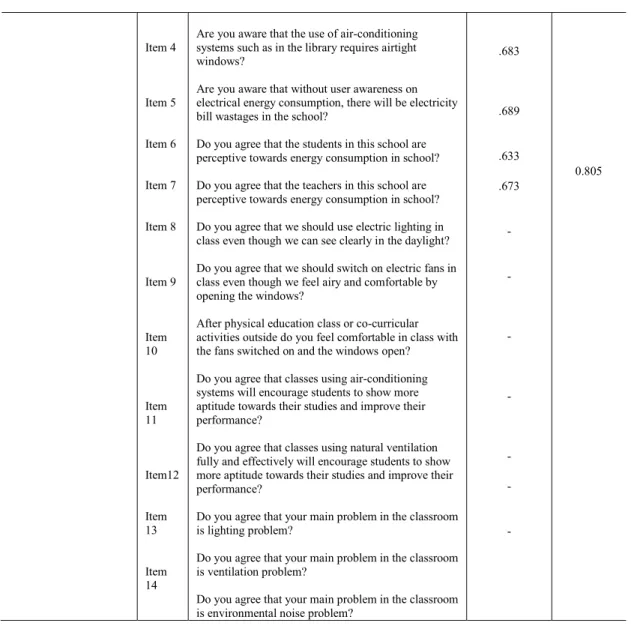
One objective of this paper was to conduct validation on the construct of user perception on energy efficiency in school design (UPEESD) which consisted of the two dimensions, which are: i) perception on design (POD), and ii) perception on energy efficiency (PEE). The dimension of perception on design (POD) comprised of 16 items and perception on energy efficiency (PEE) consisted 14 items to measure the respective dimension. Nine items (item no 8 to 16) in POD was eliminated in this research because of the corrected item-total correlation are less than 0.3 that indicates the items measures something different from the scale as a whole. Meanwhile, eight items (item no 3, 8 to 14) in PEE eliminated with the same reason as POD dimension. The result is explained in Table 1.
The validation of construct user perception on energy efficiency in school design (UPEESD) was done by conducting exploratory factor analysis (EFA) using SPSS software. EFA is used in the early stages to gather information about the interrelationships among variables. According to Nunnally (1978), the ratio of subjects to items recommends a 10 to 1 ratio in EFA. In this research, the sample size is considered adequate since there are 125 respondents who participated in each school. The Cronbach’s Alpha value was used to determine the level of reliability through the internal consistency for each factor as shown in Table 1.
The result shows that all user perception on energy efficiency in school design (UPEESD) dimensions achieved Alpha value level exceeding 0.60 (Alpha: 0.74 to 0.80) indicating that all dimensions have a good reliability value. Corrected item-total correlation to all items is more than 0.3 that indicated the degree at which each item correlates with the total score (Nunnally et al., 1994).
4.2.Demography and user perception on energy efficiency
There are 6.8% (28) teachers, 3.9% (16) support staff and 89.3% (366) students who participated in this study. Results of One-way ANOVA analysis on respondent with a perception on design (POD=(F(2,407)=2.20, p=0.11), and perception on energy efficiency (PEE=(F(2,407)=0.41, p=0.66) found that there is no significant between them. The result also found that there are no significant difference between respondent and user perception on energy efficiency (UPEE =(F(2,407)=1.84, p=0.15). However, the result of One-way ANOVA on demography background of the status on perception on design (POD) has a significant difference at Sekolah Menengah Kebangsaan Dato’ Abdul Rahman Yaakob (SMKDARY) (F(2,90)=5.97, p=0.00), and Sekolah Menengah Teknik Seri Iskandar (SMTSI) (F(2,79)=3.98, p=0.02).
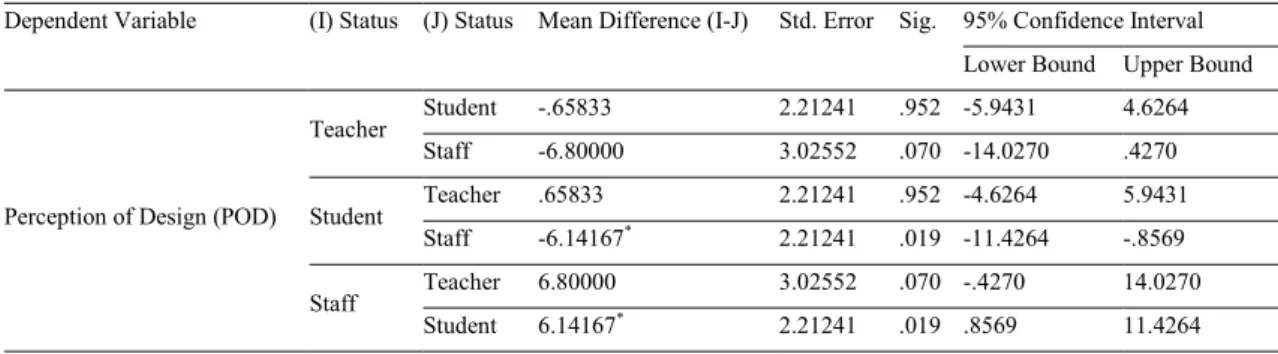
For demography status with a significant difference with POD at SMKDARY, a post-hoc test using Tukey procedure was carried out which shows that there is a mean difference in the group status: (a) teacher with student (mean difference = 5.16), (b) student with teacher (mean difference= -5.16) and (c) staff with the teacher (mean difference = -7.96) as shown in Table 2. However, the result of Post-hoc Tukey of demography of status with POD in SMTSI is shown in Table 3. The result shows that there are significant differences between groups of status: (a) teacher with student (mean difference = 5.16), (b) student with teacher (mean difference= -5.16) and (c) staff with the teacher (mean difference =-7.96).
Table 1. Results of the reliability user perception on energy efficiency dimensions User Perception on
Energy Efficiency in school design Dimension (UPEESD)
Items Description of Items Corrected Item-Total Correlation Reliability Perception on design (POD) Item 1 Item 2 Item 3 Item 4 Item 5 Item 6 Item 7 Item 8 Item 9 Item 10 Item 11 Item 12 Item 13 Item 14 Item 15 Item 16
Do you feel hot in the morning ( 7 am – 11 am ) while you are in the class?
Do you feel hot in the afternoon ( 12 noon – 1 pm ) while you are in the class?
Do you feel hot in the evening ( 2 pm – 6 pm ) while you are in the class?
Do you feel glare in the morning ( 7 am – 11 am ) while you are in the class?
Do you feel glare in the afternoon ( 12 noon – 1 pm ) while you are in the class?
Do you feel glare in the evening ( 2 pm – 6 pm ) while you are in the class?
In your opinion, should the lights be switched on during class?
In your opinion, the fans should be switched on during class
Windows in the classrooms should be shut when it rains
You agree with the location of the classrooms You agree, the classrooms are located on the ground floor
You agree, the classrooms are located on the first floor
You agree, the classrooms are located on the second floor
You agree, the classrooms are located on the third floor
You agree, the classrooms are located on the fourth floor or higher
You agree that classrooms should use air-conditioning systems .462 0.731 .538 .464 .466 .495 .434 .250 - - - - - - - - - Perception on energy efficiency (PEE) Item 1 Item 2 Item 3
Are you the one who ensures that light switches in the classrooms are switched off when no one is using them?
Are you the one who ensures that fan switches in the classrooms are switched off when no one is using them? 348 .378 - . - - -
Table 2. Results of Post-Hoc Tukey difference between statuses of demography on perception of design (POD) in SMKDARY Item 4 Item 5 Item 6 Item 7 Item 8 Item 9 Item 10 Item 11 Item12 Item 13 Item 14
Are you aware that the use of air-conditioning systems such as in the library requires airtight windows?
Are you aware that without user awareness on electrical energy consumption, there will be electricity bill wastages in the school?
Do you agree that the students in this school are perceptive towards energy consumption in school? Do you agree that the teachers in this school are perceptive towards energy consumption in school? Do you agree that we should use electric lighting in class even though we can see clearly in the daylight? Do you agree that we should switch on electric fans in class even though we feel airy and comfortable by opening the windows?
After physical education class or co-curricular activities outside do you feel comfortable in class with the fans switched on and the windows open? Do you agree that classes using air-conditioning systems will encourage students to show more aptitude towards their studies and improve their performance?
Do you agree that classes using natural ventilation fully and effectively will encourage students to show more aptitude towards their studies and improve their performance?
Do you agree that your main problem in the classroom is lighting problem?
Do you agree that your main problem in the classroom is ventilation problem?
Do you agree that your main problem in the classroom is environmental noise problem?
.683 .689 .633 .673 - - - - - - - 0.805
Dependent Variable (I) Status (J) Status Mean Difference (I-J) Std. Error Sig. 95% Confidence Interval Lower Bound Upper Bound
Perception of Design (POD)
Teacher Student 5.16250 * 1.59462 .005 1.3624 8.9626 Staff 7.96667* 3.12963 .033 .5085 15.4249 Student Teacher -5.16250 * 1.59462 .005 -8.9626 -1.3624 Staff 2.80417 2.79586 .577 -3.8586 9.4670 Staff Teacher -7.96667 * 3.12963 .033 -15.4249 -.5085 Student -2.80417 2.79586 .577 -9.4670 3.8586 *. The mean difference is significant at the 0.05 level.
Table 3. Results of Post-Hoc Tukey difference between statuses of demography on perception of design (POD) in SMTSI
Dependent Variable (I) Status (J) Status Mean Difference (I-J) Std. Error Sig. 95% Confidence Interval Lower Bound Upper Bound
Perception of Design (POD)
Teacher Student -.65833 2.21241 .952 -5.9431 4.6264 Staff -6.80000 3.02552 .070 -14.0270 .4270 Student Teacher .65833 2.21241 .952 -4.6264 5.9431 Staff -6.14167* 2.21241 .019 -11.4264 -.8569 Staff Teacher 6.80000 3.02552 .070 -.4270 14.0270 Student 6.14167* 2.21241 .019 .8569 11.4264 *. The mean difference is significant at the 0.05 level.
4.3.Relationship between perception of design and perception of energy efficiency dimension
Additionally, this study investigated the relationship between perception of design (POD) and perception of energy efficiency (PEE) dimensions. Pearson correlation analysis was used to identify the correlation between variables because the data is continuous variables. Referring to Table 4, the result shows that there is a positive significant relationship between POD with PEE (r=0.20, p=0.00). The finding shows that the higher the perception on school building design is, the higher is the perception on energy efficiency. According to Pallant (2005), this relationship is moderate because the r value is below 0.50 (Pallant J., 2005).
Table 4. Results of Pearson correlation between perception of design with perception of energy efficiency dimensions
5.Discussion
The main objective of this paper is to investigate the relationship between perception on energy efficiency (PEE) and perception on design (POD) in measuring user perception on energy efficiency in school buildings (UPEESD). This study found that items adopted to measure both constructs achieved a good reliability value (Alpha: POD=0.73, PEE=0.80). The study also found that there is a significant and positive relationship between design (POD) and energy efficiency (PEE) (r=0.282, p=0.00). These findings clarified that when user perception on design increased, energy consumption efficiency also increases. The findings support recommendations by O. Masoso and L. Grobler (2010) on the need to consider user factor in measuring energy efficiency in the building. Anwar et al. (2009) concurred that energy efficiency will be achieved through design and efficient user behaviour factors in buildings. This study directly exposes to the public the importance of efficient energy consumption in schools and the need at design stage to produce passive design that is energy friendly or to increase the utilisation of Dimensions Perception of design (POD) Perception of energy efficiency (PEE) Perception of design (POD)
Pearson Correlation 1 .203**
Sig. (2-tailed) .000
N 410 410
Perception of energy efficiency (PEE)
Pearson Correlation .203** 1 Sig. (2-tailed) .000
N 410 410
active design that is user friendly such as automatic switch control in the absence of users. Such energy efficiency system designs may be able to reduce costs of energy consumption towards more efficient energy consumption. Users will also be able to carry out their responsibilities as efficient users who care about energy consumption in school buildings. This study may aid at planning, design and management stages as guidelines in efficiency design needs.
Acknowledgement
The researchers would like to thank the Ministry of Education Malaysia (KPM), the Perak State Education Department and all secondary schools in the District of Perak Tengah for their full cooperation and support towards the successful implementation of this study. Special thanks are also accorded to all the respective teachers, students and staff as users within the study areas for their invaluable cooperation. References
Anwar Al-Mofleh, Soib Taib, M. Abdul Mujeebu & Wael Salah. (2009). Analysis Of Sectoral Energy Conservation In Malaysia. Energy, 34, 733-739.
Bernama. (2011). Suhu Bangunan Kerajaan Tidak Kurang 24 Darjah Celsius. Berita Harian [Online]. [Accessed 28/12/2012]. Filippin, C. (2000). Benchmarking The Energy Efficiency And Greenhouse Gases Emissions Of School Buildings In Central
Argentina. Building And Environment, 35, 407-414.
D. Watson, D. (1983). Climatic Design - Energy Efficiency Building Principles And Practices, Usa.
González, A.B.R., Dìaz, J.J.V., Caamaño, A.J. & Wilby, M.R. (2011). Towards A Universal Energy Efficiency Index For Buildings.
Energy And Buildings, 43, 980-987.
Ismail, M., Rahman, A.M.A. & Ismail, M.R. (2009). Field Study On The Ventilation Performance Of The Hybrid Turbine Ventilator (Htv) In The Tropics. International Journal On Design And Manufacturing Technologies, 3.
Jay Aaron Keazer. (2007). A Study Of Arkansas K-12 School Building Energy Requirements And An Evaluation Of Improvements Toward Energy Efficiency Using Building Energy Simulations. Master Of Sciences In Mechanical Engineering, University Of Arkansas.
Ibrahim, K., Kandar, M.Z. & Norashid, Y. (2005). Koleksi Pertandingan Projek Kecekapan Tenaga Diperbaharui (Kt&Dt) Sekolah-Sekolah Menengah Se Malaysia 2003.
Kim Tae-Woo, Lee Kang-Guk & Hong Won-Hwa. (2012). Energy Consumption Characteristics Of The Elementary Schools In South Korea. Energy And Buildings, 54, 480-489.
Salleh, M.N.M. (2008). Reka Bentuk Sekolah Kebangsaan Daripada Aspek Kecekapan Tenaga: Kajian Kes Di Daerah Perak Tengah Sarjana Sains (Senibina), Universiti Sains Malaysia.
Kandar, M.Z., Ahmad, H. & Ariffin, S.A.I.S. (2009). Energy Conservation In Building: Study On Awareness And Practices Among Malaysian Goverment Employees. International Conference On Construction Industry 2009 (Icci 2009). Padang, Sumatera. Ninth Malaysia Plan. (2006-2010). Rancangan Malaysia Kesembilan,. In: Ekonomi, U. P. (Ed.). Putrajaya.
Nunnally, J.C. & Bernstein I.H. (1994). Psyhometric Theory, New York, Mcgraw-Hill.
Masoso, O. & L. Grobler, L. (2010). The Dark Side Of Occupants' Behavour On Building Energy Use. Energy And Buildings, 42,
173-177.
P. Hoes, P., Hensen, J.L.M., Loomans, M. G. L. C., De Vries, B. & Bourgeois, D. (2009). User Behaviour In Whole Building Simulation. Energy And Buildings, 41, 295-302.
Pallant, J. (2005). Spss Survival Manual; A Step By Step Guide To Data Analysis Using Spss For Windows, Sydney, Australia, Allen & Unwin.
Saidur, R. (2009). Energy Consumption, Energy Savings, And Emission Analysis In Malaysia Office Buildings. Energy Policy, 37,
4104-4113.
Rahman, A.M.A. (2000). Usaha-Usaha Mencapai Keselesaan Dalaman Di Malaysia, Pulau Pinang, Penerbit Usm. Sbci, S. B. A. C. I. (2012). Why Buildings. Available: Http://Www.Unep.Org/Sbci/Aboutsbci/Background.Asp.
Shengwei Wang, Chengchu Yan & Fu Xiao. (2012). Quantitative Energy Performance Assessment Methods For Existing Buildings.
Energy Buildings, 55, 873-888.
Wbcsd. (2009). Energy Efficiency In Buildings-Transforming The Market. Technical Report.
William Chung, Y.V. Hui & Y. Miu Lam. (2006). Benchmarking The Energy Efficiency Of Comercial Buildings. Applied Energy, 83, 1-14.
Y.R. Rashid, Y.R., Sulaiman, M. S., Aziz, A., Selamat, H., Yani, A.H.M. & Kandar, M. Z. (2011). Greening Goverment's Office Buildings: Pwd Malaysia Experiences. Procedia Engineering, 21, 1056-1060.