ISSN: 1992-8645 www.jatit.org E-ISSN: 1817-3195
VISUALLY LOSSLESS LEVEL VIDEO QUALITY
ASSESSMENT: NRDPF-VQA
1 SUBRAHMANYAM.CH, 2 Dr.D.VENKATA RAO, 3 Dr. N.USHA RANI
1
Research Scholar, , 2 Principal, 3 Professor & Head 1, 3
School of Electronics, Vignan’s Foundation for Science, Technology and Research University Vadlamudi, Guntur Dist, India
2
Narasaraopeta Institute of Engineeing & Technology, Narasaraopeta, Guntur Dist, India E-mail: [email protected] , [email protected] , [email protected]
ABSTRACT
In this paper, we proposed No-Reference subjective video quality assessment based on NRDPF-VQA metric and classification based metric are tested using MPEG-2, H.264/AVC, wireless, IP. We plot the Spearman’s Rank Order Correlation Coefficient (SROCC) between each of these features and human DMOS from the LIVE VQA database to ascertain how well the features correlate with human judgement quality especially for H.264.The results of 2-Alternative Forced Choice (2-AFC) are verified with reference to visually lossless level at a bit rate of 0.5 Mbps, 0.62 Mbps, 0.77 Mbps, 0.95 Mbps, 1.18 Mbps, 1.46 Mbps, 1.81 Mbps, 1.46 Mbps, 1.81Mbps and 2.25 Mbps. The videos are recorded in YUV420 format.
Keywords: No Reference, NRDPF-VQA, H.264, SROCC, DMO, YUV420
1.INTRODUCTION
The topic of NR VQA has been extensively studied and surveyed [11,15,21]. Here we conduct a brief review of progress in the area. Almost all prior NR VQA models have been ‘distortion specific’, meaning they are designed to predict the effect of a specific type of distortion on perceived quality. For example, Tan and Ghanbari, Vlachos, Suthaharan and Muijs and Kirenko proposed methods to assess blocking severity in distorted videos. Methods for assessing multiple coincident distortion types have also been contemplated. Caviedes and Oberti compute a set of blocking, blurring, and sharpness [21], Babu et. al. calculate a measure of blocking and packet loss[5] and Farias and Mitra [14] measures blockiness, bluriness and noisiness. Massidda et. al. propose an HVS based NR metric for blur detection in 2.5G/3G systems which measures blockiness, bluriness and moving artifacts [15]. Dosselmann and Yang estimate quality by measuring three types of impairments - noise, blocking and bit-error based color impairments [12]. Yang et. al. proposed an NR VQA algorithm that measures spatial distortion between the block under consideration and its motion compensated block in the previous frame, where temporal distortion is computed as a function of the mean of the motion vectors [16]. Kawayoke and Horita propose a model for NR VQA comprised of a frame quality measure and
correction, asymmetric tracking and mean value filtering [15].Yang et. al. measure dropping severity as a function of the number of frames dropped using time stamp information from the video stream [16]. Lu proposed a method to measure blur caused by video compression [8], Pastrana-Vidal and Gicquel proposed an algorithm to measure frame-drops [12], Yamada et. al. proposed an algorithm to measure error-concealment effectiveness [16] and Naccari et. al. proposed a model for channel induced distortion for H.264/AVC coded videos in [19]. Keimel et. al. proposed an NR VQA algorithm specifically for compressed HD videos [16] whereas Onget. al. proposed a measure to monitor the quality of streamed videos via by modeling the jerkiness between frames[19]. Saad and Bovik recently proposed a spatio-temporal natural scene statistics (NSS) model in the DCT domain that predicts the perceptual severity of MPEG-2, H.264, and two types of packet loss [21].
not even require pristine natural videos to serve as model ground truth. No training of any kind is used. While this may seem as an extreme paucity of information, the use of perceptually relevant quantities yields results that are very promising. Indeed, the resulting algorithm predicts human judgments of video quality better than the ubiquitous full reference PSNR on the LIVE VQA database [11].This new NRDPF- VQA approach is derived based on intrinsic statistical regularities that are observed in natural videos. Deviations from these regularities alter their visual impression. Quantifying measurements of regularity (or lack thereof) under a natural video statistic model makes it possible to develop a ‘quality analyzer’ which can predict the visual quality of the distorted video without any external knowledge and hence is zero shot.
The approach does not require any distortion knowledge, such as exemplar training videos containing anticipated distortions or human opinions of them. This is a significant advantage given that the creation of VQA databases containing distorted videos with co-registered human opinion scores is much more involved than is the creation of IQA databases [10] and [17]. Such a model, however, may be limited in that it can only capture common baseline characteristics of a specific collection of non-distorted content, and is thereby not able to universally represent video specific intrinsic characteristics. Also, the construction of such a database requires the unbiased selection and maintenance of hundreds of natural undistorted videos. This also raises the question of how many exemplar videos are needed to design an accurate natural video model, and how distinctive these need to be relative to each other and to the world of videos. Finally, given the limitations of image/video camera capture, distortions are inevitably introduced in the capture process and hence the procurement of perfectly natural `pristine' videos is practically impossible. The topic of NR VQA has been extensively studied and surveyed [11,15,19]. All of the blind VQA algorithms require knowledge of (one of possibly multiple) distortion types, or of the artifacts introduced by them, or of human opinion scores on distorted images. There exists no blind VQA model to date which can predict video quality in the absence of such strong a priori information.
In this paper, we explain the underlying ‘quality aware’ natural video statistics model in the space-time domain and describe perceptually relevant temporal features that are used to model inter sub
band correlations over both local and global time spans. The overall model is the basis on an algorithm for predicting video quality that is shown to correlate well with human judgments of visual quality. We also compare the performance to state-of-the-art FR and NR VQA approaches. Before we describe the model in detail, we review relevant prior work in the area of VQA.
2. LITERATURE SURVEY
Most existing blind VQA models proposed in the past assume that the video whose quality is being assessed is afflicted by a particular kind of distortion [7,20,21]. These approaches extract distortion specific features that relate to loss of visual quality, such as edge-strength at block-boundaries. However, a few general purpose approaches for NR VQA have been proposed recently. Li devised a set of heuristic measures to characterize visual quality in terms of edge sharpness, random noise and structural noise [21] while Gabarda and Cristobal, modeled anisotropies in images using Renyi entropy [18]. The authors in [17] use gabor filter based local appearance descriptors to form a visual codebook, and learn DMOS score vector, associating each word with a quality score. However, in the process of visual codebook formation, each feature vector associated with an image patch is labeled by DMOS assigned to the entire image. This is questionable as each image patch can present a different level of quality depending on the distortion process the image is afflicted with. In particular, local distortions such as packet loss might afflict only a few video patches. Also, the approach is computationally expensive limiting its applicability in real time applications. Tang et al. proposed an approach which learns an ensemble of regressors trained on three different groups of features - natural video statistics, distortion texture statistics and blur/noise statistics. Another approach [12] is based on a hybrid of curvelet, wavelet and cosine transforms. Although these approaches work on a variety of distortions, each set of features (in the first approach) and transforms (in the second) caters only to certain kinds of distortion processes. This limits the applicability of their framework to new distortions.
ISSN: 1992-8645 www.jatit.org E-ISSN: 1817-3195
[13] and very recent work on NSS based NR VQA
[20] have led us to the conclusion that visual features derived from NSS lead to particularly potent and simple VQA models [15,20]. Recently proposed NSS based NR VQA model, dubbed VIDEO BLIINDS, deploys summary statistics derived from an NSS wavelet coefficient model, using a two stage framework for VQA: distortion-identification followed by distortion-specific VQA [18]. The Video-BLIINDS index performs quite well on the LIVE VQA database [15], achieving statistical parity with the full-reference structural similarity (SSIM) index [14]. A complementary approach developed at the same time; named Blind Image Notator using DCT Statistics (Video-BLIINDS index) is a pragmatic approach to NR VQA that operates in the DCT domain, where a small number of features are computed from an NSS model of block DCT coefficients [10]. Efficient NSS features are calculated and fed to a regression function that delivers accurate VQA predictions. Video BLIINDS is a single-stage algorithm that also delivers highly competitive VQA prediction power. Although Video BLIINDS index is multiscale, the small number of feature types (4) allows for efficient computation of visual quality and hence the index is attractive for practical applications. While both STMAD and Video BLIINDS deliver top NR VQA performance (till to date), each of them has certain limitations [21]. The large number of features that Video BLIINDS computes implies that it may be difficult to compute in real time. Although Video BLIINDS is more efficient than STMAD, it requires nonlinear sorting of block based NSS features, which slows it considerably. In our continued search for fast and efficient high performance NR-VQA indices, we have designed NRDPF-VQA algorithm to find the quality of the video without reference.
3. IMPLEMENTATION OF NRDPF-VQA
The approach for the NR VQA that we have developed can be summarized as follows. Given a (possibly distorted) image, first compute locally normalized luminance via local mean subtraction and divisive normalization [8,9,19,21]. The following are the equations to applied to a given intensity video.
.
.
(1) Where
∑ , 1,
,
(2)
, and , are horizontal and vertical motion vectors at pixel (i,j) respectively, w is the window of dimension m X m over which the localized computation of the tensor is performed.
(3)
|, ,
||(4)
/ (5)
/
/ (6)
Γ! " #
%#
z>0 (7)&: (
Ii, j Ii, j , 1 Ii, j
(8): (
Ii, j Ii , 1, j Ii, j
(9)-: (
Ii, j Ii , 1, j , 1 Ii, j
(10)-: (
Ii, j Ii , 1, j 1 Ii, j
(11)&: (
(
Ii, j Ii 1, j , Ii , 1, j
Ii, j 1 Ii, j , 1
(12)-
: (
(
Ii, j
Ii, j ,
Ii , 1, j , 1 Ii, j , 1 Ii , 1, j
(13)-
: (
(
Ii, j
Ii 1, j 1 ,
Ii , 1, j , 1 Ii 1, j , 1 Ii ,
1, j 1
(14)., log 2, , 3
(15)-
: (
Ji, j Ji, j , 1 Ji, j
(16)-
: (
Ji, j Ji , 1, j Ji, j
(17)-
: (
Ji, j Ji , 1, j , 1 Ji, j
(18)-
!: (
Ji, j Ji , 1, j 1 Ji, j
(19)
-
": (
(
Ji 1, j , Ji , 1, j Ji, j
-
$: (
(
Ji, j
Ji 1, j 1 ,
Ji , 1, j , 1 Ji 1, j , 1 Ji ,
1, j 1
(22)The equations from (8) to (22) represent the features of the distortion patches. It also observed that the normalized luminance values strongly tend towards a unit normal Gaussian characteristic for video (low bit-rate) [27].
567, 8
%&,'(&,')&,' * (23)μi, j ∑
/0./∑
,-.,:
,2
,2,
(24);7, 8
∑
/0./∑
,-.,:
,2
,2, μi, j
1 (25)<=; ?, ;
1 123 4@=A
|5|2(26)
?
//6 (27)ΓB " #
7%#
a>0 (28)&, 567, 8567, 8 , C
(29), 567, 8567 , C, 8
(30)-1, 567, 8567 , C, 8 , C
(31)-2, 567, 8567 , C, 8 C
for i Є {1,2,…,M} and j Є {1,2,…,N} (32)<=, E
859 | | : | | ;<= x<0 (33)<F=; G, ;
>1, ;
?1H I
@ 2 23 4@=A
52 @@ 2 23 4
@=A
25 @x≥0 (34) >
J
/@/A (35) ?J
B/@/A (36)K
? >1/@/A (37)L
C ∑ E F (38)L
? ∑ …. ….E F (39)M
L
C (40)M
1NL
L
C (41)M
OL
1OL
, L
C (42)M
GNPL
QPL
1, CNL
L
C (43)Thus for each paired product, 36 parameters (6 parameters/orientation X 6 orientations) are computed, yielding the next set of features.
Video
[image:4.595.87.530.252.749.2]
Video Quality score
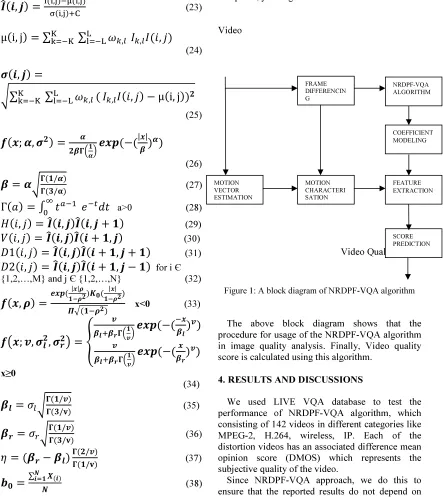
Figure 1: A block diagram of NRDPF-VQA algorithm
The above block diagram shows that the procedure for usage of the NRDPF-VQA algorithm in image quality analysis. Finally, Video quality score is calculated using this algorithm.
4. RESULTS AND DISCUSSIONS
We used LIVE VQA database to test the performance of NRDPF-VQA algorithm, which consisting of 142 videos in different categories like MPEG-2, H.264, wireless, IP. Each of the distortion videos has an associated difference mean opinion score (DMOS) which represents the subjective quality of the video.
Since NRDPF-VQA approach, we do this to ensure that the reported results do not depend on MOTION
VECTOR ESTIMATION
MOTION CHARACTERI SATION FRAME DIFFERENCIN G
ISSN: 1992-8645 www.jatit.org E-ISSN: 1817-3195
features extracted from known content, which can
artificially improve performance. Further, we repeat this random test procedure LIVE VQA database, in order to eliminate performance bias.
Output Video
Spearman correlation coefficients
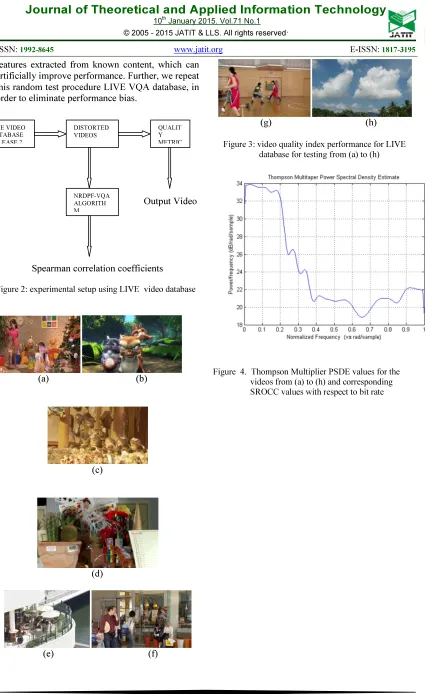
[image:5.595.92.527.68.762.2]Figure 2: experimental setup using LIVE video database
(a) (b)
(c)
(d)
(e) (f)
[image:5.595.317.518.240.409.2](g) (h)
[image:5.595.89.283.379.737.2]Figure 3: video quality index performance for LIVE database for testing from (a) to (h)
Figure 4. Thompson Multiplier PSDE values for the videos from (a) to (h) and corresponding SROCC values with respect to bit rate
LIVE VIDEO DATABASE RELEASE 2
NRDPF-VQA ALGORITH M DISTORTED VIDEOS
Table I
Results Of 2-Alternative Forced Choice (Afc) Task:
VIDEO
(Mbps) 0.50 0.62 0.77 0.95 1.18 1.46 1.81 2.25
VIDEO a 1 1 1 1 1 0 1 0
VIDEO b 1 0 1 1 1 0 1 1
VIDEO c 1 1 0 1 0 1 0 1
VIDEO d 0 1 0 1 1 0 1 0
VIDEO e 1 0 1 1 1 1 1 1
VIDEO f 1 1 1 1 1 1 1 1
VIDEO g 1 1 1 1 0 1 1 1
VIDEO h 1 1 1 1 0 1 0 1
Table II
Ground Truth And Nrdpf-Vqa For Videos (A), (C), (D), (F) And (H) From Live Vqa Database (Only Selected)
Video a c d f h
Actual 0.9500 1.4600 1.1800 1.1800 0.5000 VL bit-rate 1.0923 1.2651 1.1981 1.0189 0.9365 NRDPF-VQA
(Proposed)
1.0021 1.3642 1.1842 1.1792 0.6245
Table III
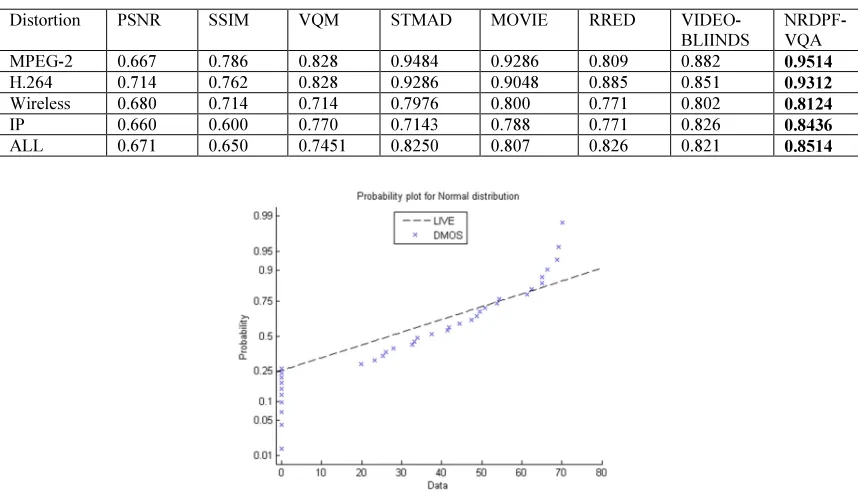
Median Srocc Correlations On Every Possible Combination Of Train/Test Set Splits (Subjective Dmos Vs Nrdpf-Vqa Dmos). 80% Of Content Used For Tarining
Distortion PSNR SSIM VQM STMAD MOVIE RRED VIDEO-BLIINDS
NRDPF-VQA MPEG-2 0.667 0.786 0.828 0.9484 0.9286 0.809 0.882 0.9514
H.264 0.714 0.762 0.828 0.9286 0.9048 0.885 0.851 0.9312
Wireless 0.680 0.714 0.714 0.7976 0.800 0.771 0.802 0.8124
IP 0.660 0.600 0.770 0.7143 0.788 0.771 0.826 0.8436
ALL 0.671 0.650 0.7451 0.8250 0.807 0.826 0.821 0.8514
[image:6.595.83.512.431.677.2]ISSN: 1992-8645 www.jatit.org E-ISSN: 1817-3195
5. CONCLUSION
We proposed No reference Distortion Patch Feature Video Quality Assessment algorithm, which perform better results compared with previous algorithms. We plot the Spearman’s Rank Order Correlation Coefficient (SROCC) between each of these features and human DMOS from the LIVE VQA database to ascertain how well the features correlate with human judgement quality especially for H.264. Finally, the results of 2-Alternative Forced Choice (2-AFC) are verified with reference to visually lossless level at a bit rate of 0.5 Mbps, 0.62 Mbps, 0.77 Mbps, 0.95 Mbps, 1.18 Mbps, 1.46 Mbps, 1.81 Mbps, 1.46 Mbps, 1.81Mbps and 2.25 Mbps.
REFERENCES
[1] Chou, C.H. and Li, Y.C. (1995) A perceptually tuned subband image coder based on the measure of just-noticeable-distortion profile. IEEE Trans. Circuits Syst. Video Technol., 5, 467–476.
[2] Ahumada, A.J. and Peterson, H.A. (1992) Luminance-Model-Based DCT Quantization for Color Image Compression. SPIE Conf. on Human Vision, Visual Processing, and Digital Display III, Vol. 1666, pp. 365–374, SPIE, San Diego.
[3] Watson, A.B. (1993) DCT Quantization Matrices Visually Optimized for Individual Images. Proc. SPIE, pp. 202–216.
[4] Seshadrinathan, K., Soundararajan, R., Bovik, A.C. and Cormack, L.K. (2010) Study of subjective and objective quality assessment of video. IEEE Trans. Image Process., 19, 1427–1441.
[5] Seshadrinathan, K. and Bovik, A.C. (2010) Motion tuned spatiotemporal quality assessment of natural videos. IEEETrans. Image Process., 19, 335–350.
[6] Wang, Z. and Li, Q. (2007) Video quality assessment using a statistical model of human visual speed perception. JOSA, 24, B61–B69.
[7] Ninassi, A., Le Meur, O., Le Callet, P. and Barba, D. (2009) Considering temporal variations of spatial visual distortions in video quality assessment. IEEE J. Sel. Topics Signal Process., 3, 253–265.
[8] Watson, A.B., Hu, J. and McGowan III, J.F. (2001) Digital video quality metric based on human vision. J. Electron. Imaging, 10, 20. [9] Barkowsky, M., Bialkowski, J., Eskofier, B.,
Bitto, R. and Kaup, A. (2009) Temporal trajectory aware video quality measure.
IEEE J. Sel. Top. Signal Process., 3, 266– 279.
[10] Hekstra, A.P., Beerends, J.G., Ledermann, D., De Caluwe, F.E.,Kohler, S., Koenen, R.H., Rihs, S., Ehrsam, M. and Schlauss,D. (2002) PVQM—A perceptual video quality measure. Signal Process.: Image commun., 17, 781–798.
[11] Sheikh, H.R. and Bovik, A.C. (2006) Image information and visual quality. IEEE Trans. Image Process., 15, 430–444.
[12] Yang, X.K., Ling,W.S., Lu, Z.K., Ong, E.P. andYao, S.S. (2005)Just noticeable distortion model and its applications in video coding. Signal Process.: Image commun., 20, 662–680.
[13] Chin,Y.J. and Berger,T. (1999)Asoftware-only videocodec using pixelwise conditional differential replenishment and perceptual enhancements. IEEE Trans. Circuits Syst. Video Technol., 9, 438–450.
[14] Chou, C.H. and Chen, C.W. (1996) A perceptually optimized 3-D subband codec for video communication over wireless channels.IEEE Trans. Circuits Syst. Video Technol., 6, 143–156.
[15] A. Mittal, R. Soundararajan and A. C. Bovik, “Making a Completely Blind Image Quality Analyzer”, IEEE Signal processing Letters, pp. 209-212, vol. 22, no. 3, March 2013.
[16] A. K. Moorthy and A. C. Bovik, “Blind Image Quality Assessment: From Scene Statistics to Perceptual Quality”, IEEE Transactions Image Processing, pp. 3350-3364, vol. 20, no. 12, 2011.
[17] A. K. Moorthy and A. C. Bovik, “A Two-step Framework for Constructing Blind Image Quality Indice”. IEEE Signal Processing Letters, pp. 587-599, vol. 17, no. 5, May 2010.
[19] M. A. Saad, A. C. Bovik and C. Charrier, “A DCT Statistics-Based Blind Image Quality Index”, IEEE Signal Processing Letters, pp. 583-586, vol. 17, no. 6, June 2010.
[20] H. R. Sheikh, A. C. Bovik, and L. K. Cormack, “No-Reference Quality Assessment Using Natural Scene Statistics: JPEG2000,” IEEE Transactions on Image Processing, vol. 14, no. 12, December 2005. [21] A.Mittal, G.S.Muralidhar, J.Ghosh and A.C.
Bovik, “Blind image quality assessment without human training using latent quality factors”, IEEE Signal Processing Letters", pp 75-78, Vol 19, no 2, February 2012.