A TECHNIQUE FOR CLASSIFICATION OF HIGH
RESOLUTION SATELLITE IMAGES USING OBJECT-BASED
SEGMENTATION
1ANKAYARKANNI, 2EZIL SAM LENI
1Research Scholar,Sathyabama University 2Professor,SRR Engg. College
E-mail: [email protected], [email protected]
ABSTRACT
Segmentation and classification of satellite imagery are a challenging problem due to the fact that it is not feasible to execute this task on a pixel-by-pixel basis.This paper proposes an efficient image classification technique for satellite images with the aid of KFCM and artificial neural network. The proposed classification technique is made of four phases namely, pre-processing, fragmentation and final classification using neural network. In processing stage, the input image is put to a series of processing phases which includes mean filtering, contrast adjustment and laplacian filter. The pre-processing has the effect of modifying the input image into suitable image for fragmentation. After the preprocessing, the image is fragmentedby means of the kernel based fuzzy c-means(KFCM) clustering algorithm. The resultant image obtained is segmented into clusters. NN is trained according to the data given. The resultant image is given as input to the trained NN, which classifies the satellite images into road, building and vegetation regions according to the trained data and pixel values.The experimental results have demonstrated the effectiveness of the proposed classification technique in classifying into road, building and vegetation regions. The experimentation is carried out using the satellite images and the analysis ensures that the performance of the proposed technique is improved compared with k-means clustering algorithm.
Keywords: Segmentation,Classification, KFCM, Satellite image, Neural Network, Road, Building, Vegetation
1. INTRODUCTION WITH PROBLEM
IDENTIFICATION
Remote sensing is a multitalented tool for investigating the Earth and it entails the use of instruments or sensors to “capture” the spectral and spatial relations of objects and materials perceptible at a distance. Aerial and satellite images, called remotely sensed images, allow exact mapping of land cover and make landscape traits comprehensible on regional, continental, and even global scales. It has been comprehensively made use of for the supervision of the earth surface to assess the modifications in land use and land cover [1] and can also be employed in formation of mapping products for military and civil applications, assessment of ecological impairment, and supervision of land use, emission management, metropolitan planning, development control, soil
appraisal and crop yield evaluation [2]. It is also made use of for mapping and categorization of land cover traits such as vegetation, soil, water and forests and acts as a replacement for customary methods that execute land cover categorization by means of costly and time-intensive field investigations [3].Of late, investigation has moved forward in computer vision methods executed on remotely sensed images like fragmentation, object oriented and knowledge-based techniques for categorization of high-resolution imagery [4].
partition remote sensing images into meaningful objects, and assessing their spatial, spectral and temporal characteristics. Its basic step is segmentation. It includes the assignment attributes to the segment that usually express geographic information, e.g. textural, shape and neighborhood properties [5]. High resolution remote sensing image segmentation is a great challenge in terms of potential applications, but also because of the difficulty of the task. Indeed, metric and sub-metric resolution images allow to access landscape features which are difficult to extract and understand in a fully automatic way. These features are often related to objects and not to individual pixels as it was the case for metric resolution images. This is why the paradigm of Object-Based Image Analysis has been introduced in the recent years. Nevertheless, existing algorithms still fail to produce pertinent segmentation results in a fully automatic way [6].
The object-oriented representation was mainly based on the image semantics and the explicit knowledge of the human expert. In order to classify each element of the image into the appropriate class, the knowledge based expert system represented the definitions of the classes through rules and heuristics, which an expert explicitly declares and develops within the system [7]. As a result, more complex methods for image classification have been implemented and many more image features can be used for the classification step [8]. Very recently a new methodology called Object Oriented Image Analysis was introduced, integrating the low-level knowledge-free segmentation with the high-level knowledge-based fuzzy classification methods [9]. The numerous genuine applications of remote-sensing data include: (i) monitoring forest tree species; (ii) estimating the status of a growing crop; (iii) defining urban prototypes; (iv) demarcating the scope of flooding; (v) distinguishing rock varieties and (vi) spotting zones of deforestation [1].
Satellite image classification includes mainly two steps, segmentation step and classification step [10]. The chief objective of image segmentation is to partition the image into parts of strong correlation with objects or areas of the real world contained in the image [11]. Image segmentation is typically carried out as a pre-processing step for some land-cover and land-use classification systems [12, 13, and 14]. Image classification can be defined as processing techniques that apply quantitative methods to the
values in a digital yield or remotely sensed scene to group pixels with identical digital number values into feature classes or categories. The categorized data obtained is used to create thematic maps of the land cover present in an image [15, 16]. The crucial steps of image categorization comprise (i) deciding a fitting categorization mechanism, (ii) choosing guidance models, (iii) image preprocessing, (iv) mining characteristics, (v) choosing appropriate categorization methods, (vi) post-categorization processing, and (vii) precision estimation. The user’s need, scale of the study area, economic condition, and analyst’s skills are significant factors that influence the selection of remotely sensed data, the design of the classification process, and the quality of the results. In general, the multispectral data utilized to perform the classification and, indeed, the spectral patterns present within the data for each pixel are used as the numerical basis for categorization [17].
For classifying the satellite images, lot of classification algorithms presented in data mining and Artificial Intelligence have been extensively used. In spite of all the advantages, classification of remotely-sensed imagery is a challenging subject because of the complexity of landscapes and the spatial and spectral resolution of the images being employed. Multispectral remotely sensed images comprise information collected over a large range of variation on frequencies and these frequencies vary over diverse regions [18, 19, 20]. Hence, proficient scheme capable of effectively deploying the spectral and spatial information present in the remote sensing data can improve the classification performance appreciably, compared to the conventional non-contextual information-based methods [21]. Generally, a classification system creates a classification map of the identifiable or meaningful features or classes of land cover types in a scene [22, 23]. A considerable number of research efforts have been made to take advantage of neighboring pixel information [18, 24, 25] and applied for the classification of remotely sensed data.
the image through the mean filter also enhances the image quality. The pre-processed image is segmented using the KFCM clustering algorithm. Training data selection is carried out for ANN and finally, classification of the multispectral satellite images using ANN is done based on the trained data.
The rest of the paper is organized as follows: A brief review of researches related to the proposed technique is presented in section 2. The contribution of the research is detailed in section 3. The proposed classification technique is presented in Section 4. The experimental results and discussion are given in Section 5. The conclusions are given in Section 6.
2. REVIEW OF RECENT WORKS
Literature presents a handful of researches for classification of satellite images and has been a hot topic due to its significant applications. Here, we present a brief review of some of the techniques presented in the literature for classifying the satellite images.
Zhao Meng et al. [31] have presented high-resolution satellite image classification and segmentation using Laplacian graph energy. They proposed hierarchical segmentation methods which applied Laplacian graph energy as a generic measure to reduce the number of levels and regions in the hierarchy by an order of magnitude with little or no loss in performance. They also applied the method in remote sensing image analysis. R. Gaetano et al. [32] have presented morphological road segmentation in urban areas from high resolution satellite images. They proposed a technique for road segmentation that only relies on this domain and a insight on the use of morphological image analysis for road extraction in complex urban scenarios. The keypoint of the technique was the use of skeletons as powerful descriptors for road objects: the proposed method was based on an ad-hoc skeletonization procedure that enhances the linear structure of road segments, and extracts road objects by detecting their skeletons and associating each of them with a region of the image.
Gidudu Anthony et al. [26] proposed a ‘committee’ of classifiers which was used to determine the final classification output. Two of the key components of an ensemble system is that there should be diversity among classifiers and a
mechanism through which the results are combined. In the paper, the members of the ensemble system included Linear SVM, Gaussian (Radial Basis Function) SVM and Quadratic SVM. The final output was determined through a simple majority vote of the individual classifiers. From the results obtained it was observed that the final derived map generated by an ensemble system can potentially improve on the results derived from the individual classifiers making up the ensemble system. The ensemble system classification accuracy was better than the linear and quadratic SVM result but less than that of the RBF SVM.
D Chutia and DK Bhattacharyya [27] presented an object oriented feature extraction approach in order to classify the linear features like drainage, roads etc. from high resolution Indian satellite imageries. It started with the multiresolution segmentations of image objects for optimal separation and representation of image regions or objects. Fuzzy membership functions were defined for a selected set of image object parameters such as mean, ratio, shape index, area etc. for representation of required image objects. Experiment was carried out for both panchromatic (CARTOSAT-I) and multispectral (IRSP6 LISS IV) Indian satellite imageries. Experimental results showed that the extraction of linear features was achieved in a satisfactory level through proper segmentation and appropriate definition and representation of key parameters of image objects.
Alberto Fernándeza et al. [28] aimed to improve the performance of fuzzyrule based classification systems on imbalanced domains, increasing the granularity of the fuzzy partitions on the boundary areas between the classes, in order to obtain a better separability. They proposed the use of a hierarchical fuzzy-rule based classification system, that was based on the refinement of a simple linguistic fuzzy model by means of the extension of the structure of the knowledge base in a hierarchical way and the use of a genetic rule selection process in order to get a compact and accurate model. The good performance was shown by the approach through an extensive experimental study carried out over a large collection of imbalanced data-sets.
filtered out and afterwards, buildings were segmented. In the next step, according to the fuzzy membership functions obtained from structural context, the roof of each building was segmented from building walls. To make a three dimensional model of buildings, the side of building walls represent their height was manually selected by the human operator and other buildings were modeled by the set angle. To benchmark the algorithm it was applied to some images from Sydney, Australia and the experimental result showed that the method could efficiently model the buildings which had at least two sides obvious in the satellite image.
So-Ra Kim et al. [30] have represented forest cover classification by optimal segmentation of high resolution satellite imagery. They investigated whether high-resolution satellite imagery was suitable for preparing a detailed digital forest cover map that discriminates forest cover at the tree species level. They tried to reclassified each segment of pixels were using a segment-based classification (SBC) with a majority rule. The pixel-based classification (PBC) suffered from the “salt-and-pepper effect” and performed poorly in the classification of forest cover types, whereas the SBC helped to attenuate the effect and notably improved the classification accuracy. As resultant SBC proved to be more suitable for classifying and delineating forest cover using high-resolution satellite images.
Liang Hong et al. [33] have presented a segmentation method of high resolution remote sensing image based on multi-feature object-oriented Markov random fields model. A methodology base on multi-feature object-oriented MRF (MFOMRF) was proposed in order to obtain precise segmentation of high resolution satellite image. The proposed method was made up of two blocks: (1) Mean-Shift algorithm was employed to obtain the over-segmentation results and the primary processing units are generated, based on which the object adjacent graph (OAG) can be constructed. (2) The generation of objects by overly segmented, the spectral, textural, and shape feature are extracted for each node in the OAG, all of these features are constructed in a feature vector, based on which the feature model was defined on the OAG, and the neighbor system, potential cliques and energy functions of OAG are exploited in the labeling model. The proposed segmentation method was evaluated on high resolution remote sensed image data set-GeoEye, and the experimental results verified that MFOMRF had the capability to
obtain better segmentation results, especially for textural and shape richer images.
3. CONTRIBUTION OF OUR RESEARCH
The main contribution of the proposed approach is histogram based initial segmentation using kernel based fuzzy c-means clustering. The segmentation process uses six color spaces namely, RGB, HSV, YIQ, XYZ, LAB, LUV based statistical measures and histogram based maximum intensity.
• In classification process,neural network classifier is used for the road, tree and building classification. • Finally, k-means with NN is used for the
comparative analysis.
4. PROPOSED TECHNIQUE FOR
CLASSIFICATION OF SATELLITE IMAGES USING KFCM WITH ANN CLASSIFIER
This section describes the proposed technique of classification of satellite images using KFCM segmentation with neural network classifier. Initially in our proposed classification technique, pre-processing is done where the input image is subjected to a set of pre-processing steps such as mean filtering. The pre-processed image is segmented using the Kernel based fuzzy c-means algorithm. Training data selection is carried out for NN and finally, classification of the multispectral satellite images using neural network is done based on the trained data and the centroid pixel values. The block diagram of the proposed technique is given in the figure 1 below.
Fig: 1 Overall block diagram of our proposed approach 4.1 Pre-processing
guidance and investigation. The input multispectral satellite image is subjected to a series of pre-processing stages so that the image gets modified appropriately for added processing. Here we employ two step preprocessing procedure in which first the input image is passed through a mean filter to reduce the noise and get a better image fit for segmentation. Passing the image through the mean filter also increases the image eminence. Subsequently, the contrast adjustment and sharpening process is done using laplacian fitter. . Subsequently, we adapt the image from the RGB model to Lab color space Image which makes the image more robust to be get divided by the application of clustering method.
4.2 Histogram based satellite image segmentation of Road, vegetation and building
The traditional histogram-based segmentation algorithm was not considered the texture properties for segmenting the satellite image. Hence, the histogram-based segmentation algorithm is modified such a way that the texture histogram is used to improve the object segmentation in high resolution satellite images. In the proposed approach, the initial satellite image segmentation process is done by following steps,
Step 1: Color space initialization
After preprocessing step, the satellite images are converted into six color spaces RGB, HSV, YIQ, XYZ, LAB, and LUV and each color space is included three colors. Each color space has an interesting property, which can efficiently be taken into account in order to make more reliable the final segmentation procedure. Subsequently, the histogram is determined for every color spaces. To determine the histogram, we find out neighborhood pixel of every pixel.
Step 2: Initial clustering
Consequently, the six color spaces based pixels are grouped together into different clusters as like road, vegetation and building using kernel fuzzy c-means clustering and which clusters are based six color spaces namely the RGB, HSV, YIQ, XYZ, LAB, and LUV. From the clusters, we find out the centroid value based six color spaces. The KFCM minimizes the following objective function
2 1 1
)
(
)
(
)
,
(
∑∑
= =−
=
c i n k i k m ikm
U
V
u
x
v
J
φ
φ
(1)Where,
∑
= − − − −−
−
=
c l m i j m i j ijo
x
k
o
x
k
u
1 1 / 1 1 / 1))
,
(
1
(
))
,
(
1
(
∑
∑
= ==
nl l i
m il n
l l i l m il i
o
x
k
u
x
o
x
k
u
o
1 1)
,
(
)
,
(
Step 3: Histogram based new data formation:
In this step, we have generated new data which is based on the histogram based six color spaces namely,RGB,HSV,YIQ,XYZ,LAB and LUV.A histogram is a graphical representation showing a visual impression of the distribution of data. In our application, this local histogram is equally re-quantized (for each of the three color
channels) in a
N
b=
5
×
5
×
5
=
125
binsdescriptor, computed on an over-lapping squared
fixed-size
(
N
w=
7
)
neighborhood centered around the pixel to be classified. For example,Estimation, for each pixel
x
of theN
b=
q
3binsdescriptor (q= 5) in the RGB color space. The RGB
color cube is first divided into
N
b=
q
3 equalizedsmaller boxes (orbins). Each
R
x,
G
x,
B
x colorvalue associated to each pixel contained in a
(squared) neighborhood region (of size w w
N
N
×
) centered at
x
, increments (+1) a particular bin. The set of bin values represents the (non-normalized) bin descriptor. We then divide all values of this
N
bins descriptor by
(
w w)
N
N
×
in order to ensure that the sum of these values integrates to one.
Mathematically, let
{
0
,...,
1
}
)
(
x
∈
N
b−
b
which denotes the bit index associated with the color vector
y
(x
)
at pixellocation x. Let
N
(
x
)
be the set of pixel locations within the squared neighborhood region (offixed-size
N
w×
N
w) centered at pixel location X. Anestimate
(
)
=
{
(
;
)
}
=
0
,...,
b−1N
n
x
n
h
x
h
of 125 bins sector descriptor, characterizing the color distribution for each pixel to be classified, is given by the following standard bin counting procedure
Where
δ
the Kronecker delta is function and2
)
/(
1
N
w=
Κ
is a normalization constantensuring
∑
01(
;
)
=
1
− = b N n
x
n
h
.The local histogram,as contrasted to the global histogram, summarizes the entire image. A local histogram samples an area of particular interest lying within the image, a spatial subset. The histogram shows that the values are within an extremely narrow range of values. In contrast to the global histogram, this local histogram examines a nearly solid tone. Even without seeing the selection, one could guess the shape, location, and size of the selection. This estimation can be quickly computed by using a more coarsely requantized color space and then computing the bin index that represents each re-quantized color. From the clustering process, we get new data is generated and this data is based on six color spaces namely, HSV, YIQ, XYZ, LAB, and LUV.
Step: 4 Final clustering using KFCM
Finally, these (125-bin) descriptors are grouped together into different clusters such as road, building and vegetation by the K-FCM algorithm. This simple segmentation process of the
input image into
K
1classes is repeated for differentcolor spaces which can be viewed as different image (the channels are represented by the different color spaces). In our approach, we use
s
N
segmentations provided by the
N
s=
6
colorspaces, namely the RGB, HSV, YIQ, XYZ, LAB, and LUV. The six color spaces are given into the input to KFCM. The 125-bin descriptors are grouped together into different clusters (corresponding to each class of the image) by the K-FCM algorithm. Subsequently, we find out the centroid value of every cluster in the Kernel Fuzzy C Means algorithm from equation (1). Finally, we give the satellite image to classification process and the resultant classifier gives road or vegetation or building.
4.3 Feature Vector Formation
Basically, the pixel wise feature vector based classification is taken too much time in classification process. Therefore, to solve this problem we use statistical measures such as mean and variance and histogram based maximum intensity for the classification process.
Step: 1 Taking segment label
• In this step, we have taken segment label which are based on six color spaces namely the RGB, HSV, YIQ, XYZ, LAB, and LUV.
Step: 2 Statistical measures based mean and variance
• In this step, we have taken two statistical measures such as mean and variance and which measures are calculated based pixel wise.
∑
==
N i iN
p
M
Mean
1 (2) Where,
p
iis thei
thpixel
N
is the number of pixel∑
==
N i iN
p
Variance
1σ
(3)Step: 3 Calculate the Histogram based maximum intensity
• Histogram based maximum intensity based on the 6 color spaces, namely the RGB, HSV, YIQ, XYZ, LAB, and LUV.
From above the three features, we have generated new feature vector for the classification process,
= V V V U U U L L L B B B A A A L L L Z Z Z Y Y Y X X X Q Q Q I I I Y Y Y V V V S S S H H H B B B G G G R R R set H V M H V M H V M H V M H V M H V M H V M H V M H V M H V M H V M H V M H V M H V M H V M H V M H V M H V M f , , , , , , , , , , , , , , , , , , , , , , , , , , , , , , , , , , , , , , , , , , , , , , , , , , , , ,
4.4 Classification Using ANN
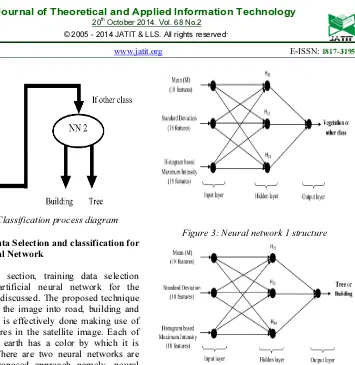
Figure 2: Classification process diagram
4.5 Training Data Selection and classification for Artificial Neural Network
[image:7.595.152.507.64.429.2]In this section, training data selection given to the artificial neural network for the classification is discussed. The proposed technique aims to classify the image into road, building and vegetation. This is effectively done making use of the colour features in the satellite image. Each of the elements in earth has a color by which it is distinguished. There are two neural networks are used in our proposed approach namely, neural network1 and neural network 2 as shown in figure 3 and figure 4. By default we have set the neural network to get the output for vegetation. If we need any other output it will go to another class which is in another neural network and that neural network will provide necessary output. The six color spaces such as mean (18 features), variance (18 features) and histogram based maximum intensity feature (18 features) are given into the artificial neural network1.When each entry of the sample set is presented to the network, the network examines its output response to the sample input pattern. The output response is then compared to the known and desired output and the error value is calculated. Based on the error, the connection weights are adjusted. The back propagation algorithm is a generalization of the least mean square algorithm that modifies network weights to minimize the mean squared error between the desired and actual outputs of the network. Back propagation uses supervised learning in which the network is trained using data for which inputs as well as desired outputs are known. Once trained, the network weights are frozen and can be used to compute output vales for new input samples.
Figure 3: Neural network 1 structure
Figure 4: Neural network 2 structure
The neural network1 and neural network 2 processes have explained into following major steps. The training steps involved in neural network 1 and neural network 2 are as follows,
Step 1:
Initialize the input, output and weight of each neuron. Here, the 6 color spaces based Mean, Variance and histogram based maximum intensity features are input of the network and tree or other classes are the output of the network.
Step 2:
Each node
H
i the hidden layer receives the signal)
ln(
H
i according to:∑
=
+
=
N
j
nl j i
i
P
W
H
1
)
ln(
η
(4)Then passed through the bipolar sigmoid activation function:
1
))
exp(
1
(
2
)
(
−
−
+
=
i
P
T
The output of the activation function
f
(ln(
H
i))
is then broadcast all of the neurons to the output layer:
)
(
)
(
1
2
D
n
W
output
D
kN
n nl k
k
∑
=
+
=
η
(6)Where
η
i andη
k are the biases in the hiddenlayer and the output layer. Step 3:
The inputs of training dataset are the 6 color spaces based Mean, Variance and histogram based maximum intensity features to classifier and determine the error function as follows.
output
D
et
t
D
E
v=
(
k)
arg
−
(
k)
(7)In eqn (7)
(
D
k)
t
arg
et
-is the target output andoutput
D
k)
(
-is the network outputStep 4:
Adjust the weights of all neurons as
w
w
w
=
+
∆
,where,∆
w
is the change in weight which can be determined as follows,v k
E
D
w
=
β
.
.
∆
(8)In Eq. (8),
β
is the learning rate, usually it ranges from 0 to 1.Step 5:
Repeat the process from step 2, until error gets minimized to a least value i.e
1
.
0
<
vE
5. RESULT AND DISCUSSIONThe proposed technique for classification of satellite images is implemented in MATLAB. In this section, we discuss and analyze the proposed approach. The sub-section 5.1 describes the overall experimentation and the results of the proposed approach. And, in the section 5.2, the evaluation results are presented which shows that the proposed approach is more efficient compared to the k-means technique.
5.1. Experimental results
The broad objective of this section is to dwell deep into the amazing outcomes of the proposed technique. In this categorization method, we have at first executed pre-processing subjecting the input image a series of pre-processing phases so as to get the image duly modified for fragmentation. Thus, the two phase preprocessing method in which at first the input image is passed through a mean filter to decrease the noise and
[image:8.595.306.517.238.354.2]achieve a superior image appropriate for fragmentation. Passing the image through the mean filter has the effect of finetuning the image excellence. The pre-processed image is fragmented by means the KFCM clustering algorithm. Guidance data choice is executed for ANN and in the long run, categorization of the multispectral satellite images employing ANN is performed using the qualified data.
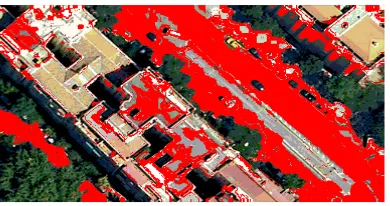
Figure 5: Input satellite image
[image:8.595.306.511.447.548.2]Figure (5) exhibits the input satellite image of a zone taken from the satellite and the vegetation, road and building qualities are easily comprehendible. In fact our main motive behind the innovative method is the categorization of the image into vegetation, road and building.
Figure 6: Classified building region
[image:8.595.311.506.619.722.2]Figure 6 pictures the concluding classified image obtained from the input image. We observe that the building areas are signified by the red shaded portion, without any change in other areas.
Figure7 vividly distinguishes the ultimate classified image from the input image. Also, it is crystal-clear that the road zones get symbolized by the red shaded land portion, keeping other areas unchanged.
Figure 8: Classified vegetation region
The captioned figure 8 distinguishes the ultimate classified image from the input image. As can be seen, the vegetation zones are symbolized by the red shaded portion keeping the remaining regions untouched.
5.1.1 Feature vector format of building, road and vegetation region
149.288 69.254 137.33 153.308 66.192 143.666 143.947 68.3359 134.333 157.458 65.5940 200.333 125.09 3.6364 93 132.55 4.81872 75.3333 68.2411 38.7285 43.6666 27.7874 27.3745 12.333 154.98 66.7300 143.66 151.052 67.2079 141.666 2.31006 4.03707 8
44.77 21.239 136.66 96.5929 78.142 99 101.663 80.9614 100.6666 77.9487 64.89949
98 198.92 34.762 253 1.6271 7.05008 2 15.5913 16.34628 17.3333 1
Table 1: feature vector of Building region
154.429 67.5228 137 134.822 57.8988 119 110.858 53.9257 73.3333 144.833 59.6679
139.666 133.078 7.60053 151.333 143.808 9.88084 171 36.8934 32.5468 22 83.5557
46.3554 137.666 157.117 64.0832 199 137.957 59.4680 134 20.298 14.4542 84.6666
34.4977 16.7627 99 82.79869 61.80213 2 81.66 62.36805 2 46.8699 42.50
7.666 153.57 31.1064 202.3333 22.17296 18.993 23 31.7928 18.0220 50.3333 2
Table 2: feature vector of Road region
19.0837 27.2584 2.33333 40.7760 29.4900 20 27.5772 21.9117 26.3333 36.9350 31.1628 7.66666 117.663 7.71766 86 133.340 10.7850 141.666 104.260 33.0450 91.6666 182.903 63.4989 185.333 44.2230 28.0192 26.3333 32.7865 26.9748 11.3333 0.32248 2.17954 6
8.578 6.82409 26.3333 5.66707 13.9356 2 7.278866 14.7963 3 4.067192 9.92356
3 101.05 31.151 150.333 0.820683 7.709539 3.333333 44.76587 39.41101 82.33333 3
Table 3: feature vector of Vegetation region
5.2 Evaluation of classifier’s performance
The relative scrutiny converges on the implementation study of the new method with k-means algorithm. The precision value is calculated by dividing the total number of similar pixels recognized as land used to the number of pixels in the tree, building and road region.Figure 9 exhibits the plot of precision graph-building region categorization by means of neural network. Figure 10 shows the plot of precision graph-road region categorization using neural network. Figure 9 shows the plot of precision graph-vegetation region categorization with the help of neural network. In both the cases it can be seen that our proposed technique which uses neural network and KFCM, achieves best results when compared to use of
Figure 9: Accuracy graph-building region classification using NN
Figure 10: Accuracy graph-road region classification using NN
Figure 11: Accuracy graph-tree region classification using NN
6. CONCLUSION
In this paper, an innovative and efficient image categorization method for satellite images by means of KFCM and artificial neural network was introduced.The proposed categorization method flows through three stages such as pre-processing, fragmentation and final categorization using neural network. In the pre-processing phase, the input image is made to undergo a series of pre-processing stages comprising filtering, contrast adjustment and laplacian filter. The pre-processing has the function
of modifying the input image into an image suitable for fragmentation. After the pre-processing the
image is fragmented by means of the kernel based fuzzy c-means clustering algorithm. This has the effect of fragmenting the images being segmented into clusters. NN is educated as per the data furnished. Finally, the image is treated as input to the qualified NN, which categorizes the satellite images into road, building and vegetation zones as per the skilled data and pixel values. Thus we obtain a classified image. The test outcomes have exhibited the efficiency of the planned categorization method in categorizing into road, building and vegetation zones. The test is done with the help of the satellite images and the scrutiny upholds the excellence of the wished-for method vis-à-vis k-means clustering algorithm
REFERENCES
[1] Kevin Tansey, Ian Chambers, Andrew Anstee, Anthony Denniss and Alistair Lamb, "Object-oriented classification of very high resolution airborne imagery for the extraction of hedgerows and field margin cover in agricultural areas", Applied Geography, Vol. 29, No. 2, pp. 145-157, 2009.
[2] James A. Shine and Daniel B. Carr, "A Comparison of Classification Methods for Large Imagery Data Sets", JSM 2002 Statistics in an ERA of Technological Change-Statistical computing section, New York City, pp. 3205-3207, 2002.
[3] Govender, M., Chetty, K., Naiken, V. and Bulcock, H., "A comparison of satellite hyperspectral and multispectral remote sensing imagery for improved classification and mapping of vegetation", Water SA, Vol. 34, No. 2, pp. 147-154, 2008.
and Remote Sensing, Vol. 56, No 6, June, pp. 871-886, 1990.
[5] Balazs Dezso, Istvan Fekete, David Gera, Roberto Giachetta and Istvan Laszlo, "Object-Based Image Analysis In Remote Sensing Applications Using Various Segmentation Techniques", Annales Univ. Sci. Budapest., Sect. Comp. 37 (2012) 103–120.
[6] J. Osman, J. Inglada and E. Christophe, "Interactive Object Segmentation In High Resolution Satellite Images, Geoscience and Remote Sensing Symposium,2009 IEEE International,IGARSS 2009.
[7] De Moraes R.M. “An Analysis Of The Fuzzy Expert Systems Architecture For Multispectral Image Classification Using Mathematical Morphology Operators”, International Journal of Computational Cognition, Vol. 2, No. 2, pp. 35–69, June 2004.
[8] Smits P.C., A. Annoni, “Towards operational knowledge based remote-sensing image analysis”, Pattern Recognition Letters, vol. 20, pp. 1415 1422, 1999.
[9] Angelos Tzotsos and D. Argialas, “A Support Vector Machine Approach For Object Based Image Analysis”, Lecture Notes in Geoinformation and Cartography, pp. 663-677, 2008.
[10] Ashwini T. Sapkal, Chandraprakash Bokhare and N. Z. Tarapore, “Satellite Image Classification using the Back Propagation Algorithm of Artificial Neural Network”, 2006. [11] Sonka M., Hlavac V. and Boyle R., “Image processing, Analysis and Machine Vision”, Second Edition, Brooks/Cole Publishing Company, 1999.
[12] Roger Trias-Sanza, Georges Stamon and Jean Louchet, "Using colour, texture, and hierarchial segmentation for high-resolution remote sensing ", ISPRS Journal of Photogrammetry and Remote Sensing, Vol. 63, No. 2, pp. 156-168, 2008.
[13] Trias-Sanz, R., "A metric for evaluating and comparing hierarchical and multi-scale image segmentations", in Proceedings of IEEE International Geoscience and Remote Sensing Symposium, (IGARSS 05), Vol. 8, pp. 5647-5650, 2005.
[14] Burnett C. and Thomas Blaschke, "A multi-scale segmentation/object relationship modelling methodology for landscape analysis", Ecological Modelling (Landscape Theory and Landscape Modelling), Vol. 168, No. 3, pp. 233-249, 2003.
[15] PCI Enterprises Inc., "SAR Radiometric Correction", RadarSoft Course notes. pp. 80-91, 1997.
[16] Young, S. S. and Wang, C. Y., "Land-cover change analysis of China using global-scale Pathfinder AVHRR Landcover (PAL) data", International Journal of Remote Sensing, Vol. 22, No. 8, pp. 1457-1477, 2001.
[17] Lillesand, T. M. and Kiefer, R. W, (1994) “Remote Sensing and Image Linter Predation”, John Wiley and Sons Press.
[18] Tso B. and Mather P. M., "Classification Methods for Remotely Sensed Data", Taylor and Francis, London, 2001.
[19] Chang C. I. "Hyperspectral Imaging: Techniques for Spectral Detection and classification", Kluwer Academic Publishers, 2001.
[20] Varshney, P. K. and Arora, M. K., "Advanced Image Processing Techniques for Remote Sensed Hyperspectral Data", Springer-Verlag, Germany, 2004.
[21] Lu, D. and Weng, Q., "A survey of image classification methods and techniques for improving classification performance", International Journal of Remote Sensing, Vol. 28, No. 5, pp. 823-870, 2007.
[22] Jasinski, M. F., "Estimation of subpixel vegetation density of natural regions using satellite multispectral imagery", IEEE Transactions on Geoscience and Remote Sensing, Vol. 34, pp. 804-813, 1996.
[23] Landgrebe, D., “Signal Theory Methods in Multispectral Remote Sensing” John Wiley and Sons, Hoboken, NJ, 2003.
[24] Haralick R. M., Shanmugam K. and Dinstein, I., "Texture features for image classification", IEEE Transactions on Systems, Man and Cybernetics, Vol. 8, No. 6, pp. 610-621, 1973. [25] Tuominen, S., Pekkarinen, A., "Performance
of different spectral and textural aerial photograph features in multi-source forest inventory", Remote Sensing of Environment, Vol. 94, No. 2, pp. 256-268, 2005.
[26] Gidudu Anthony, Hulley Gregg, and Marwala Tshilidzi, , “An Svm Multiclassifier Approach to Land Cover Mapping ”, In proceedings of ASPRS Annual Conference , 2008.
[28] Alberto Fernándeza, María José del Jesusb, and Francisco Herreraa, 'Hierarchical fuzzyrule based classification systems with genetic rule selection for imbalanced data-sets", International Journal of Approximate Reasoning, Vol. 50, No.3, pp.561–577, 2009. [29] Yousefi, Mirhassani S.M., Hosseini M.M. and
Rastegar Fatemi M.J., “A novel fuzzy based method for 3D buildings modeling in urban satellite imagery", In proceedings of IEEE Conference on Open Systems (ICOS), pp.190-195, 2011.
[30] So-Ra Kim, Woo-Kyun Lee, Doo-Ahn Kwak, Greg S. Biging, Peng Gong, Jun-Hak Lee and Hyun-Kook Cho, "Forest Cover Classification by Optimal Segmentation of High Resolution Satellite Imagery", Sensors, vil. 11, no. 2, pp. 1943-1958, 2011.
[31] Zhao Meng and Bai Xiao, "High-resolution satellite image classification and segmentation using Laplacian graph energy", In Proceeding of IEEE Internationa Geoscience and Remote Sensing Symposium, pp. 605-608, 2011. [32] R. Gaetano, J. Zerubia,G. Scarpaand G. Poggi,
"Morphological road segmentation in urban areas from high resolution satellite images",In Proceeding of 17th International Conference on Digital Signal Processing (DSP), pp. 1-8, 2011. [33] Liang Hong and Kun Yang, "A novel