Color Cell Image Segmentation Based on Chan-Vese
Model for Vector-Valued Images
Jinping Fan, Shiguo Li, Chunxiao Zhang
Department of Electronic Communication Technology, Shenzhen Institute of Information Technology, Shenzhen, China. Email: [email protected]
Received September 9th, 2013; revised October 6th, 2013; accepted October 13th, 2013
Copyright © 2013 Jinping Fan et al. This is an open access article distributed under the Creative Commons Attribution License, which permits unrestricted use, distribution, and reproduction in any medium, provided the original work is properly cited.
ABSTRACT
In this paper, we propose a color cell image segmentation method based on the modified Chan-Vese model for vector- valued images. In this method, both the cell nuclei and cytoplasm can be served simultaneously from the color cervical cell image. Color image could be regarded as vector-valued images because there are three channels, red, green and blue in color image. In the proposed color cell image segmentation method, to segment the cell nuclei and cytoplasm precisely in color cell image, we should use the coarse-fine segmentation which combined the auto dual-threshold method to separate the single cell connection region from the original image, and the modified C-V model for vector- valued images which use two independent level set functions to separate the cell nuclei and cytoplasm from the cell body. From the result we can see that by using the proposed method we can get the nuclei and cytoplasm region more accurately than traditional model.
Keywords: Cell Image; Color Image Segmentation; Level Set Method; Active Contour Model
1. Introduction
Worldwide, especially in middle and low income coun- tries, cervical cancer is the second most common cancer in women, and the third most frequent cause of cancer death. But cervical cancer is more preventable than oth- ers because it has a very long time precancerous stage and can be easily detected by a routine screening test. So it is necessary to develop the automated cervical smear screening analysis system to assist the diagnosis of cer- vical cancer. The quantitative analysis and automatic recognition of cervical cell image contain the following three steps: cell image segmentation, features extraction and cell image recognition. Segmentation of cells in cy- tological image is the fundamental and key point of quantitative analysis and affects the classification result directly.
The early cervical cell image segmentation method was focused on the nuclear region segmentation [1-3]. After finding that the cytoplast region and the whole cell body have played important role in cervical cell image classification and diagnosis, some researchers employed several methods to segment the cell nucleus and cell cy- toplasm [4-6]. Because the cervical smear images are
frequently contaminated, the contrast between cell nu- cleus and cytoplasm is lower, which makes the contours of nuclei and cytoplasm very vague even for the abnor- mal cells. In addition, the cells shape, size and topologi- cal structure are strongly different from each other espe- cially for the severe dysplastic cells. While the Chan- Vese (C-V) active contour model without edges, pro- posed in [7] has been used in gray cervical cell image segmentation perfectly in [8]. The modified C-V model can separate the cell nuclei and cytoplasm precisely. In reality the collected and processed cell images are all color images, so it’s necessary to research the method of the color cell image segmentation. In this paper, we pro- pose a color cell image segmentation method by using vector-valued C-V model.
2. Cell Image Processing
shape, morphology, color, texture and density. It’s hard to use a global segmentation method to extract every connected cell region from the cervical smear image pre- cisely. These features brought us to use coarse-to-fine segmentation strategy.
Before the cell coarse segmentation, we should do some pre-processing steps to select regions of interest (ROI) which contains the object cell. In each ROI, there is only one object of interest in each field. So the next fine segmentation can be implanted on the choosing ob- ject. In this paper we use auto dual-threshold segmenta- tion as the coarse segmentation method [8]. As there are three components in cervical cell image: cell nucleus, cell cytoplasm and background, we just need to segregate the nucleus and cytoplasm from the background domain, which means that two thresholds will be used in the al- gorithm.
Combine cell nucleus region with cytoplasm region of the result after auto-threshold segmentation and we can get a binary image. Morphological opening operation, which consists of an erosion operation followed by a dilation operation, has been used to eliminate the small isolated noise and void area. After the mathematical mor- phology opening operation, isolated noise and hole smal- ler than structure element will be eliminated. Scanning the binary image after the processing mentioned above again and labeling it by 8 neighborhoods searching algo- rithm, we can segregate the minimum enclosing rectan- gle of the connected region by its serial number. Expand the rectangle to x pixels in up and down directions and y pixels in left and right directions, the region after ex- panding is deemed as the region of interest where the fine segmentation will be operated on it.
3. Gray Cell Image Segmentation
Chan-Vese model (C-V model) proposed by T. F. Chan and L. A. Vese is a classical level set based active con- tour model [9-15]. The model is appropriate for seg- menting the images containing the objects that have fuzzy or discontinuous borders and complicated topolo- gical structures. Here we use the modified C-V model to segment the gray scale cervical cell image [8].
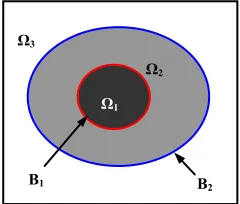
Let be the image domain, Ω1, Ω2 and Ω3 represent the cell nucleus, cell cytoplasm and back- ground regions respectively. In general case, the intensity of background is the highest among the three regions, the cell cytoplasm is in the second place, and the cell nucleus is the lowest. In addition the cell nucleus is always inside the cell nucleus. The structure of the cervical cell image shows in Figure 1.
d R
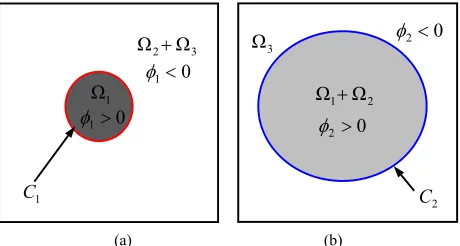
In this section, we employ two independent level-set functions 1 and 2 to segment the cervical cell image, the contour curves C1 and C2 are represented by their zero level set functions.
Ω3
Ω2
Ω1
[image:2.595.363.483.85.187.2]B1 B2
Figure 1. Structural representation of cervical cell image.
The level set functions and their regional classification show in Figure 2. The definition of the level set function is that if the point is inside the curve then 0, if the point is outside the curve the 0 and if the point is on the curve then 0. The energy functional of this model is defined as
1, , ; , ,2 1 1 2 2
1
1, ,2 1
2
1, ,2 2 E c c d d E c c E d d
(1) where E c c1
1, ,2 1
and E d d2
1, ,2 2
are the energy functional of level set functions 1 and 2 based on Chan-Vese model; c1 and c2 denote the mean of the im- age intensity inside and outside the contour curve C1; d1 and d2 denote the mean of the image intensity inside and outside the contour curve C2.Assuming c1, c2, d1 and d2 are constants and minimize- ing energy functional E c c
1, , ; , ,2 1 d d1 2 2
with re- spect to level set functions 1 and 2 yield the evolv- ing equations of the two level set functions:
2
1 1
1 1 1 0 1
1
2 1 0 2 0
0 2 1 2 1 1
11 12
div 1 u c
t
c u c u
u c c c
A A A A
(2)
2
2 2
2 2 2 0 1
2
2 1 0 2 0
0 2 2 2 1 2
21 22
div 1 u d
t
d u d u
u d d d
A A A A
(3)
where A is the area of the image, A11 and A12 are the area inside and outside the contour curve C1, A21 and
22
A are the area inside and outside the contour curve C2,
λ1 and λ2 are adjustable weight values used in level set evolving functions.
11 1 12 1
21 2 22 2
d d , 1 d d
d d , 1 d d
A H x y A H x y
A H x y A H x
y11 12 21 22
0
1
Ω1
1 C 3 2 Ω Ω 0 1 3 Ω 0 2 2 1 Ω Ω 0 2 2 C
[image:3.595.58.288.84.207.2](a) (b)
Figure 2. Level set functions and regional division: (a) Level set function 1 and relevant regional classification, (b) Le- vel set function 2 and relevant regional classification.
are much bigger than the intensity difference between cell nucleus and cell cytoplasm. Let h1, h2 and h3 repre- sent the mean of the image intensity within cell nucleus, cell cytoplasm and background, then 3 2 1. Asso- ciating with the definition mentioned above we can ob- tain the expression that 2 3 2 2 1 1 1
h h h
c h d
d h c h , in addition we do fine segmentation in ROI, so the area of background A22 is small relatively. So the right side of the Equation (3) is huge, considering the stabilization of the algorithm, let 21
22 A P
A
and 22 21 A P
A
, we can rewrite the Equation (3) to the following equation.
2 2
2 2 2
2
2 2
0 1 0 2
2 2 1 0 1 22 2 21 2
div 1
t
u d u d
d d u d P d P
(5)
Similarly for the fixed level set functions 1 and 2
minimizing the energy functional E c c
1, , ; ,2 1 d1 d2,2
with respect to c1, c2, d1 and d2, we can get the following equations:
0 1 0 1
Ω Ω
1 2
1
Ω Ω
d d 1 d d
,
d d 1 d d
u H x y u H x y
c c
1
H x y H x y
(6)
0 2 0 2
Ω Ω
1 2
2 2
Ω Ω
d d 1 d d
,
d d 1 d d
u H x y u H x y
d d
H x y H x y
(7)Generally the updating of the level set functions and the computation of c1, c2, d1 and d2 are processing alter- natively until the solution is stationary. When the evolv- ing process has finished, the contour curves correspond- ing to the zero level set functions of 1 and 2 are the boundaries of the segmented domain. The contour curve represented by zero-level set of 1 is entitled cell nu-
cleus contour curve, and the contour curve represented by zero-level set of 2 is called cell body contour curve, they are combined and defined as cell contour curve.
4. Color Cell Image Segmentation
Now we put the previous modified C-V model of the cell image segmentation method to the vector case [12]. There are 3 channels in color cell image, red, green and blue. Let u0,i be the ith channel of an image on Ω,
while i=1,2,3 represent the red, green and blue channel respectively. Let c
c1 c3
,
,1 3
c c c
d d1 d3
and
1 3
d dd
be four un- known constant vectors. The extension of the C-V model to the color cell image segmentation model in vector case is
, , ; ,
1
, , 1
2
, ,E c c 1 d d ,2 E c c E d d 2
(8) According to the previous description of gray cell im- age segmentation and Equations (2) and (5), assuming
c, c, d and d are constant vectors and mini- mizing E c
, ,c 1;d,d,2
with respect to 1 and2
, we can get the following equations:
3 1 11 1 1,
1 1
2 2
0, 0,
3 0, 12 11
1, 1
1 11 12
1 di 1 3 1 3 i i
i i i i
i i i
i i i i
t
u c u c
u c P c P
P P v c c
(9)
3 2 22 2 2,
1 2
2 2
0, 0,
3
2, 0, 22 21 2
1
1
( ) div 1
3
1 3
i i
i i i i
i i i i i i
i t
u d u d
d d u d P d P
(10) where 10 , 20 , 10 and 20 are the fixed weight of the vector-valued C-V model, 1,i 0 and 2,i0 are the weight coefficients of each channel,and
11 Ω 1 d d
A
H x y 12
1Ω 1 d
, A
H xdy
21 Ω 2 d d
A
H x y, A22
Ω1H
2 dxdy 1111 A P
A
, 12
12 A P
A
, 21
22 A P
A
, 22
21 A P
A
11 12 21 22 Ωd d
While minimizing the energy with respect to the con- stants c, c, d and d, we can obtain
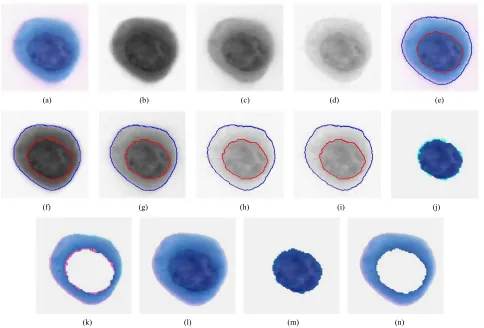
spectively and we can see that the gray scale value are great different from each other. The segmentation result have been shown in Figures 3(e)-(h), where the red line indicate the contour curve between the cell nuclei and cytoplasm and the blue line the contour curve between the cytoplasm and the background. Where the Figure 3(e) is the result of using the method which is proposed in the paper, Figures 3(f)-(h) are the result of gray scale cell image segmentation using the modified C-V model.
0, 1
Ω
1
Ω
, , d
, d d
i i
u x y H x y x y c
H x y x y
d
0, 1
Ω
1
Ω
, 1 , d d
1 , d d
i i
u x y H x y x y
c
H x y x y
The conventional color cell image segmentation result is applying gray cell image segmentation in each channel and combined the result together to get the final segmen- tation result. The cell body, cell nuclei and cytoplasm being segmented by using the traditional method have been shown in Figures 3(i)-(k) respectively. While the cell body, cell nuclei and cytoplasm being segmented by using the method proposed in this paper have been shown in Figures 3(l)-(n). We can see that the edges of the cell body and cell nuclei are accurate and smooth than the traditional method, and approve the feasibility of the proposed method.
0, 2
Ω
2
Ω
, ,
, d d
i i
u x y H x y x y d
H x y x y
d d
0, 2
Ω
2
Ω
, 1 , d d
1 , d d
i i
u x y H x y x y d
H x y x y
The segmentation result of single color cell image is shown in Figure 3. Figure 3(a) is the color cell image of being segmented, which is a high-grade squamous intra- epithelial lesion (HSIL) cervical cell. Figures 3(b)-(d) are the cell image of the red, green and blue channel re-
(a) (b) (c) (d) (e)
(f) (g) (h) (i) (j)
[image:4.595.58.542.351.679.2]
(k) (l) (m) (n)
Figure 3. Color cervical cell image segmentation results: (a) Original color cell image; (b)-(d) Red, green and blue channels image of the cell; (e) The contour curve of the cell nuclei and the cell body of the color image using the method proposed; (f)-(h): The contour curve of the nuclei and cell body of the red, green and blue channel; (i)-(k): The extracted cell body, nu- clei and cytoplasm using traditional method; (l)-(n): The extracted cell body, cell nuclei and cytoplasm using the method pro-
5. Conclusion
This paper develops a color cervical cell image segmen- tation method to segment the nucleus and cell cytoplasm from a cervical smear image. In this paper, a coarse seg- mentation method using auto-dual threshold segmenta- tion method has been used firstly and region of interest has been extracted. Then fine segmentation based on modi- fied Chan-Vese model has been used in which two inde- pendent level set functions have been used to approxi- mate the boundary between nucleus and cytoplasm and the boundary between cell body and background. On the basis of gray scale cell segmentation method, we pro- posed a color cell image segmentation method using modified C-V model for vector-valued images. The nu- merical simulation results are given to demonstrate the validity and accuracy of the proposed method. It’s ob- served that the proposed color cervical cell image seg- mentation methods provide a good performance even the original image has a vague boundary. Besides cervical smear images, these proposed techniques can be employ- ed to other color mages segmentation.
REFERENCES
[1] P. Bamford and B. Lovell, “Unsupervised Cell Nucleus Segmentation with Active Contours,” Signal Processing, Vol. 71, No. 2, 1998, pp. 203-213.
http://dx.doi.org/10.1016/S0165-1684(98)00145-5 [2] T. Mouroutis and S. J. Roberts, “Robust Cell Nuclei Seg-
mentation Using Statistical Modeling,” Bioimaging, vol. 6, No. 2, 1998, pp. 79-91.
http://dx.doi.org/10.1002/1361-6374(199806)6:2<79::AI D-BIO3>3.0.CO;2-#
[3] M. E. Plissiti, A. Charchanti, O. Krikoni and D. I. Fo- tiadis, “Automated Segmentation of Cell Nuclei in PAP Smear Images,” Proceedings of IEEE International Spe- cial Topic Conference on Information Technology in Bio- medicine, Ioannina, 26-28 October 2006, pp. 26-28. [4] M.-H. Tsai, Y.-K. Chan, Z.-Z. Lin, S.-F. Yang-Mao and
P.-C. Huang, “Nucleus and Cytoplast Contour Detector of Cervical Smear Image,” Pattern Recognition Letters, Vol. 29, No. 9, 2008, pp.1441-1453.
http://dx.doi.org/10.1016/j.patrec.2008.02.024
[5] C. Duanggate, B. Uyyanonvara and T. Koanantakul, “A Review of Image Analysis and Pattern Classification Techniques for Automatic Pap Smear Screening Process,”
The International Conference on Embedded Systems and Intelligent Technology, Bangkok, 27-29 February 2008, pp. 212-217.
[6] N. Lassouaoui, L. Hamami and N. Nouali, “Morphologi- cal Description of Cervical Cell Images for the Patho- logical Recognition,” Proceedings of World Academy of Science, Engineering and Technology, Vol. 5, April 2005, pp. 49-52.
[7] M. Kass, A. Witkin and D. Terzopoulos, “Snakes: Active Contour Models,” International Journal of Computer Vi- sion, Vol. 1, No. 4, 1988, pp. 321-331.
http://dx.doi.org/10.1007/BF00133570
[8] J. P. Fan, R. C. Wang, S. G. Li and C. X. Zhang, “Auto- mated Cervical Cell Image Segmentation Using Level Set Based Active Contour Model,” The 12th International Conference on Control, Automation, Robotics and Vision, Guangzhou, 5-7 December 2012, pp. 877-882.
[9] T. F. Chan and L. A. Vese, “A Level Set Algorithm for Minimizing the Mumford-Shah Function in Image Proc- essing,” Proceedings of the IEEE Workshop on Varia- tional and Level Set Methods, Vancouver, 13 July 2001, pp. 161-168.
[10] T. F. Chan and L. A. Vese, “Image Segmentation Using Level Sets and the Piecewise Constant Mumford-Shah Model,” UCLA CAM Report, 2000, pp. 1-24.
[11] T. F. Chan and L. A. Vese, “An Active Contour Model without Edges,” International Conference on Scale-Space Theories in Computer Vision, Vol. 1682, 1999, pp. 141- 151. http://dx.doi.org/10.1007/3-540-48236-9_13 [12] T. F. Chan, B. Y. Sandberg and L. A. Vese, “Active Con-
tour Model without Edges for Vector-Valued Images,”
Journal of Visual Communication and Image Representa- tion, Vol. 11, No. 2, 2000, pp. 130-141.
http://dx.doi.org/10.1006/jvci.1999.0442
[13] T. Chan and L. Vese, “Active Contour Model without Edges,” IEEE Transactions on Image Processing, Vol. 10, No. 2, 2001, pp. 266-277.
http://dx.doi.org/10.1109/83.902291
[14] T. F. Chan and L. A. Vese, “An Efficient Variational Multiphase Motion for the Mumford-Shah Segmentation Model,” Proceedings of the 34th Asilomar Conference on Signals, Systems, and Computers, Pacific Grove, 29 Oc- tober-1 November 2000, pp. 490-494.
[15] L. A. Vese and T. F. Chan, “A Multiphase Level Set Framework for Image Segmentation Using the Mumford and Shah Model,” International Journal of Computer Vi- sion, Vol. 50, No. 3, 2002, pp. 271-293.