International Journal of Emerging Technology and Advanced Engineering
Website: www.ijetae.com (ISSN 2250-2459, ISO 9001:2008 Certified Journal, Volume 6, Issue 8, August 2016)
226
Modelling the Effect of Subsurface Infrastructures on Ground
Water Quality Using Modflow and GIS
Sindhuja. T
1, Lilly. P
2, Ravikumar. G
31M.Tech (EST) student, Department of Chemical Engineering, A C Tech Campus, Anna University-25, India 2Assistant Professor in Civil Engineering, Department of Civil Engineering, MNM Engineering College, Chennai,
3
Professor in Civil Engineering, Department of Civil Engineering, CEG Campus, Anna University, India Chennai -25, India
Abstract - Groundwater is the major source of drinking water in both urban and rural India. If Ground water is good, it is used for drinking, agricultural or industrial purposes. Due to urbanization such as building construction, industrialization, metro rail tunnelling works, the ground water gets contaminated. The physio-chemical parameters such as pH, Electrical Conductivity, Total Dissolved Solids, Total Hardness, Chloride, etc. are analysed by using various methods. Mostly Water Quality Index method is used. This review helps to understand the contamination of ground water and prediction of ground water. GIS mapping and MODFLOW model is used to analyse the ground water quality.
Keywords – groundwater quality, Modelling, Physio – Chemical parameters, GIS, Modflow
I. INTRODUCTION
India is the largest user of groundwater in the world which is the most important source of the domestic, industrial and agricultural water supply in the world. Various human activities are causing pollution on water of this precious resource. The quality of groundwater varies with location and depth. Water quality has been severely compromised due to increasing salinity of groundwater, contamination of water resources with pesticides and solid waste, and lack of adequate water and sewage treatment options. The presence of contaminants in ground water like arsenic and fluoride in toxic levels has posed major environmental health risks of the present century.
The presence of dissolved mineral and organic constituents in ground water in various concentrations are harmful, and a few may be highly toxic. For example, presence of too much sodium in the water may be harmful to people. Groundwater models are used to simulate and predict aquifer conditions. The various index methods are used to analyse ground water quality such as Water Quality Index (WQI), numerical and analytical model, MOD Flow, GIS mapping, etc. Rapid urbanization leads to reduction in recharge of aquifers. Groundwater pollution usually is complex, remediation of which is difficult, high cost, time-consuming, and ineffective.
In this paper, the ground water quality analysis is done by using Water Quality Index method, mapping and modeling done by GIS and MODFLOW. The physio - chemical parameters such as pH, Total Hardness, Total Dissolved Solids, Chloride, Electrical Conductivity (EC), is determined.
II.ANALYSIS BASED ON DIFFERENT LOCATION A.Coastal Region
Sudhakar Gummadi, Swarnalatha.G et al., (2014) evaluated a water quality index for ground water of Bapatla mandal, coastal Andhra Pradesh in India. The analysis of different parameters such as pH, turbidity, Alkalinity, total hardness, chloride, sulphate, nitrate, TDS, DO, BOD, COD were carried out as per standard methods. In this study, the suitability of water for drinking purposes was calculated by using water quality index (WQI). The results obtained on WQI from different sampling stations were found. The TDS, Nitrate and Calcium levels in all the samples exceeded the Maximum Contaminant Level (MCL) of WHO (World Health Organization), BIS (Bureau of Indian Standards) and USPH (U.S. Public Health) Drinking Water Standards. Based on the results obtained, the quality of water in four sampling sites is not suitable for human consumption without adequate treatment, monitoring of groundwater quality and treatment is required in some sampling sites.
B.Urbanization
International Journal of Emerging Technology and Advanced Engineering
Website: www.ijetae.com (ISSN 2250-2459, ISO 9001:2008 Certified Journal, Volume 6, Issue 8, August 2016)
227
It was helpful for public to understand the quality of water as well as being a useful tool in many ways in the field of water quality management.Kalpana G R and Nagarajappa D P (2014) developed an assessment of groundwater quality index in Davanagere city. The purpose of this investigation were to provide an overview of present groundwater quality for the parameters such as PH, Total hardness, Calcium, Magnesium, Chloride, Nitrate, Sulphate, Electrical conductivity, Total dissolved solids, Iron, Fluoride, Total alkalinity were considered for calculating the Water Quality Index (WQI). The results were analysed by WQI method for predicting water quality. The various methods used for analyse water quality parameters were pH meter, Conductivity meter, EDTA titration, Spectrophotometer, etc. In this study, an interpretation and discussions of the numerical data were drawn for the ground water.
Sunil Kumar Tank and R. C. Chippa (2013) done an analysis of water quality of Bharatpur, which is assessed by examine various physico-chemical parameters of open wells, bore wells and hand pumps. The physico – chemical quality of drinking water was assessed during the month of January, 2011 by standard methods as suggested by American Public Health Association (APHA, 1995) and compared with the values as guided by Indian Council of Medical Research (ICMR). This study reveals that the water of most of the sampling area is contaminated with higher concentration of total dissolved solids. Because of high concentration of TDS water loss its potability and high concentration of TDS also reduces the solubility of oxygen in water.
M. R. G. Sayyed, G. S. Waghand A.Supekar (2013) assessed an impact of groundwater quality due to urbanization in Pune. In this study, the Piper diagram was used and the hydro geochemical facies were identified. The concentrations of chemical constituents of the groundwater samples were plotted on Piper diagram. From the figures the percentage of the wells having different type groundwater were determined.
S.D.Jadhav, R.S. Sawant (2012) et al., evaluated a ground water quality assessment in Maharashtra. In this, the samples were collected through bore wells from 51villages in April 2011. The physico chemical parameters temperature, pH, EC, total alkalinity, total hardness, Ca and Mg hardness, chlorides and dissolved oxygen had been determined. They were compared the results with WHO and BIS drinking water standards. All the values were within the permissible limit. From the result, Out of 51 samples, 43 samples were within the permissible limit by World Health Organization (WHO).
A. Ponniah Raju, N. Chandrasekhar and S.Saravanan (2012) evaluated a spatial analysis of groundwater quality investigation in Chennai.
In this paper 26 samples (open wells and bore wells) were collected from different areas of north Chennai. Then the quality of groundwater parameters such as Total Hardness, Corrosivity Ratio (Cr), Total Dissolved Solids (TDS), Sea Water Intrusion during pre and post monsoon periods were analysed. The values were given in tabulation and the water quality map was done by using GIS. From the analysis, during pre-monsoon period TDS content was above desirable limit and during post monsoon period TDS content was low in some locations.
T. Subramani, S. Krishnan and P. K. Kumaresan (2012) studied the Groundwater Quality with GIS Application for Coonoor Taluk in Nilgiri District. In this study, the water quality was analysed using GIS mapping. The Lab Test Procedure was done as per Indian standard code of Practice. The water quality parameters are given in the data base to GIS. The Coonoor map was scanned and digitized. Digitization was done by Surfer – 8. Using ARC GIS 9.3 the spatial interpolation was done on the basis of attribute values such as pH, TDS, TH, Sulphate, Chloride, Calcium, Turbidity, Temperature, etc. GPS – Garmin and Water Quality Field Kit instruments were used. It provided a guideline for solving water quality problem in Coonoor Taluk.
Natarajan Venkat Kumar, Samson Mathew et al., done an analysis of groundwater for potability from Thiruchirappalli. This paper presented Artificial Neural Network (ANN), Back Propagation Network and GIS Models to predict water parameters. The sample was collected from 112 hand pumps and hand operated tube wells. The mapping was done by GIS. The groundwater quality was monitored from 79 sampling wells for 3 years and the recorded data revealed the concentrations of cations and anions were above the maximum.
Mohamed HaniphaM. and Zahir Hussain A. studied a groundwater quality at Dindigul. Twenty three locations were selected to collect groundwater samples from the bore well. Groundwater samples were subjected to analysis of physico-chemical parameters such as pH, electrical conductivity, total dissolved solids, carbonate, bicarbonate, chloride, sodium, potassium, calcium, magnesium, nitrate, sulphate, phosphate and fluoride and biological analysis, such as dissolved oxygen, BOD and COD. The results were compared with WHO standards. From the results most of the physicochemical parameters such as fluoride, dissolved oxygen, biochemical oxygen demand and chemical oxygen demand were in high concentration.
International Journal of Emerging Technology and Advanced Engineering
Website: www.ijetae.com (ISSN 2250-2459, ISO 9001:2008 Certified Journal, Volume 6, Issue 8, August 2016)
228
Initially, global positioning system (GPS) survey, was done. The Interpolated Distance Weighted (IDW) interpolation method and the Water Quality Index (WQI) using Weighted Arithmetic Index method were used to analyse the water quality. During this analysis, Heavy rainfall and dilution factors, excessive hardness was noticed. The GIS software was employed for interpretation of data. Finally, an Interpolated Distance Weighted map was drawn for (a) pH, (b) Total alkalinity, (c) Total hardness, (d) Calcium, (e) Magnesium, (f) Chloride, (g) Fluoride, (h) Iron, (i) Sodium, (j) Potassium, (k) TDS, (l) Electrical Conductivity (EC) in a different season.C.Industrialization
Shiva Prasad H, D.P.Nagarajappa et al., (2015) developed an assessment of groundwater quality index in bommasandra area, Bengaluru city, Karnataka state, India. Various water quality parameters such as pH, Electrical Conductivity, Total Dissolved Solids, Alkalinity, Chlorides, Total Hardness, Calcium Hardness, Nitrates, Sulphates, Iron and Fluorides were determined using standard analytical methods and Water Quality Index (WQI). From the WQI of the water of Bommasandra was considered as poor water.
Saravanakumar K. and Ranjith Kumar R. (2011) done an analysis of water quality parameters of groundwater near Ambattur industrial area Tamilnadu. The parameters studied were pH, total alkalinity, total hardness, turbidity, chloride, sulphate, fluoride, total dissolved solids and conductivity. From analysis, it was observed that there was a slight fluctuation in the physico-chemical parameters among the water samples studied. Comparison of the physico-chemical parameters of the water sample with World Health Organization (WHO) and Indian Council of Medical Research (ICMR) limits showed that the groundwater is highly contaminated and account for health hazards for human use.
Salin Peter, Sreedevi C developed a report about ground water around Kerala Minerals and Metals Ltd (KMML) industrial area in Chavara. In this, the physiochemical and biological analysis of the parameters like colour, conductivity, salinity, turbidity, pH, BOD, COD, TDS, iron, nitrates, Fecal coliforms etc. were calculated by using a calculation of Water Quality Index (WQI) and GIS mapping.
K.Ambiga and R. Anna Durai implemented a use of geographical information system and water quality index to assess ground water quality in and around Ranipet area. In this, the physico-chemical analysis was done using standard methods of analysis.
The physico- chemical parameters such as pH, Total Dissolved Solids, Total Hardness, Calcium, Magnesium, Sulphates, Chlorides, Fluorides, and Nitrates were calculated by using Water Quality Index (WQI). Thirty five groundwater samples were collected from open and tube wells during the Monsoon and Post Monsoon season in the year 2012. The higher concentration of dissolved solids during post monsoon samples exhibits poor quality of water as compared to Monsoon season due to more seepage and movement of ground water during post-monsoon.
Rizwan Ullah, Riffat Naseem Malik andAbdul Qadir
(2009) evaluated an assessment of groundwater Contamination in Pakistan. The water samples were collected from 25 localities during October-November 2005. Twenty-two physiochemical parameters including pH, Electric Conductivity (EC), Total Dissolved Solids (TDS), Salinity, Temperature, Turbidity, Sulphate (SO4)
Chloride (Cl), Total Hardness, Iodide, Fluoride, Ferric (Fe+3), Nitrate (NO3), Manganese (Mn), Total Chlorine,
Alkalinity, Zinc (Zn), Lead (Pb), Iron (Fe), Copper (Cu), Nickel (Ni) and Chromium (Cr) were recorded. The obtained results were compared with standard guidelines of World Health Organization (WHO) and Pakistan Standard Quality Control Authority (PSQCA) for groundwater quality.
D.Municipal Solid Waste
Gawsia John, Harendra K. Sharma and Vikas Vatsa (2014) evaluated an impact of municipal solid waste dump on ground water quality at Dehradun. From this study, the physico-chemical properties and microbial activity of underground water was evaluated within 3 months. The physico-chemical properties such as temperature, total dissolved solids, pH, electrical conductivity, alkalinity, total hardness, phosphate, chloride, residual chlorine & microbial activities were studied and analysed. The quality of ground water in various parameters is fair or satisfactory but the overall study had revealed that the ground water quality does not conform to the drinking water quality standard as per Bureau of Indian standards.
International Journal of Emerging Technology and Advanced Engineering
Website: www.ijetae.com (ISSN 2250-2459, ISO 9001:2008 Certified Journal, Volume 6, Issue 8, August 2016)
229
The concentrations of physical, chemical parameters and trace metals in groundwater samples were compared with the Bureau of Indian Standards (BIS) and World Health Organization (WHO). From the research, the water quality parameters were exceeding the permissible limits in the villages.III. OVERALL FRAMEWORK FOR THE MODELLING i. Topography
Chennai is the capital city of the Indian state of Tamil Nadu. Located on the Coromandel Coast off the Bay of Bengal, it is the largest industrial and commercial centre in South India, and a major cultural, economic and educational centre. Chennai is known as the “Detroit of India” for its automobile industry. It is the fourth-largest city and fourth-most populous metropolitan area in the country and 36th-largest urban area in the world. The city of Chennai is located at 13°04’ N latitude and 80°17’E longitude and occupies an area of about 173 km2.
ii. Study Area
The selected area is along the metro rail tunneling work in Chennai. The Chennai Metro is a rapid transit system under construction in Chennai, Tamil Nadu. The total length of underground work is 24km. The work is started from the year 2009.
iii. Methodology Framework
The methodology for the modelling of groundwater quality is given below.
Fig.1 Flowchart for Methodology
iv. Sampling
The samples were collected from the 10 open wells from the respective location. Samplings were collected for once in two weeks (14 days interval).
The Samples were collected in plastic containers and tested in laboratory within 24 hours.
The physio – chemical parameters such as pH, Total Hardness, Electrical Conductivity, Chloride, Total Dissolved Solids, etc. were determined.
Sl.No Parameter Methods
1 pH pH meter
2 Electrical Conductivity
Conductivity meter
3 Total Hardness EDTA Titration
4 Chloride Silver Nitrate Titration
v. Calculation Of Quality Parameters
a. Total
Hardness = Volume of EDTA x 50 x 1000 x N
Volume of Sample
b. Total Dissolved Solids
= (W2 – W1)/V
W2 - Weight of residue and dish
W1 - Weight of dish
V - Volume of Sample
c. Chlorides
(mg/l) = ( VS –VB) x N x 35.45 x 1000 V
VS - Volume of Silver Nitrate for
sample
VB - Volume of Silver Nitrate for Blank
Water can be classified by the amount of Total Dissolved Solids per litre,
Sl.NO Water Type TDS (mg/l)
1 Fresh Water <1500
2 Brackish
Water 1500 – 5000
3 Saline Water >5000 Modelling
Data Collection
Well Location
Sampling
International Journal of Emerging Technology and Advanced Engineering
Website: www.ijetae.com (ISSN 2250-2459, ISO 9001:2008 Certified Journal, Volume 6, Issue 8, August 2016)
230
Hardness is the property which makes water to form an insoluble precipitate with soap and is primarily due to the presence of Calcium and Magnesium ions.pH is a measure of the hydrogen ion concentration in water. Values lower than 7 indicates acidity and the values higher than 7 indicate alkalinity.
The conductivity value gives us a rapid and inexpensive way to determining the ionic strength of a solution.
The higher concentration of chloride ions mostly results in an unpleasant salty taste of water and it also aides the corrosion of plumbing system.
vi. Data Collection
[image:5.595.326.538.343.559.2]The primary data (groundwater quality and rainfall data) were collected from State Ground and surface water Resources Data Centre for the year 2009 - 2015. The collected primary and secondary data were given as input of GIS and MODFLOW Software.
Table 1.
Indian standards for drinking water
Parameter
Prescribed by BIS
(IS 10500-91) ICMR
Desir.
Limit
Max. per. Limit
Desir. Limit
Max. per. Limits
pH 6.5
to 8.5 -
7.0 to 8.5
6.5 to 9.2 TDS
mg/L 500 2000 500
1500 to 3000
TH mg/L 300 600 300 600
Cl mg/L 250 1000 200 1000
vii. Visual Modflow Software
Visual MODFLOW is an integrated modeling technique for environment. It allows graphical design the model grid, properties and boundary conditions, visualize the model parameters in two or three dimensions, run the groundwater flow, path line and contaminant transport simulations. Visual MODFLOW combines the most powerful and intuitive interface available with the latest versions of MODFLOW, MODPATH, Zone Budget and MT3D.
The Visual MODFLOW interface has been specifically designed to increase modeling productivity and decrease the complexities. The interface is divided into three separate modules viz.., Input Module, Run Module and Output Module.
viii. GIS
The GIS is a well-known tool and has been utilised widely for surface hydrological modelling. In groundwater modeling, GIS was only used preparing model input parameters and presenting the model outputs.
ix. Result
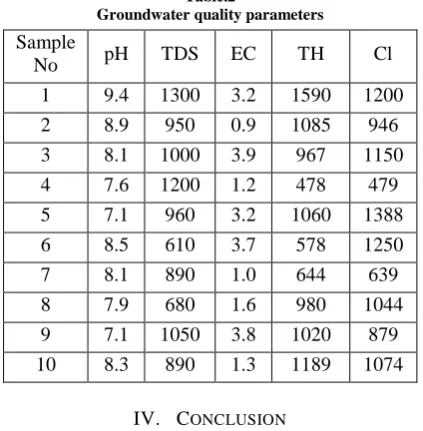
From the laboratory test, the groundwater quality parameters are determined. For Visual Modflow these data are given as input to determine the contaminant level in groundwater due to an urbanization.
[image:5.595.46.273.364.562.2]The result from various tests are compared with BIS (Bureau of Indian Standards) and ICMR (Indian Council of Medical Research) standards. In Some places the groundwater quality values are exceeds permissible limits.
Table.2
Groundwater quality parameters
Sample
No pH TDS EC TH Cl
1 9.4 1300 3.2 1590 1200
2 8.9 950 0.9 1085 946
3 8.1 1000 3.9 967 1150
4 7.6 1200 1.2 478 479
5 7.1 960 3.2 1060 1388
6 8.5 610 3.7 578 1250
7 8.1 890 1.0 644 639
8 7.9 680 1.6 980 1044
9 7.1 1050 3.8 1020 879 10 8.3 890 1.3 1189 1074
IV. CONCLUSION
The review papers reveal that an impact on the quality of sub-surface water, due to urbanization, Industrialization, Coastal region and sewage disposal. The excess concentration of chemical parameters in groundwater leads to cause an environmental effects such as pipe corrosion, scaling, palatability, incrustation, health effects, etc. It is recommended that urban development programmes should be properly planned to avoid areas that are prone to contamination.
REFERENCES
International Journal of Emerging Technology and Advanced Engineering
Website: www.ijetae.com (ISSN 2250-2459, ISO 9001:2008 Certified Journal, Volume 6, Issue 8, August 2016)
231
[2] Lasya C.R. Inayathulla.M (Mar - Apr. 2015),“Groundwater Flow Analysis Using Visual Mod flow”, Journal of Mechanical and Civil Engineering, Volume 12, Issue 2 Ver. VII, PP 05-09. [3] Jai M Paul, Arya V.S, Jesteena George, Reji K.J, Sumitha K.S
(April 2014) “Assessment of Ground Water Quality in Nellikkuzhy Panchayat of Kerala State, India” Volume 3 Issue 4 PP.21-28.
[4] Sneh (2013), “Water Quality Monitoring in India: A Review International Journal of Information and Computation Technology Gangwar”, Volume 3, Number 8 pp. 851-856.
[5] Sunil Kumar Tank CHIPPA R.C (June 2013), “Analysis of Water Quality of Bharatpur”, International Journal of Engineering Inventions, Volume 2, Issue 10 PP: 06-11.
[6] Janmaizatulriah Jani (2012) “GIS as a tool for modelling groundwater flow”. IEEE Symposium on Business, Engineering and Industrial Applications 513-517.
[7] Rajkumar V. Raikar Sneha M.K (2012, Received on March 2012 Published on May 2012), “Water quality analysis of Bhadravathi taluk using GIS –a case study”, International Journal of Environmental Sciences Volume 2, No 4.
[8] Subramani T. Krishnan S. Kumaresan P. K. (May-June 2012) “Study of Groundwater Quality with GIS Application for Coonoor Taluk in Nilgiri District”, Vol.2, Issue.3, PP. 586-592.
[9] Dr. Swaminathan Rajan, (18 Aug 2012) “A Study of Drinking Water Quality of Aminjikarai, J.J. Nagar, Valluvarkottam and Vadapalani Area of Chennai, Tamil Nadu.”
[10] Sarala C, Ravi Babu P (October 2012), “Assessment of Groundwater Quality Parameters in and around Jawaharnagar, Hyderabad,” International Journal of Scientific and Research Publications, Volume 2, Issue 10.
[11] Saravanakumar K. Ranjith Kumar R. (May 2011) “Analysis of water quality parameters of groundwater near Ambattur industrial area, Tamil Nadu, India,” Vol.4 No.5.
[12] Eni Devalsam Obiefuna I. Josiah N. Oko, Comfort Ekwok (August 2011) “impact of urbanization on sub-surface water quality in calabar municipality, Nigeria,” International Journal of Humanities and Social Science, Vol. 1 No.10.
[13] Steven Appleyard (December 2003) “GROUNDWATER QUALITY IN THE PERTH REGION,” Australian Aeromechanics Vol 38 No 4– The Engineering Geology of Perth Part -2.
[14] Sudhakar Gummadi, Swarnalatha.G, V. Venkataratnamma, Z.Vishnuvardhan (2014)“ Water quality index for ground water of Bapatla Mandal, coastal Andhra Pradesh, India” International Journal of Environmental Sciences Volume 5,No 1.
[15] Tirkey Poonam, Bhattacharya Tanushree, Chakraborty Sukalyan (November 2013) “Water Quality Indices- Important Tools for Water Quality Assessment: A Review” International Journal of Advances in Chemistry (IJAC) Vol.1, No.1.
[16] Shivaprasad H, Dr.D.P.Nagarajappa, Ravichandra K, Prasanna Kumar G.R, Kedarraya Mallanna, Savita Kubakaddi (April 2015)“An Assessment of Groundwater Quality Index in Bommasandra Area, Bengaluru city, Karnataka State, India” International Journal Of Engineering Research and Applications, ISSN : 2248-9622,Vol. 5, Issue 4,(Part-6), pp.90-96.
[17] Salin Peter, Sreedevi C “Water Quality Assessment and GIS Mapping of Ground Water around KMML Industrial Area, Chavara”
[18] K.Ambiga, Dr. R. Anna Durai “use of geographical information system and water quality index to assess groundwater quality in and around ranipet area, vellore district, tamilnadu” International Journal of Advanced Engineering Research and Studies, E-ISSN: 2249-8974.
[19] Kalpana G R, Nagarajappa D P “An assessment of Groundwater Quality Index in Vidyanagar, Davanagere City, Karnataka State, India” International Journal of Emerging Engineering, Volume 4,Issue 6, June 2014.
[20] S.D.Jadhav, R.S. Sawant, A.G.Godghate, S.R. Patil, R.S. Patil (April-June 2012) “assessment of ground water quality of ajara tahsil from maharashtra”ISSN: 0974-1496, Vol. 5, No.2, pp. 246-249.
[21] Natarajan Venkat Kumar*, Samson Mathew, Ganapathiram Swaminathan (2010)” Analysis of Groundwater for Potability from Thiruchirappalli City Using Back propagation ANN Model and GIS”, Journal of Environmental Protection, 2010, I, 136-142. [22] A.Ponniah Raju, Dr. N. Chandrasekhar, S.Saravanan (2013)
“Spatial Analysis of Groundwater Quality Investigation in North Chennai, Tamil Nadu, India”, International Journal of Water Research, Vol. 1, pp.1-9.
[23] Mohamed HaniphaM, Zahir Hussain A. (January 2013)”Study of Groundwater Quality at Dindigul Town, Tamilnadu, India”, International Research Journal of Environment Sciences, Vol. 2(1), pp.68-73.
[24] M. R. G. Sayyed, G. S. Wagh, A. Supekar (2013) “Assessment of impact on the groundwater quality due to urbanization by hydro geochemical facies analysis in SE part of Pune city, India”, Vol. 3(2), pp. 148-159.
[25] N. Victor Babu, P. Jagadeeswara Rao, I.V.R.K.V. Prasad (march 2013) ” Impact of Municipal Solid Waste on Groundwater in the Environs of Greater Visakhapatnam Municipal Corporation Area, Andhra Pradesh, India”, International Journal of Engineering Science Invention ISSN, Volume. 2, Issue 3, PP.28-32.
[26] Gawsia John, Harendra K. Sharma and Vikas Vatsa (2014) “Impact of municipal solid waste dump on ground water quality at Danda Lokhand landfill site in Dehredun city, India”, International Journal of Environmental Sciences, Vol 5, No. 3. [27] Rizwan Ullah, Riffat Naseem Malik and Abdul Qadir (2009)”