Improving integration in construction
industry through knowledge management
in relational contracting setting: A critical
success factors approach
Bakri, AS, Ingirige, MJB and Amaratunga, RDG
Title
Improving integration in construction industry through knowledge
management in relational contracting setting: A critical success factors
approach
Authors
Bakri, AS, Ingirige, MJB and Amaratunga, RDG
Type
Conference or Workshop Item
URL
This version is available at: http://usir.salford.ac.uk/19167/
Published Date
2009
USIR is a digital collection of the research output of the University of Salford. Where copyright
permits, full text material held in the repository is made freely available online and can be read,
downloaded and copied for noncommercial private study or research purposes. Please check the
manuscript for any further copyright restrictions.
Proceedings of the
Salford Postgraduate Annual
Research Conference
(SPARC)
2009
Proceedings of the Salford Postgraduate Annual Research Conference (SPARC) 2009
This work is licensed under a Creative Commons Attribution-Non-Commercial-No Derivative Works 2.0 UK: England & Wales
You are free to copy and distribute this work or any part of it under the conditions that you give the original author(s) credit, that the work is not used for any commercial purposes, and that you do not change the work in any way.
For full details of this license, go to http://creativecommons.org/licenses/by-nc-nd/2.0/uk/
ISBN: 978-1-905732-88-3
Published by
The University of Salford Salford
Greater Manchester M5 4WT
Preface
Postgraduate research is the dynamo that drives innovative new
work at good universities, and we are particularly proud of the
work of our postgraduate students. SPARC brings together the
best of this research across key fields that well express our
university’s strong themes of enquiry. The annual SPARC
conference provides a dynamic forum for research students and
supervisors to present and discuss new knowledge, fostering
connections across disciplines that will open up areas for the
future
.
Professor Martin Hall
Vice-Chancellor, University of Salford
Welcome to the 2009 proceedings of the Salford Postgraduate Annual Research Conference (SPARC). This selection of papers provides an excellent indication of the scope and scale of the two day interdisciplinary conference, and testifies to the quality and intellectual rigour of the research projects showcased there.
One of the defining characteristics of SPARC is its openness to all disciplines and research topics. This enables the participants to set the priorities of the conference, and allows for natural themes to emerge. This process has been carried through into this publication, which represents just under half of the papers given at the conference. This broad-ranging selection of thirty nine papers spans a wealth of disciplines – from health, medical sciences, management, finance, computing, education, and the built environment through to sociology, languages, literature, media, art history and cultural studies. But across the disciplinary boundaries of the papers certain themes are clearly identifiable – social inequality, community empowerment, changing organisational cultures, new kinds of creative economies, and the impact of digital technologies on learning, finance, business and cultural consumption to name but a few.
In developing the conference presentations into full papers for this publication, the contributors have expanded upon their research questions and findings in more detail, allowing readers privileged insight into a whole host of exciting and, in many cases, very new projects. The aim is for the proceedings to extend conversations well beyond the conference itself, by opening up new audiences and readerships for this emerging research. We are pleased to make the proceedings freely available online, and believe that the open access ethos of the unrestricted sharing of knowledge is very much in keeping with the spirit of the conference.
If you would like to find out more information about the annual conference and details other support for early career researchers offered by Salford’s Graduate Studies team, please visit our website at http://www.pg.salford.ac.uk
Dr Victoria Sheppard
Contents
Issues in the Selection of Support Services for Outsourcing
Norbaya Ab Rahim, David Baldry, and Dilanthi Amaratunga………. 8
1.5 T versus 3.0 T and 3D MPRAGE versus 3D MDEFT compared using Voxel-Based Morphometry
Ihssan Abdul-Kareem……… 16
Examining and Improving the Limitations of the Gazis-Herman-Rothery Car-following Model
Hamid Al-Jameel………. 32
Calibration of visual angle car following model based on real site traffic data
Jalal Al-Obaedi……… 45
Changing Understanding of Emotion in an Educational Context
David Menendez Alvarez-Hevia……… 57
Comparison of ADMS 4 and LiDAR in the Prediction of Atmospheric Boundary Layer
Vera Bachtiar, Chris Collier, Fay Davies……… 64
Improving Integration in the Construction Industry through Knowledge Management in a Relational Contracting Setting: A Critical Success Factors Approach
Anis Sazira Bakri, Bingunath Ingirige, & Dilanthi Amaratunga………. 74
The Effect of Organisational Structure on Communication Behaviour in Libyan Public Organisations
Salh Bezweek and Charles Egbu………. 87
E-Learning Adoption in Organisations: A Review of Existing Models and Practices
Ugochukwu C. Digwo, Dumebi O. Oderinde & Mildred Brown-Houston………. 93
E-business Adoption as a Form of Management Strategy: An e-Retailing Perspective
Ugochukwu C. Digwo & Mildred Brown-Houston……… 107
An investigation into the prevalence of Toxoplasma gondii infection in Apodemus sylvaticus in North Yorkshire
Nicole Dodd, Denise Thomasson, Elizabeth Wright, Jacqueline Hughes, &
Geoff Hide………. 124
Lexical, Cultural, and Grammatical Translation Problems Encountered by Senior Palestinian EFL Learners at the Islamic University of Gaza, Palestine
Exploration Study of the Fishing Industry of Libya
Nagat Elmsallati, Prof. David Eaton………. 147
The Impact of Contingent Factors on the Use of Performance Measurement Systems in the Banking Industry: The Case of Libya
Gumma Fakhri, Roger Pegum, Karim Menacere………... 153
Appraisal for NHS doctors: a political wand or window dressing? (working paper)
Cao Fang, Frank Worthington & Elain Eades……… 170
Current Usability Metrics for Mobile Computing Evaluation
Azham Hussain and Maria Kutar………. 185
Mobility, Space, and Deserts: Urban Areas in Need of Precipitation
Bob Jeffery……… 191
Factors hindering the adoption of E-learning in developing countries: Libya a case study - Methodological Perspectives
Abdulbasit S. Khashkhush, Professor David Eaton………. 204
Time for Magic: An Investigation into Jamie Reid’s Druid Ancestry
Vicki Maguire……… 211
Defining Sustainability in Terms of Independent Filmmaking
Nico Meissner………. 221
Social Enterprise Applications in an Urban Facilities Management Setting: Research Methodological Perspectives
Siti Uzairiah Mohd Tobi, Dilanthi Amaratunga………. 238
Translators as Bridge-Builders between Cultures: Fact or Fiction?
Maria Nader………. 252
Identifying and classifying stakeholders of post-disaster housing reconstruction projects in Sri Lanka
Nuwani Siriwardena, Richard Haigh & Bingunath Ingirige……… 261
Managing Disaster in Indonesia
Taufika Ophiyandri, Dilanthi Amaratunga & Chaminda Pathirage……….. 278
The Retrospective Iconicity of ‘Guerrillero Heroico’
Mike Parker……… 292
Implications of the initial overt decisions on lung nodule detection from chest radiographs
A Clockwork Orange: A Unique Challenge for the Translator
Ines Radionovas……… 316
Importance of quantifying orthotic correction of Adolescent Idiopathic Scoliosis: a retrospective study
Abdulla Rafiu, Stephen Hutchins………. 325
A Framework for Geo-Spatial Data Sharing Norzamni Salleh & Professor Farzad
Khosrowshahi………... 332
Towards a Research Design to Investigate Assessment Practices in Built Environment Undergraduate Education
Lloyd Scott and Christopher Fortune……….. 344
The hospital as a physical space: accommodating children’s needs
Elham Sfandyarifard, Patricia Tzortzopoulos & Monty Sutrisna……… 353
Heaven, Hell and Complementarity: Opposition and Duality in late-Georgian and Regency England
Christine Simon………. 358
An ethnographic study of the culture in a Diagnostic Imaging department (DID) – some initial findings
Ruth Strudwick………. 364
The significance and co-dependency of ‘Robustness’ from the perspective of the Granting Authority in a PFI project environment
Gerald Sundaraj, Prof. David Eaton………. 374
Remediated Swing and the Celestial Jukebox: new ‘friends’ for jazz?
Tom Sykes………. 390
Using Virtual Learning Environment: Supporting Teaching and Learning,) and Bridging the Digital Divide in Rural Communities in Ghana
Najim Ussiph……… 396
An Uncertain Future for Urban Vegetation
Nicola Jane Wallbank & Philip James……… 409
A Voice for the People: the role of Social Media technologies in Community Empowerment and Regeneration
Eileen Wattam……… 417
An Introduction to the Poetry of Selima Hill
Issues in the Selection of Support Services for Outsourcing
Norbaya Ab Rahim, David Baldry, and Dilanthi Amaratunga, School of the Built and Human Environment, University of Salford
Abstract
Outsourcing of support services (non-core activities) has now become an established trend for many UK organisations, both in the private and public sectors. The public healthcare sector is not excluded from this. Outsourcing, once used as a means to reduce costs, has now acquired strategic significance in organisations. Very little research has been carried out on the decision-making process of outsourcing in the public sector, particularly in healthcare. For many years, organisations have outsourced their support services to best-in-class service providers. This paper reviews the available literature on critical decision making in outsourcing support services, with particular emphasis on the selection process. It can be concluded that not only support services (non-core activities) are candidates for outsourcing; there are proposals to outsource core activities under certain circumstances. Understanding among staff about which activities in the organisation are core and non-core is also important. Therefore, it is crucial for organisations to make correct decisions when deciding which activities to outsource, as they have a substantial effect upon the future of the organisations.
Keywords: Decision making, outsourcing, selection, support services
Introduction
Outsourcing is not a new concept (Russell and Taylor, 2003; Yang and Huang, 2000; Yang et al., 2007; Winkleman et al., 1993). For years businesses outsourced non-core services such as catering, accounting, information technology, and payroll, or used external consultants for these services. Even the type of decision that outsourcing represents is the same as the make-or-buy decision about products, processes, and facilities that organisations have been utilising for many years (Russell and Taylor, 2003). What has changed is the type and range of services being outsourced and the extent to which outsourcing has moved from a tactical to a strategic decision (Fill and Viser, 2000; Schniederjans and Zuckweiler, 2004). Outsourcing is increasingly becoming a strategic tool for many organisations, as this engages the unique talents of highly skilled suppliers in strategically important activities (Sanders et al., 2007). Momme and Hvolby (2002) argue that outsourcing should be considered as a dynamic process, and that any decisions concerning outsourcing should be in line with the strategic direction of the organisation.
Many studies on outsourcing decision-making have focused mainly on the private sector, especially manufacturing (Momme and Hvolby, 2002; McIvor, 2000; Fill and Visser, 2000; Schniederjans and Zuckweiler, 2004; Van de Water and van Peet, 2006; Barragan et al., 2003; Canez et al., 2000; Dekkers, 2000; Sislan and Satir, 2000; Venkatesan, 1992; Welch and Nayak, 1992). This paper proceeds from the premise that there is a lack of research on outsourcing decision making in the public sector, particularly in healthcare. Its analysis is part of the authors’ doctoral research, which examines issues in the selection of support services for outsourcing in the public healthcare sector.
Outsourcing
1996). Make-or-buy is defined as “outsourcing the production process or parts of it” (Van de Water and Van Peet, 2006: 258). Outsourcing issues have been studied for many years by using nomenclature such as make-or-buy, vertical integration, or transaction cost analysis (Sanders et al., 2007). Outsourcing can be considered as a continuum. Mylott (1995) views outsourcing in terms of full outsourcing, selective outsourcing, and everything-in-between outsourcing.
Core and non-core activities
Core activity is defined as “an activity central to the company successfully serving the needs of potential customers in each market. The activity is perceived by the customers as adding value and therefore being a major determinant of competitive advantage” (McIvor, 2000: 22). Meanwhile Hassanain (2005: 73) defines core activities as “those that are essential for achieving the objectives of the organisation”. On the other hand, non-core activities are those that are not critical to competitive advantage (Lonsdale, 1999: 176). In the same vein, Hassanain (2005: 73) adds that “non-core activities represent support services which are not part of core and are routinely performed.” As stressed by Quinn and Hilmer (1994), core competencies are those activities that offer long-term competitive advantage, whereas non-core activities are those that are not critical to the organisation’s competitive edge.
Although organisations possess their own core competencies, there exist inconsistencies and lack of clarity in the way in which the personnel within the organisation interpret these capacities (McIvor, 2003). McIvor further notes that the competencies that an organisation currently has may not be competitive in the future. This happens when the demands of customers change or when competitors are more capable in a particular activity. Similarly, activities that were not core in the past may become core in the future. For example, IT (Information Technology) was perceived as a non-core activity. However, with the emergence of computerised physician and electronic health records, IT is as core to patient care as any other hospital department (Ciotti and Pagnotta, 2005).
Hamel and Prahalad (1994) assert that it is dangerous for organisations to measure their competitiveness through price factor only, as this will lead to the erosion of their core competencies. Billi et al. (2004) point out that innovation, reputation, and strategic goals can all serve as a base in determining an organisation’s unique capabilities. It is not easy to differentiate between core and non-core activities (Jennings, 1997), and determining core competencies can be tricky and risky (Lankford and Parsa, 1999). A study carried by Lacity et al. (1995) suggests that not all activities considered strategic by an organisation are strategic in reality. Therefore, it is crucial for the organisation to carefully identify which activities are core and which activities are not.
In the healthcare sector, examples of core (also known as clinical) activities are pathology, radiology, physiotherapy, and pharmaceutical. Examples of non-core (non-clinical) activities are cleaning, security, cafeteria, laundry, car parking, landscape, and waste management.
Drivers for outsourcing
There are numerous factors that encourage organisations to outsource. These include cost reduction (Fan, 2000; McIvor, 2003; Canez et al., 2000; Sanders et al., 2007; Fill and Visser, 2000; Gottschalk and Soli-Saether, 2005; Dole and Pinkard, 1993; Blumberg, 1998; Karyda et al. 2006); focus on core competencies (Fan, 2000; Hendry, 1995); improving quality (Fan, 2000; Canez et al., 2000); lack of internal skills, expertise, or capacity (Fan, 2000; Canez et el.,2000; Sanders et al., 2007; Fill and Visser, 2000); reduced time to market (Canez et al., 2000; McIvor, 2003); bandwagon effect of competitors’ outsourcing (Marshall et al., 2005); and technological change and advancement (Marshall et al., 2005; Sanders et al., 2007). Edgell et al. (2008) asserts that the drivers for outsourcing have been cyclical and tied to the economic cycle. During slower economic times, cost is the critical issue, whilst in good times other factors are of greater significance. However, it is important to note that the cost of outsourcing is not just the cost of the services, but also includes the costs of setting up relationships and monitoring and coordinating a service provider’s activities (Williamson, 1979).
to outsource can stem from policies created by government (Young, 2005); the requirements of managed care organisation or mergers (Moschuris and Kondylis, 2006); and agendas of elected officials (Young, 2005; Avery, 2000).
Although it can be argued that cost may not be the main driver for outsourcing in the public sector, there are studies that reveal that outsourcing in the public healthcare sector is motivated mainly by a desire to decrease costs, increase flexibility, share risks, focus on core competency, and increase the quality of services rendered (Yigit et al., 2007; Young, 2005). Yigit et al. (2007) further argue that outsourcing, when applied judiciously through cost and risk analysis, is a cost-effective approach that can be used by most hospitals. It should be noted that savings do not only occur through wage reductions, but also through changing work processes, rosters, and technology (Young, 2005). Although there are differences in the drivers of outsourcing between the private and public sectors, the desired benefits are nonetheless often similar (Kremic et al., 2006).
Advantages and disadvantages of outsourcing
Yang and Huang (2000) emphasise that the most important considerations for any organisations contemplating outsourcing are the potential benefits to be gained. Amongst its key advantages, outsourcing allows organisations to concentrate on core activities (Fill and Visser, 2000; Hassanain and Al-Saadi, 2005; Yang et al., 2007; Welch and Nayak, 1992; Harland et al., 2005; Hendry, 1995; Moschuris and Kondylis, 2006); improve quality of service and performance (Hassanain and Al-Saadi, 2005; Fan, 2000; Moschuris and Kondylis, 2006); have flexibility in management (Yang et al., 2007; Welch and Nayak, 1992; Fan, 2000); reduce costs (Hassanain and Al-Saadi, 2005; Welch and Nayak, 1992; Harland et al., 2005; Fan, 2000; Moschuris and Kondylis, 2006); and provide creativity and innovation (Hassanain and Al-Saadi, 2005; Welch and Nayak, 1992). Outsourcing may therefore be an attractive method of improving an organisation’s financial performance, especially in the short run (Gilley and Rasheed, 2000). However, precautions have to be taken, as long-term outsourcing contracts that have a feature of short-term savings can prove to be very expensive in the later stages (Okoroh et. al., 2001; Arminas, 2009). Outsourcing in the healthcare sector can be a cost-effective way to provide health services because it brings in additional knowledge, expertise, and infrastructure. It can also render healthcare organisations more competitive and allow them to focus on their main goal of health service provision for patients (Mackey et al., 2004; Neil, 2004; Colona and McFaul, 2004). In sum, outsourcing can become a strategic tool used by healthcare management to control costs without affecting patient care (Colona and McFaul 2004).
On the other hand, outsourcing also has drawbacks. It can lead to low employee morale (Momme and Hvolby, 2002; Yang et al., 2007; Jennings, 2002; Young, 2005); loss of management control (Hassanain and Al-Saadi, 2005; Yang et al., 2007; Quinn and Hilmer, 1994); loss of critical skills and knowledge (Quinn and Hilmer, 1994; Jennings, 2002; Young, 2005); leakage of information security and confidentiality (Momme and Hvolby, 2002; Yang et al., 2007; Jennings, 2002; Young, 2005); imitation by service providers (Momme and Hvolby, 2002); weakening of innovative capability (Hassanain and Al-Saadi, 2005); and increased monitoring and management costs (Jennings, 2002; Young, 2005). In the same vein, it was reported by the Public Accounts Committee that mismanagement of government contracts with service providers could be costing taxpayers £290 million annually. In 2007–2008 alone, £12 billion was spent on service contracts, which cost approximately £240 million to manage (McNestrie, 2009). One of the most serious threats resulting from reliance on outsourcing is declining innovation by the outsourcer (Gilley and Rasheed, 2000). In addition, as suppliers gain knowledge of the product being manufactured, they may use that knowledge to begin marketing the product on their own (Prahalad and Hamel, 1990).
Selection of activities for outsourcing
especially those that will affect the organisation’s strategic core (Lonsdale, 1999) or those that share synergies with core activities (Tadelis, 2007). However, Beaumont and Sohal (2004) postulate that if the unique activities do not possess strategic advantage, an outsourcing partnership could be considered by the organisation. On the other hand, if the organisation manages to obtain specific access and skills related to those activities, they can be kept in-house.
A survey carried out by Fan (2000) reveals that most outsourced activities are peripheral in nature. Activities that have minimal or no impact on the competitive strategy (Sislan and Satir, 2000; Lankford and Parsa, 1999) can be outsourced. Activities with non-distinct capabilities are suitable candidates for outsourcing, as are matured, commodity-like, peripheral, tedious, and monotonous activities (Welch and Nayak, 1992; Venkatesan, 1992; Karyda et al., 2006; Bertolini et al., 2004; Beaumont and Sohal, 2004). Blumberg (1998) suggests outsourcing those activities that are not on par with those of the service providers in terms of productivity and efficiency. Moreover, McIvor (2009) claims that par-performance activities can also be considered for outsourcing when service providers can obtain a similar level of performance and no competitive advantage is created by the internal provider.
In the healthcare sector, outsourcing support (non-clinical) services is more common than outsourcing the core (clinical) functions (Sunseri, 1999). The decision regarding which activities to outsource in the healthcare sector can be difficult and politically charged (Billi et al., 2004).
On the basis of the core competency theory, Gordon and Zimmerman (2007) assert that outsourcing of core competency will not be acceptable. However, there are literatures that support the outsourcing of core activities. Van de Water and Van Peet (2006) argue that core activities will qualify for some form of outsourcing if the organisation lacks important strategic knowledge or skills. Hence, they suggest that organisations develop strategic alliances with the service providers. If the benchmarking exercise indicates that the organisation is not performing, the core activity should be strategically outsourced (McIvor, 1997).
Lacity and Hirschheim (1993) caution organisations to be extra vigilant when deciding which activities to outsource. This is because the perceived non-core or commodity activities may be very important to the running of the business; thus, extra care must be undertaken when deciding to outsource. On the other hand, the perceived strategic activities may become non-core or commodity services in the near future.
Any activities that have the potential of being competitively advantageous in the future must be considered seriously. Furthermore, the organisation should build this capability, even if outsourcing seems to be a very inviting option at that point in time (Sanders et al, 2007). Activities that do not furnish the organisation with a sustainable advantage and support its core activities directly should not be outsourced.
Whilst the existing literature suggests that non-core (support) activities are best suited for outsourcing, some authors maintain that organisations should outsource core activities under certain circumstances, such as when the organisation lacks important strategic knowledge or skills for a particular activity.
How to select these activities?
Venkatesan (1992) suggests linking product differentiation, component families analysis, and manufacturing capability as a route to deciding which activities to outsource. Welch and Nayak (1992) adopt Venkatesan’s work and develop a generic framework for outsourcing decision making. They argue that in addition to the issue of costing, organisations must consider strategic and technological factors when making outsourcing decisions. Pandey and Bansal (2003) propose three criteria for selecting which activities to outsource: criticality (strategic importance), stability (volatility), and simplicity (capability).
1. What is the potential for obtaining a competitive advantage in this activity, taking account of transaction costs?
2. What is the potential vulnerability that could arise from market failure if the activity is outsourced?
3. What can be done to alleviate the vulnerability by structuring arrangements with suppliers to provide appropriate controls and allowing for necessary flexibilities in demand?
Conclusions
This paper has highlighted issues in the selection of support services for outsourcing. It has noted that differentiating core and non-core activities is not an easy task for an organisation. Organisations have to be very careful when deciding which activities to retain in-house and which to outsource. There must be a consistent understanding amongst an organisation’s staff regarding which activities are considered core and non-core. Therefore, a thorough decision-making exercise needs to be carried out to assure that outsourcing decisions do not result in a loss of competence in the near future.
References
Arminas, D. (2009) ‘Bringing it in-house made good returns,’ FM World 6 (7), p. 29.
Avery, G. (2000) ‘Outsourcing public health laboratory services: a blueprint for determining whether to privatize and how,’ Administration Review 60 (4), pp. 330–337.
Barragan, S., Cappellion, C., Dempsey, N., and Rothenberg, S. (2003) ‘A framework for sourcing product development services,’ Supply Chain Management: An International Journal (8) 3, pp. 271–280.
Barrett, P. and Baldry, D. (2003) Facilities Management: Towards Best Practice, 2nd ed.
Oxford: Blackwell Publishing.
Beaumont, N. and Sohal, A. (2004) ‘Outsourcing in Australia,’ International Journal of Operations and Production Management 24 (7), pp. 688–700.
Bertolini, M., Bevilacqua, M., Braglia, M., and Frosolini, M. (2004) ‘An analytical method for maintenance outsourcing service selection, International Journal of Quality and Reliability Management 21 (7), pp. 772–788.
Billi, J.E., Pai, C.-W., and Spahlinger, D.A. (2004) ‘Strategic outsourcing of clinical services: a model for volume-stressed academic medical centres,’ Health Care Management Review 29 (4), pp. 291–297.
Blumberg, D.F. (1998) ‘Strategic assessment of outsourcing and downsizing in the service market,’ Managing Service Quality 8 (1), pp. 5–18.
Canez, L.E., Platts, K.W., and Probert, D.R. (2000) ‘Developing a framework for make-or-buy decisions,’ International Journal of Operations and Production Management 20 (11), pp. 1313–1329.
Chase, R.B., Jacobs, F.R., and Aquilano, N.J. (2004) Operations Management for Competitive Advantage, 10th Edition. Boston: Irwin/McGraw-Hill.
Ciotti, V. and Pagnotta, B. (2005) ‘The other side of outsourcing,’ Healthcare Financial Management 59 (2), pp. 38–41.
Colona, J. and McFaul, W. (2004) ‘Hospitals reconsider outsourcing key support and clinical departments, Health Care Strategic Management 22 (7), pp. 11–14.
Dekkers, R. (2000) ‘Decision model for outsourcing and core competencies in manufacturing,’ International Journal Production Research 38 (17), pp. 4085–4096.
Dole, D. and Pinkard, L. (1993) ‘The outsourcing source book,’ Journal of Business Strategy 14 (3), pp. 52–56.
Fan, Y. (2000) ‘Strategic outsourcing: evidence from British Companies,’ Marketing Intelligence and Planning 18 (4), pp. 213–219.
Fill, C. and Visser, E. (2000) ‘The outsourcing dilemma: a composite approach to the make or buy decision,’ Management Decision 38 (1), pp. 43–50.
Gilley, K.M. and Rasheed, A. (2000) ‘Making more by doing less: an analysis of outsourcing and its effects on firm performance,’ Journal of Management 26 (4), pp. 763–790.
Gordon, C. and Zimmerman, A. (2007) ‘High-tech outsourcing: a benefit-cost framework,’ The American Economist 51 (1), pp. 97–105.
Gottfredson, M., Puryear, R., and Phillips, S. (2005) ‘Strategic sourcing: from periphery to the core,’ Harvard Business Review 83 (2), pp. 132–139.
Gottschalk, P. and Solli-Saether, H. (2005) ‘Critical success factors from IT outsourcing theories: an empirical study,’ Industrial Management and Data Systems 105 (6), pp. 685–702.
Hamel, G. and Prahalad, C.K. (1994) Competing for the Future. Boston: Harvard Business Press.
Harland, C., Knight, L., Lamming, R., and Walker, H. (2005) ‘Outsourcing: assessing the risks and benefits for organisations, sectors and nations,’ International Journal of Operation and Production Management 25 (9), pp. 831–850.
Hassanain, M.A. and Al-Saadi, S. (2005) ‘A framework model for outsourcing asset management services,’ Facilities 23 (1/2), pp. 73–81.
Hendry, J. (1995) ‘Outsourcing culture, community and networks: the hidden cost of outsourcing,’ European Management Journal 13 (12), pp. 193–200.
Jennings D. (2002) ‘Strategic sourcing: benefits, problems and a contextual model,’ Management Decision 40 (1), pp. 26–34.
Karyda, M., Mitrou, E., and Quirchmayr, G. (2006) ‘A framework for outsourcing IS/IT security services,’ Information Management and Computer Security 14 (5), pp. 402–415.
Kremic, T., Tukel, O.I., and Rom, W.O. (2006) ‘Outsourcing decision support: a survey of benefits, risks and decision factors,’ Supply Chain Management: An International Journal 11 (6), pp. 467–482.
Lacity, M.C. and Hirschheim, R. (1993) ‘The information systems outsourcing bandwagon,’ Sloan Management Review 35 (1), pp. 73–86.
Lacity, M.C., Willcocks, L.P., and Feeny, D.F. (1995) ‘IT outsourcing: maximize flexibility and control,’ Harvard Business Review May–June, pp. 94–93.
Lankford, W.M. and Parsa, F. (1999) ‘Outsourcing: a premier,’ Management Decision 37 pp. 310–316.
Lonsdale, C. (1999) ‘Effectively managing vertical supply relationships: a risk management model for outsourcing,’ Supply Chain Management: An International Journal 4 (4), pp. 176–183.
Mackey, T.A., McNiel, N.O., and Klingensmith, K. (2004) ‘Outsourcing issues for nurse practitioner practices,’ Nursing Economics 22 (1), pp. 21–32.
Marshall, D., Lamming, R., Fynes, B., and de Burca, S. (2005) ‘The development of an outsourcing process model,’ International Journal of Logistics: Research and Applications 8 (4), pp. 347–359.
McIvor, R.T. (2000) ‘A practical framework for understanding the outsourcing process,’ Supply Chain Management: An International Journal 5 (1), pp. 22–36.
McIvor, R.T. (2003) ‘Outsourcing: insights from the telecommunications industries,’ Supply Chain Management: An International Journal, 8(4) p380-394.
McIvor, R.T. (2009) ‘How the transaction cost and resource-based theories of firm inform outsourcing evaluation,’ Journal of Operations Management 27 (1), pp. 45–64.
McIvor, R.T., Humphreys, P.K., and McAleer, W.E. (1997) ‘A strategic model for the formulation of an effective make or buy decision,’ Management Decision 35 (2), pp. 169– 178.
McNestrie, A. (2009) ‘Government slated over contract management,’ FM World 6 (9), p. 6. Momme, J. and Hvolby, H. (2002) ‘An outsourcing framework: action research in the heavy
industry sector,’ European Journal of Purchasing and Supply Management 8, pp. 185– 196.
Moschuris, S.J. and Kondylis, M.N. (2006) ‘Outsourcing in public hospitals: a Greek perspective,’ Journal of Health Organization and Management 20 (1), pp. 4–14.
Mylott, T.R., III (1995) Computer Outsourcing: Managing the Transfer of Information Systems. Englewood Cliffs, NJ: Prentice Hall.
Neil, R. (2004) ‘Outsourcing that can work for your organisation,’ Material Management in Health Care 13 (6), pp. 21–23.
Okoroh, M.I., Gombera, P.P., John, E., and Wagstaff, M. (2001) ‘Adding value to the healthcare sector: a facilities management partnering arrangement case study,’ Facilities 19 (3/4), pp. 157–163.
Pandey, V. and Bansal, V. (2004) ‘A decision-making framework for IT outsourcing using the analytic hierarchy process,’ International Conference on Systemics, Cybernetics and Informatics, Hyderabad, India.
Prahalad, C.K. and Hamel, G. (1990) ‘The core competence of the corporation,’ Harvard Business Review July–August, pp. 79–91.
Probert, D.R. (1996) ‘The practical development of a make or buy strategy: the issue of process positioning,’ Integrated Manufacturing Systems 7 (2), pp. 44–51.
Quinn, J.B. and Hilmer F.G. (1994) ‘Strategic outsourcing,’ Sloan Management Review 35 (4), pp. 43–55.
Russell, R.S. and Taylor, B.W. (2003) Operations Management, 4th ed. Upper Saddle River, NJ:
Prentice-Hall.
Sanders, N.R., Locke, A., Moore, C.B., and Autry, C.W. (2007) ‘A multidimensional framework for understanding outsourcing arrangements,’ The Journal of Supply Chain Management: A Global Review of Purchasing and Supply 43 (4), pp. 3–15.
Schniederjans, M.J. and Zuckweiler, K.M. (2004) ‘A quantitative approach to the outsourcing-insourcing decision in an international context,’ Management Decision 42 (8), pp. 974– 986.
Sislan, E. and Satir, A. (2000) ‘Strategic sourcing: a framework and a case study,’ The Journal of Supply Chain Management: A Global Review of Purchasing and Supply 36 (3), pp. 4– 11.
Sunseri, R. (1999) ‘Outsourcing on the outs,’ Hospitals and Health Networks 73 (10), pp. 46, 48, 50–52.
Tadelis, S. (2007) ‘The innovative organization: creating value through outsourcing,’ California Management Review 50 (1), pp. 261–277.
Van de Water, H. and van Peet, H.P. (2006) ‘A decision support model based on the analytic hierarchy process for the make or buy decision in manufacturing,’ Journal of Purchasing and Supply Management (12) 5, pp. 258–271.
Venkatesan, R. (1992) ‘Strategic outsourcing: to make or not to make,’ Harvard Business Review 70 (6), pp. 98–107.
Welch, J.A. and Nayak, P.R. (1992) ‘Strategic sourcing: a progressive approach to make or buy decision,’ Academy of Management Executive 6 (1), pp. 23–30.
Williamson, O. (1979) ‘Transaction cost economics: the governance of contractual relations,’ Journal of Law and Economics 22 (2), pp. 233–261.
Yang, C. and Huang, J.B. (2000) ‘A decision model for IS outsourcing,’ International Journal of Information Management 20 (3), pp. 225–239.
Yang, D-H., Kim S. Nam, C., and Min, J.-W. (2007) ‘Developing a decision model for business process outsourcing,’ Computers and Operations Research 34 (12), pp. 3769–3778. Yigit, V., Tengilimoglu, D., Kisa, A., and Younis, M.Z. (2007) ‘Outsourcing and its implications
for hospital organizations in Turkey,’ Journal of Health Care Finance 33 (4), pp. 86–92. Young, S. (2005) ‘Outsourcing in the health sector: the interplay of economics and politics,’
1.5 T versus 3.0 T and 3D MPRAGE versus 3D MDEFT compared using
Voxel-Based Morphometry
Ihssan Abdul-Kareem, School of Health Sciences, Division of Medical Imaging and Radiotherapy, University of Liverpool
Abstract
Objective using VBM to unveil whether scanning same subjects at different field strengths or with different pulse protocols may or may not introduce gray and white matter brain differences that may be falsely interpreted as biological ones.
Subjects and Methods 10 healthy adults (5 males and 5 females) with an average age of 31 years were scanned thrice, once at 1.5T using MPRAGE and twice at 3.0T using MPRAGE and MDEFT pulse sequences. Two VBM comparisons of gray and white matter were made using SPM5: 1.5T MPRAGE versus 3.0T MPRAGE and 3.0T MPRAGE versus 3.0T MDEFT.
Results several gray and white matter differences were detected over the whole brain in both comparisons. These differences were more prevalent in 1.5T versus 3.0T comparison as well as in 3.0T less than 1.5T and MDEFT less than MPRAGE contrasts.
Conclusions as we compared same subjects in both comparisons, these gray and white differences observed in our study are technical non-biological differences that are due to differences in signal to noise ratio, contrast to noise ratio and artefacts. We propose that combining scans obtained at different field strengths or with different pulse sequences in MR studies is not without the bias of introducing technical variabilities that might adversely affect validity and reliability of these studies. The same precaution should be considered when comparing results obtained from studies using different field strengths and/or different pulse sequences.
Key words: Scanner comparison, 1.5 Tesla, 3.0 Tesla, MPRAGE, MDEFT, VBM.
1.0 Introduction
With the increase use of MRI scanners operating at field strength higher than 1.5 Tesla- such as 3.0 Tesla- in research and clinical fields, there is an increasing demand to unveil whether the results obtained from a 3.0 T scanner are comparable to those of a 1.5 T scanner. From the ‘MR physics’ point of view, there are many differences between scans obtained at these field strengths. The shift to a higher field strength [1-4] offer the advantages of shorter examination times, improved chemical selectivity, increased signal to noise ratio (SNR) and higher image contrast which together with the improved SNR lead to higher contrast to noise ratio (CNR). However, it has the disadvantages of decreasing T1 tissue contrast as well as increasing acoustic noise, chemical shift artefacts and susceptibility-induced geometric distortion inversely affecting image quality. These latter effects have been used to advantage in MR spectroscopy and fMRI[5, 6], respectively. Finally, the use of high field strengths increases the likelihood of exceeding regulatory limits of specific absorption rate beside the uncertainty of MR compatibility and safety profiles when using these field strengths.
was found that imaging at 3.0 T would permit more lesion detection in acute optic neuritis[10], multiple sclerosis[11] and produce higher contrast between tumor and normal brain following the administration of gadolinium as compared to 1.5 T[12, 13].
Combining structural images obtained from scanners of different field strengths may be justified as a time saving procedure allowing researchers to obtain large number of images in a short time. However, variations in imaging parameters through the use of different field strengths can result in changes in contrast properties of resulting images that are independent of the underlying tissue but rather reflect the physics of the imaging process[14]. It is, therefore, of extreme importance to know whether these changes in contrasts properties may introduce differences and variability in morphometric brain measures that do not reflect biological effects but rather technological ones and thus should be minimized. This is especially true for scanners operating at 1.5T and 3.0T field strengths as they are the most commonly used scanners in clinical MRI centres.
Apart from field strength, it is also important to rule out whether the use of different pulse protocols may introduce non-biological variations in scans. The dramatic development in the field of neuroimaging both in research and clinical fields led to an increase demand of obtaining three dimensional (3D) T1-weighted structural brain scans with high resolution, CNR, SNR and a short acquisition time. Such structural scans are widely used in research and clinical practices. The most commonly used pulse sequences for obtaining scans with such characteristics are MPRAGE (Magnetization-Prepared Rapid Gradient-Echo imaging)[15, 16] and the relatively new, MDEFT (Modified Driven Equilibrium Fourier Transform) [17, 18]. MPRAGE sequence has been optimized for structural brain imaging at field strengths of 1.5 T[19], 2.0T[20] and 3.0 T[21]. MDEFT sequence, on the other hand, has been widely used for T1 weighted structural brain imaging especially at high field strengths[17] as it is suggested to provide a good contrast between gray matter (GM) and white matter (WM). Basically, It has been used for anatomical brain imaging at 4.0T[18], 8.0T[22] and, more recently, optimized for 1.5 T and 3.0 T field strengths[23]. Both MPRAGE and MDEFT are gradient echo sequences that use 3D (FLASH) (Fast Low Angle Shot) imaging technique for data acquisition[24] with very short repetition time, echo time and very low flip angle. Both were used in fMRI studies as a reference for functional scans (which usually display low spatial resolution and reduced tissue contrast)[25, 26], in volumetric studies[27], and – particularly relevant to our study - both MPRAGE[28-30] and MDEFT[31-33] had been widely used in morphometric studies such as voxel-based morphometry (VBM) as the excellent GM/WM contrast and high spatial resolution they provide cam be used to advantage allowing accurate voxel-wise comparison. In clinical practice, the rapidity of acquisition and the capability of 3D rendering make MPRAGE an ideal sequence[34]. It has been shown to be effective in improving the sensitivity of lesion detection in patients with multiple sclerosis[10, 35], brain tumors[12, 13, 36], as a complementary sequence to improve inner ear and facial nerve imaging[37, 38], as the technique of choice for the examination of ENT tumors near the base of skull[39] and in simplifying and enhancing brain tissue segmentation[40].
To date, the previously published studies pointed out that MPRAGE is less favourable than MDEFT in high field strengths: at lower field strengths (<3.0 T), MPRAGE provide good GM/WM contrast; however, it performs more poorly at higher field strengths due to the longer T1 values and here the MDEFT was proposed to have advantage[17, 45]. Another advantage of MDEFT over MPRAGE is its relative insensitivity to inhomogenities in B1 field[3]. A study [46]that compared T1-wighted 3D images obtained at 3.0 T using 3 sequences (FLASH, MPRAGE and MDEFT) in humans and phantoms reported that MDEFT has the highest CNR efficiency making this sequence ideal for applications that require WM-GM tissue segmentation such as the VBM. The authors suggested that at 3.0 T, it is preferable to implement MDEFT with parallel-imaging or partial k-space sampling methods to reduce the scan time than to use MPRAGE. These findings were replicated by another 3.0 T study[47] conducted on post-mortem brains reporting that MDEFT sequence is optimum for GM/WM contrast with contrast values superior to those of MPRAGE. Despite these advantages, the MDEFT sequence has not been used widely in research and clinical practices possibly due to its relative recent introduction and the lack of sufficient baseline data. As this sequence was originally designed for high field strengths, a comparison between it and the MPRAGE sequence in high field strength such as the 3.0 T would be valuable.
interpreted as biological ones, we use VBM technique[48] as it provides an objective examination of the whole brain. We perform two comparisons: first, we use VBM to compare scans of healthy subjects obtained at two field strengths (1.5 T and 3.0 T) using identical pulse protocol (T1-3D MPRAGE). In the second, we use same technique for comparing scans of same subjects but obtained using two different pulse protocols (T1-3D MPRAGE and T1-3D MDEFT) both at a field strength of 3.0 T.
2.0 Materials and methods
2.1 Subjects
10 right handed subjects of both sexes (5 males and 5 females) with a mean age of 31 years and a standard deviation of 6 years were participated in this study. All subjects were in good neurological and psychological health as assessed by a complete medical questionnaire including medical history. All subjects have given fully informed written consent to participate in this study that was approved by the local research ethics committee.
2.2 MRI data acquisition
High resolution 3D T1-weighted MR images were acquired on a SYMPHONY 1.5 T and TRIO 3.0 T whole body MRI imaging system (SIEMENS, MAGNETOM, GERMANY). Each subject was scanned three times, once on the 1.5 T scanner and twice on the 3.0 T scanner. In five subjects, all three scans were conducted at the same day and in the rest, scanning was conducted at two separate days with an average of one month duration between examinations during which subjects have not suffered from any neurological or psychological illness and have not taken any specific drug or underwent surgical operations.
On the 1.5 T scanner, subjects were examined using a 3D MPRAGE pulse sequence (TR = 2040 ms, TE = 3.93 ms, TI = 1100 ms, flip angle = 15○) using 8 channels –receive only-head coil and a bandwidth of 130 Hz/Px. A field of view (FOV) of 25.6 cm was used with an acquisition matrix of 256 X 224 producing 176 contiguous T1-weighted sagittal slices with slice thickness of 1 mm. Acquired images were of voxel size 1.0 X 1.0 X 1.0 mm, the acquisition time was 7 minutes and 38 seconds and the number of excitations was 1.0.
On the 3.0 T scanner, subjects were examined using 3D MPRAGE and 3D MDEFT pulse sequences. All images were obtained using 8 channels –receive only-head coil and whole body transmit coil. For the 3D MPRAGE sequence, the parameters were (TR = 2300 ms, TE = 4.37 ms, TI = 1100 ms, flip angle = 8○) with a bandwidth of 190 Hz/Px. The FOV was 20 cm with an acquisition matrix of 320 X 320 producing 192 contiguous sagittal slices with slice thickness of 1 mm. Acquired images were of voxel size 0.6 X 0.6 X 1.0 mm, the acquisition time was 12 min and 18 s and the number of excitations was 1.0. For the 3D MDEFT sequence, the parameters were (TR = 7.92 ms, TE = 2.48 ms, TI = 910 ms, flip angle = 16○) with a bandwidth of 195 Hz/Px. A FOV of 25.6 cm with an acquisition matrix of 256 X 240 producing 176 contiguous sagittal slices with slice thickness of 1 mm. Acquired images were of voxel size 1.0 X 1.0 X 1.0 mm, the acquisition time was 12 minutes and 51 seconds and the number of excitations was 1.0.
In short, the 3D MPRAGE pulse sequence consists of a three-step cycle [15]: (a) magnetization preparation for contrast control (a 180○ inversion pulse inverts the magnetization yielding the T1 contrast); (b) data acquisition using a FLASH sequence[24] with very short repetition time, echo time and very low flip angle; and (c) magnetization recovery for additional contrast control. An additional phase-encoding gradient in the slice selection direction is applied for 3D Fourier transform imaging.
2.3 VBM analysis
Voxel-based morphometric analysis of data was performed using SPM5 software (Statistical Parametric Mapping, Wellcome Department of Imaging Neuroscience, University College London, UK; available at http://www.fil.ion.ucl.ac.uk/spm) implemented in MATLAB & SIMULINK, version 7.4.0.287 - R2007a., The MathWorks, Inc., Natick, MA, USA.
Generally speaking, VBM technique is based on four main steps: first, spatial normalization of structural images to the same stereotactic space which involves estimating the optimum 12-parameter affine transformation that maps individual MRI images to a template and correcting for global nonlinear shape differences, which are modeled by a linear combination of smooth spatial basis functions. This method does not attempt to match every cortical feature exactly, but merely corrects for global brain shape differences. Second, segmentation of the normalized images into tissue types (GM and WM). this is achieved by combining a priori probability maps or “Bayesian priors” with a mixture model cluster analysis which identifies voxel intensity distributions of particular tissue types. The segmentation step also incorporates an image intensity non-uniformity correction to account for smooth intensity variations caused by different positions of cranial structures within the MRI coil. Third, smoothing segmented images which is done by convolving with a 3D Gaussian kernel defined by its full-width-at-half-maximum (FWHM). This step has the advantages of (a) ensuring that each voxel in the images contains the average amount of GM or WM from around the voxel, (b) rendering the data more normally distributed thus increasing the validity of parametric statistical tests (c) potentially increasing SNR and (d) compensating for the inexact nature of the spatial normalization thus reduces the effective number of statistical comparisons. Fourth, performing a statistical analysis to localize significant differences between experimental groups that will be displayed in a statistical parametric map (SPM).
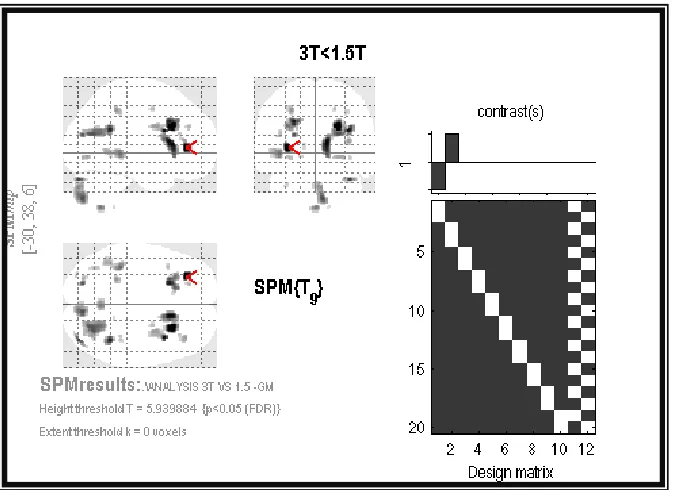
Unlike older versions of SPM such as SPM99 and SPM2, the spatial normalization step is not required in SPM5 in which the segment button allows this step to be achieved using a different objective function which does not rely on a simple relationship between the intensities of a pair of images. By using unified segmentation, tissue classification, bias correction and non-linear warping could be combined within the same framework[49]. Prior to segmentation, images were realigned to the anterior commissure to achieve better registration. Images were then segmented into two tissue classes: GM and WM and then smoothed using an isotropic Gausian Kernel with FWHM of 10 mm. Finally, the smoothed images were statistically analyzed using an SPM5 group comparison. We performed a paired t-test to test for regional differences in GM and WM between two conditions (brain scans generated at 1.5 T versus those generated at 3.0 T, both obtained using MPRAGE sequence) and (brain scans obtained using MPRAGE versus those obtained using MDEFT pulse sequences, both generated at 3.0T field strength). We assumed that scans have equal variance as we compared scans of same subjects. Results were thresholded at P (FDR- corrected) < 0.05.
3.0 Results
For each comparison, we defined two contrasts: a) 3.0T greater than 1.5T and 3.0T less than 1.5T and b) MDEFT greater than MPRAGE and MDEFT less than MPRAGE. We applied these contrasts for GM and WM comparisons which ultimately resulted in having eight (SPM. mat) files being analyzed. We used the Talairach client available online at http://www.talairach.org/client.html to delineate the location of each significant cluster. For GM differences, localization of regions was according to the nearest gray matter voxel while for WM differences, localization was restricted to a single point.
Figure 1. Statistical parametric maps, in sagittal, coronal and axial projections, showing clusters of increased gray matter in 3.0 Tesla MPRAGE scans relative to 1.5 Tesla MPRAGE scans.
[image:21.595.126.463.374.619.2]Figure 3. Statistical parametric maps, in sagittal, coronal and axial projections, showing clusters of decreased white matter in 3.0 Tesla MPRAGE scans relative to 1.5 Tesla MPRAGE scans.
Figure 5.
Statistical parametric maps, in sagittal, coronal and axial projections, showing clusters of decreased white matter in
[image:23.595.82.450.49.315.2]3.0 Tesla MDEFT scans relative to 3.0 Tesla MDEFT scans
Figure 6. Susceptibility artefacts in the regions of nasal cavity and paranasal air sinuses (dotted box) in midline sagittal images of the same subject. A. 3.0T MDEFT sequence. B. 3.0T MPRAGE sequence. The artefacts are more prominent with the MPRAGE sequence.
Table 1. 3.0T greater than 1.5T GM differences.
*P<0.05 (FDR corrected) BA, Brodmann area
Table 2. 3.0T greater than 1.5T WM differences.
*P<0.05 (FDR corrected)
Table 3. 3.0T less than 1.5T GM differences.
X Y Z *Z score Region BA
10 -20 66 7 Right cerebrum, frontal lobe, precentral gyrus 6 -12 -16 60 6.2 Left cerebrum, frontal lobe, precentral gyrus 6 -44 6 30 6.3 Left cerebrum, frontal lobe, inferior frontal gyrus 9 -40 42 -8 6.1 Left cerebrum, frontal lobe, middle frontal gyrus 47
12 -9 4 5.2 Right cerebrum, sublobar, thalamus, ventral lateral nucleus
-16 104 - -4 5 Left cerebrum, occipital lobe, cuneus 18
14 -60 -38 5 Right cerebellum, posterior lobe, cerebellar tonsil
X Y Z Z
score Region
16 2 -30 2.5 Right cerebrum, limbic lobe, uncus
-22 -68 -38 3.5 Left cerebellum, posterior lobe, cerebellar tonsil 32 -44 -42 3.4 Right cerebellum, posterior lobe, cerebellar tonsil
X Y Z *Z score Region BA
-30 38 6 5.9 Left cerebrum, frontal lobe, middle frontal gyrus 10
36 38 12 4.3 Right cerebrum, frontal lobe, middle frontal gyrus 10
-22 40 28 4.2 Left cerebrum, frontal lobe, superior frontal gyrus 9
30 4 28 5.8 Right cerebrum, frontal lobe, precentral gyrus 6
-22 20 34 4.3 Left cerebrum, frontal lobe, middle frontal gyrus 8
-28 26 28 3.7 Left cerebrum, frontal lobe, middle frontal gyrus 9
-40 18 18 3.6 Left cerebrum, frontal lobe, middle frontal gyrus 46
* P<0.05 (FDR corrected) BA, Brodmann area
Table 4. 3.0T less than1.5T WM differences
34 -34 44 4.3 Right cerebrum, parietal lobe, inferior parietal lobule 40
-26 38 46 5.6 Left cerebrum, parietal lobe, post central gyrus 3 -40 -34 0 4.7 Left cerebrum, temporal lobe, subgyral
-44 -50 2 4.2 Left cerebrum, temporal lobe, middle temporal gyrus 37
-38 -62 22 5.3 Left cerebrum, temporal lobe, middle temporal gyrus 39
38 -46 26 4.8 Right cerebrum, insula 13
-4 22 28 5.4 Left cerebrum, limbic lobe, anterior cingulate gyrus 24
12 22 10 4.2 Right cerebrum, limbic lobe, anterior cingulate gyrus 24
26 -64 22 5.8 Right cerebrum, limbic lobe, posterior cingulate gyrus 31
-14 24 -2 4.3 Left cerebrum, head of caudate nucleus -10 22 8 3.7 Left cerebrum, body of caudate nucleus 38 -34 -4 3.6 Right cerebrum, tail of caudate nucleus
28 -72 -2 3.2 Right cerebrum, occipital lobe, lingual gyrus 19 -22 -75 20 4.3 Left cerebrum, occipital lobe, cunues 18 -30 -84 -32 4.2 Left cerebellum, posterior lobe, pyramis
38 -80 -28 5.3 Right cerebellum, posterior lobe, tuber 4 -80 -34 5.4 Right cerebellum, posterior lobe, uvula
X Y Z *Z score Region
-34 10 40 5.3 Left cerebrum, frontal lobe, middle frontal gyrus 36 -4 46 5.2 Right cerebrum frontal lobe, middle frontal gyrus -12 58 -18 5.1 Left cerebrum, frontal lobe, medial frontal gyrus -30 42 20 4.3 Left cerebrum, frontal lobe, middle frontal gyrus
26 54 14 4.2 Right cerebrum, frontal lobe, superior frontal gyrus -52 4 32 5.3 Left cerebrum, frontal lobe, inferior frontal gyrus -44 34 18 4.8 Left cerebrum, frontal lobe, middle frontal gyrus
24 18 48 3.2 Right cerebrum, frontal lobe, superior frontal gyrus -16 42 46 5.4 Left cerebrum, frontal lobe, superior frontal gyrus
32 -58 38 3.3 Right cerebrum, parietal lobe, subgyral
* P<0.05 (FDR corrected)
Table 5. MD greater than MP GM differences
*P<0.05 (FDR corrected) BA, Brodmann area
Table 6. MD greater than MP WM differences
-36 -56 34 5.2 Left cerebrum, parietal lobe, angular gyrus -64 -24 -8 5.1 Left cerebrum, temporal lobe, subgyral
40 -34 -18 3.3 Right cerebrum, temporal lobe, fusiform gyrus
-60 -2 -12 4.6 Left cerebrum, temporal lobe, middle temporal gyrus
58 6 -6 3.2 Right cerebrum, temporal lobe, superior temporal gyrus
-44 -48 -18 3.3 Left cerebrum, temporal lobe, fusiform gyrus
-54 -54 16 4.6 Left cerebrum, temporal lobe, superior temporal gyrus
-8 -14 42 5.2 Left cerebrum, limbic lobe, cingulate gyrus 14 -30 42 5.1 Right cerebrum, limbic lobe, cingulate gyrus
2 -46 14 6.9 Right cerebrum, limbic lobe posterior cingulate gyrus
-26 -56 8 6 Left cerebrum, sublobar, extranuclear 38 -18 2 5.2 Right cerebrum, sublobar, extranuclear -36 -14 12 5.1 Left cerebrum, sublobar, insula
X Y Z *Z score Region BA
22 32 12 7.4 Right cerebrum, limbic lobe, anterior cingulate 32
-62 -46 -10 2.4 Left cerebrum, temporal lobe, middle temporal gyrus 21
-32 28 12 7.3 Left cerebrum, sublobar, insula 13
-54 -44 -32 3.1 Left cerebellum, anterior lobe, culmen 2 -58 -30 2.4 Right cerebellum, anterior lobe, nodule 58 -54 -26 2.4 Right cerebellum, posterior lobe, tuber
X Y Z *Z score Region
Table 7. MD less than MP GM differences
*P<0.05 (FDR corrected) BA, Brodmann area
Table 8. MD less than MP WM differences
*P<0.05 (FDR corrected)
Table 9. Unmatched scanning parameters in our study
Scanner field strength and sequence Scanning
parameters 1.5 T MPRAGE 3.0 T MPRAGE 3.0 T MDEFT
Magnetization
preparation inversion recovery Non selective inversion recovery Slice selection inversion recovery Non selective
Flip angle 15 8 16
FOV/cm 25.6 20 25.6
Matrix size 256 X 224 320 X 320 256 X 240
Voxel size 1.0 X 1.0 X 1.0 0.6 X 0.6 X 1.0 1.0 X 1.0 X 1.0
X Y Z *Z score Region BA
-18 28 34 4.7 Left cerebrum, frontal lobe, medial frontal gyrus 6
22 22 32 5.6 Right cerebrum, frontal lobe, cingulate gyrus 32
32 10 26 5.6 Right cerebrum, frontal lobe, inferior frontal gyrus
9
40 -6 26 4.7 Right cerebrum, frontal lobe, precentral gyrus 6 20 -52 24 5 Right cerebrum, parietal lobe, precuneus 31
34 -34 46 4.5 Right cerebrum, parietal lobe, post central gyrus 3
-26 -38 46 4.6 Left cerebrum, parietal lobe, post central gyrus 3
-24 -60 20 4.5 Left cerebrum, limbic lobe, posterior cingulate gyrus
31
-40 -42 2 4.3 Left cerebrum, limbic lobe, parahippocampal gyrus 19
-40 -34 0 4.2 Left cerebrum, temporal lobe, subgyral 14 12 16 4.5 Right cerebrum, body of caudate nucleus
36 -46 26 5.9 Right cerebrum, insula 13
X Y Z *Z
score Region
-4 -42 10 5.2 Left cerebrum, corpus callosum
No. of slices 176 192 176 Time of
acquisition/min 7.38 12.18 12.51
4.0 Discussion and conclusions
Our results reveal the presence of GM and WM differences in most brain regions between scans obtained at 1.5T and 3.0T as well as between scans obtained with MPRAGE and MDEFT sequences. These differences can be attributed to technical differences like (SNR, CNR and different types of artifacts) between the two comparisons rather than to real anatomical differences as we scanned same subjects in both comparisons. We use VBM technique for comparison[48] as it offers the possibility of examining the whole brain in an objective unbiased manner and has been widely used in health[52, 53] and disease[54-56].
4.1 1.5T versus 3.0T
Our results show GM and WM differences in almost all brain regions including cortical and deep cerebral regions and in cerebellum. These differences were more prevalent with 1.5T less than 3.0T as compared to 1.5T greater than 3.0T contrasts. They may be attributed to a higher SNR and CNR in 3.0T scans and to different artifacts. In theory, the intensity of MR signal is linearly correlated with the strength of the static magnetic field B0[4]. So we expect SNR to be doubled in 3.0T albeit we have not measured it. As expected[3], artifacts were higher in 3.0T scans especially motion, chemical shift and susceptibility artifacts. The longer acquisition time as compared to 1.5T may account for the higher observed motion artifacts.
A previous study that used manual tracing to compare hippocampal volumes at 1.5T and 3.0T reveal no inter-scanner differences[7]. Our results partially agree with this study in revealing no differences in the hippocampus although we might be able to reveal such differences if we used a smaller Kernel size such as 4mm [53]. We think that our study may be more reliable and applicable as we used an objective method and examined the whole brain. In neuroscience researches[57] as well as in many psychological and neurological disorders[58, 59], brain changes are often diverse involving more than one brain region. It is therefore extremely important to search for inter-scanner differences over the whole brain including both GM and WM regions rather than restricting search to one cerebral region that might mask the effect of field strength. We address this issue by selecting VBM method to examine the whole brain.
A study that used VBM to examine the effect of hormone replacement therapy on brains of postmenopausal women [60] reported no differences between scans obtained at both 1.5 and 3.0T scanners and, consequently, authors included 26 scans obtained at 1.5T scanner and 17 scans at 3.0T scanner in their voxel-wise comparison. Furthermore, they used scanners of different manufacturers (Milwaukee and Siemens). Based upon results of our study, we disagree with this study as we reported differences even when comparing same subjects and we would expect more differences when comparing different subjects. Likewise, we would expect more differences when using scanners from different manufacturers (all of our scans were obtained from Siemens scanners to decrease bias). We hypothesize that recruiting scans from two different field strengths would introduce several non-biological GM and WM differences. This assumption was kept in mind in nearly all previous VBM studies which prompted them to use scans obtained within the same scanner to ensure validity of their results[61].
4.2 MPRAGE versus MDEFT
MPRAGE and MDEFT sequences are increasingly used in research to obtain T1 scans with high resolution, CNR and SNR in a relatively short acquisition time. These inversion recovery sequences are preferred to spin echo (SE) sequence for many reasons[4]. It has been shown that using SE may lead to reduced CNR in 3.0T as compared to 1.5T due to prolongation and convergence of T1 times of GM and WM at higher field strengths [41, 62, 63]. In addition, shielding effects induced by eddy currents prevent central parts of the image from being properly excited[64] which results in reduced signal intensity in basal ganglia. Finally, there is enhancement of magnetization transfer effects at higher B0 that reduce SNR and CNR.
In contrast to inter-scanner differences, there were fewer intra-scanner differences detected when comparing MDEFT versus MPRAGE. We argue that this is because both sequences were acquired within the same scanner (i.e. same field strength) and that the type of field strength is more powerful than the type of pulse sequence in revealing these differences. Similar to inter-scanner parcellation, the differences observed are due to technical factors such as CNR, SNR and artifacts. CNR was reported to be better with MDEFT as compared to MPRAGE sequence and this may be one reason to the observed differences[46, 47]. In addition, artefacts may play a substantial role in provoking these differences. We might exclude the effect of motion artefacts from our hypotheses as acquisition time was almost identical in both sequences although slightly higher with the MDEFT one. We hypothesize that susceptibility artefacts were the major type of artefacts responsible to the observed differences. Susceptibility artefacts occur as the result of microscopic gradients or variations in the magnetic field strength that occurs near the interfaces of substance of different magnetic susceptibility. These gradients cause dephasing of spins and frequency shifts of the surrounding tissues. The net result is bright and dark areas with spatial distortion of surrounding anatomy[65]. These artefacts are worst with gradient echo sequences such as the MPRAGE and MDEFT. However, MDEFT was hypothesized to be less sensitive to susceptibility artefacts[3] which we clearly observed in our study (Figure 6).
These results show that even when selecting scans from the same scanner, non-biological GM and WM density differences may be introduced if different pulse sequences were used to obtain them thereby pointing out to the need for stabilizing the confounding effect of pulse sequence in future MR studies.
In conclusion, the study reveals in an objective, unbiased, whole brain analysis that several GM and WM differences do exist between scans obtained at different field strengths and with different pulse sequences. As we compared scans of same subjects in both conditions, differences observed are not real biological differences rather they result from technical variations such as SNR, CNR and artifacts. In this context, we propose that combining scans obtained at different field strengths or with different pulse sequences in MR studies is not without the bias of introducing technical variabilities that might adversely affect validity and reliability of these studies. The same precaution should be considered when comparing results obtained from studies using different field strengths and/or different pulse sequences.
4.3 Limitations of the study
Although our findings of GM and WM differences could be attributed to using different field strengths and different pulse sequences, they may also be due to other parameters that were not unified across comparisons and so may partly account for the final differences observed. (Table 9) shows these parameters which include magnetization preparation, voxel size, and bandwidth, number of slices, matrix size and field of view. These unmatched parameters might adversely affected our VBM comparison leading to GM and WM differences not merely attributed to field strength or pulse sequence type.
Acknowledgments
(MARIARC, University of Liverpool) for her helpful suggestions and Dr Guillaume Flandin, Wellcome Trust Centre for Neuroimaging, University College London for her kind responses regarding SPM5 and VBM data analysis. Finally, I would like to thank Mrs Valerie Adams (research radiographer at MARIARC, University of Liverpool) for her great help in data acquisition and subjects’ preparation.
References
Frayne, R., et al., Magnetic resonance imaging at 3.0 Tesla: challenges and advantages in clinical neurological imaging. Invest Radiol, 2003. 38(7): pp. 385-402.
Schick, F., Whole-body MRI at high field: technical limits and clinical potential. Eur Radiol, 2005. 15(5): pp. 946-59.
Norris, D.G., High field human imaging. J Magn Reson Imaging, 2003. 18(5): pp. 519-29. Schmitz, B.L., et al., Advantages and pitfalls in 3T MR brain imaging: a pictorial review. AJNR
Am J Neuroradiol, 2005. 26(9): pp. 2229-37.
Ogawa, S., et al., Oxygenation-sensitive contrast in magnetic resonance image of rodent brain at high magnetic fields. Magn Reson Med, 1990. 14(1): pp. 68-78.
Ogawa, S., et al., Brain magnetic resonance imaging with contrast dependent on blood oxygenation. Proc Natl Acad Sci U S A, 1990. 87(24): pp. 9868-72.
Briellmann, R.S., A. Syngeniotis, and G.D. Jackson, Comparison of hippocampal volumetry at 1.5 tesla and at 3 tesla. Epilepsia, 2001. 42(8): pp. 1021-4.
Tieleman, A., et al., Comparison between functional magnetic resonance imaging at 1.5 and 3 Tesla: effect of increased field strength on 4 paradigms used during presurgical work-up. Invest Radiol, 2007. 42(2): pp. 130-8.
Barker, P.B., D.O. Hearshen, and M.D. Boska, Single-voxel proton MRS of the human brain at 1.5T and 3.0T. Magn Reson Med, 2001. 45(5): pp. 765-9.
Nielsen, K., et al., Magnetic resonance imaging at 3.0 tesla detects more lesions in acute optic neuritis than at 1.5 tesla. Invest Radiol, 2006. 41(2): pp. 76-82.
Bachmann, R., et al., FLAIR imaging for multiple sclerosis: a comparative MR study at 1.5 and 3.0 Tesla. Eur Radiol, 2006. 16(4): pp. 915-21.
Nobauer-Huhmann, I.M., et al., Magnetic resonance imaging contrast enhancement of brain tumors at 3 tesla versus 1.5 tesla. Invest Radiol, 2002. 37(3): pp. 114-9.
Ba-Ssalamah, A., et al., Effect of contrast dose and field strength in the magnetic resonance detection of brain metastases. Invest Radiol, 2003. 38(7): pp. 415-22.
Fischl, B., et al., Sequence-independent segmentation of magnetic resonance images. Neuroimage, 2004. 23 Suppl 1: pp. S69-84.
Mugler, J.P., 3rd and J.R. Brookeman, Three-dimensional magnetization-prepared rapid gradient-echo imaging (3D MP RAGE). Magn Reson Med, 1990. 15(1): pp. 152-7.
Mugler, J.P., 3rd and J.R. Brookeman, Rapid three-dimensional T1-weighted MR imaging with the MP-RAGE sequence. J Magn Reson Imaging, 1991. 1(5): pp. 561-7.
Ugurbil, K., et al., Imaging at high magnetic fields: initial experiences at 4 T. Magn Reson Q, 1993. 9(4): pp. 259-77.
Lee, J.H., et al., High contrast and fast three-dimensional magnetic resonance imaging at high fields. Magn Reson Med, 1995. 34(3): pp. 308-12.
Epstein, F.H., J.P. Mugler, 3rd, and J.R. Brookeman, Optimization of parameter values for complex pulse sequences by simulated annealing: application to 3D MP-RAGE imaging of the brain. Magn Reson Med, 1994. 31(2): pp. 164-77.
Deichmann, R., et al., Optimization of 3-D MP-RAGE sequences for structural brain imaging. Neuroimage, 2000. 12(1): pp. 112-27.