Automatic Evaluation of Best Investment Options for
Investors using Optimal Decision Tree Algorithm
Vikas Mongia
Assistant Professor Guru Nanak College, MogaGurpreet Singh
Assistant ProfessorLPU, Phagwara
ABSTRACT
Investment decision is a major issue for every individual. The spectrum of investment is extremely wide. Many investment options are available for the investor. People are not aware of best saving scheme for their investment. This paper deals with eliction of information from various domain experts to suggest the investor best investment option for his investment. The decision is based upon various parameters of the investor. A refined algorithm helps the investor to make an effective decision for his investment which suits their requirement. In this study data has been collected from 500 persons through questionnaires and interviews. Expert’s rules and feature reduction technique have been applied to this data set to convert it into an optimal dataset. Decision tree technique is applied to this dataset to make investment decisions. Finally, the comparison has been done between our approach and existing approach.
Keywords
Data mining, Decision tree, C4.5, PL/SQL, Expert rules, gain ratio, feature reduction
1.
INTRODUCTION
Investment refers to the commitment of funds at present, in anticipation of some positive rate of return in future. Investment is very important because it helps to grow our money. But, the major in India is lack of awareness. So many investment options like bank deposits, mutual funds, equity, shares, gold, post office investments etc. are available in market but people are not aware of best scheme for their investment. In this study, investment options considered are short term mutual funds (MFS), long term mutual funds (MFL), short term fixed deposits (FDS), long term fixed deposits (FDL), share market (SM), and public provident fund (PPF).
Mutual funds are those funds that are collected from many investors to invest in securities such as stocks, bonds and money markets [6]. They are operated by money managers. One major benefit of mutual funds is that it is suitable for those investors that do not have awareness of market trends but have risk tolerance power. Mutual fund schemes can be classified as short term mutual funds termed as MFS and long term mutual funds termed as MFL. Selection between MFS and MFL depends upon various attributes such as Investment purpose like (income, growth, tax saving) and loan facility requirement because loan facility is generally not available in many MFS schemes.
Share Market termed as SM is another good option of investment that gives huge returns if the investment is done meticulously.
This investment scheme is good for those investors that have good knowledge of share market and have high risk tolerance power [8]. Because, this investment in shares gives no guarantee that you will actually realize any sort of positive return.
A fixed deposit is a financial instrument provided mainly by banks [5]. This is beneficial for savings because it gives saving and investment option for short and long period. Fixed deposits can be short term fixed deposits termed in this study as FDS and long term fixed deposits termed as FDL. Tenure of FDS varies from 7, 15 or 45 days to 1.5 year. FDL have tenure more than 1.5 year to 10 years. Some FDL’s having tenure of 5 years and above also gives tax rebates to investors.
Public Provident Fund termed as PPF is another ideal investment scheme. PPF account is opened for the tenure of 15 years. It gives tax saving benefits to the investors. Another benefit of PPF is safe deposits and loan facility available against your deposits.
2.
DATA MINING TECHNIQUES
Data Mining H. Trevor, T. Robert, and F. Jerome[1] Data mining is useful to discover new patterns from the present data by using different algorithms that have been already purposed. Comparison of different tools of data mining is done by Nguyen Thai Nghe, P. Janecek, and P. Haddawy,[2]. They have suggested WEKA the best tool for data mining. Because of its computational speed and support to large datasets[3]. In this research, WEKA has been used.
Data mining is helpful to analyze the representation of data which is used to discover new and better findings. A large dataset is analyzed using various data mining tools such as text mining tools, traditional data mining, and dashboards to find the relationship among data. The job of data mining is not just to collect and manage the records; it focuses mainly on new discoveries. Data mining uses many arguments to make evaluations. Some mostly used are:
Association: it refers to the linking of one incident to another for example if people buy bread then they most likely buy butter also. If people buy software then they are most prone to buy a CD or an Antivirus. Sequence: Second argument used in data mining is
back-propagation, the datasets are processed, the results are evaluated with the predicted outcome and the error rate is returned back. The main job of back-propagation is to minimized mean squared error. K-nearest neighbor is based upon the concept of learning by analogy. In this technique the data is compared to the training data. Classification technique is used in this study to automatically evaluate best saving schemes for the investors. Clustering: The process of dividing data into different groups called clusters is called clustering. In clustering the classes are not predefined. The objects of one cluster are same to other objects in that cluster but different from objects of another cluster. The benefit of clustering is that they are easy adaptable to changes.
3.
DECISION TREE CLASSIFICATION
Han Kamber[1]Decision tree is a flow chart like tree structure, where each node denotes a test on an attribute value, each branch represents an outcome of the test, and tree leaves represent classes. Decision trees are very useful in classification. Whenever class of any tuple is not known, it is inserted at the root, by tracing path from root to leaf; class of that tuple is identified. ID3, CHAID and C4.5 are some decision tree algorithms that are widely used. In this study, C4.5 is applied to the dataset after making the dataset an optimal dataset.
In decision tree approach, tuples of training data are split by selecting an attribute that best discriminates these tuples according to class. Selection of this attribute is done by Information Gain, Gain Ratio or Gini Index method. C4.5 algorithm[4] uses Gain Ratio method for attribute selection criterion. In this method, Gain Ratio of every attribute is calculated, the results are evaluated and the highest contributing independent factor is determined that effects the output of dependent variable. The formula used for this evaluation is:
GainRatio(A) =
Where SplitinfoA(D)= - * log2 ( )
And Gain(A)= Info(D)-InfoA(D)
Here Info(D) is the expected information needed to classify data and it is calculated by the formula:
Info(D) =
-InfoA(D) represents contribution of each independent attribute
which is measured towards the dependent variable. This is done by the formula:
InfoA(D)=
In this study, Gain Ratio method is also applied on training dataset for feature reduction, to make it an optimal dataset. Gain Ratio of every independent attribute is evaluated and three attributes having minimum Gain Ratio are removed from the dataset assuming that these attributes do not contributes towards classification.
4.
OUR APPROACH
Decision tree algorithm only helps to classify data. According to existing decision tree algorithms, if a person X having some attributes invest in plan P1 then another person Y having the same
attributes must invest in plan P1. But, in real sense, it might be
possible that X’s decision was wrong. X invested in wrong plan. In our research, the data is firstly converted to an optimal dataset by applying Expert rules and then feature reduction is performed on this dataset. Finally decision tree has been constructed from this optimal dataset. The steps followed in this research are as under:
The steps followed in this research are as under:
Primary data has been collected from 500 people through questionnaires and interviews.
Training dataset has been created from this data by randomly selecting 38 rows. This data is stored in csv format.
Knowledge eliction from domain experts.
From this knowledge, rules have been created in PL/SQL code.
These rules have been applied to the data set.
Feature reduction is performed to this dataset by calculating gain ratio of every attribute and three attributes having minimum gain ratio have been deducted which results in an optimal dataset.
The optimal decision tree has been constructed using c4.5 algorithm.
Finally, comparison has been made between existing approach and our approach.
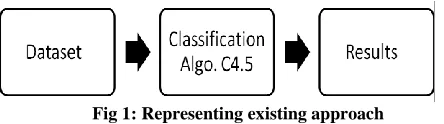
[image:2.612.319.541.511.573.2]The diagram representing existing approach and our research work is as under:
Fig 1: Representing existing approach
Fig 2: Representing our approach
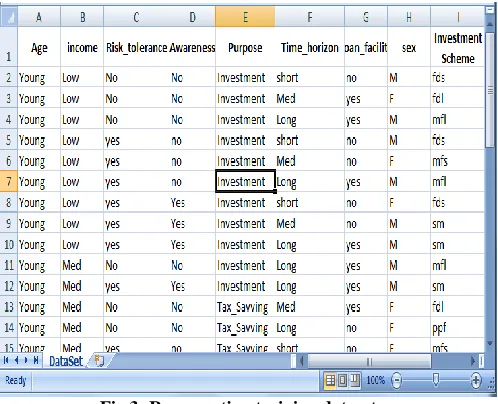
4.1 Training Dataset:
38 rows for training dataset are randomly selected from the dataset of 500 rows, which has been collected by questionnaires and interviews from the present investors.The attributes considered for the analysis of investment decision are: Age of customer, Income of investor, Risk tolerance, Loan facility required, Gender, Awareness of investment options, Purpose of investment and Time horizon.
Attribute ‘Age’ has domain values {young, middle, old}. Domain value ‘young’ has range 20-35 yrs and the range of domain values ‘middle’ and ‘old’ lies between 36-50 and 51 onwards respectively.
Another attribute ‘Risk_tolerance’ describes the risk taking ability of the investor. According to experts, people with high risk tolerance ability prefer to invest their money in stock market or mutual funds. Domain values of this attribute are {yes, no}.
‘Loan_facility’ is another attribute having domain values {yes, no}. It specifies whether investor wants to take loan against his investment or not.
Another attribute ‘Gender’ has domain values {M, F}. This attribute specifies the sex of an investor.
‘Awareness’ is another attribute which specifies awareness of the customer to the present investment options. {yes, no} are the domain values of this attribute.
Fig 3: Representing training dataset
Domain values of attribute ‘Income’ are {low, medium, high}. Investor having their annual income under 200,000 comes under domain value ‘low’. Range of ‘medium’ and ‘high’ is 2-5 Lac and above 5 Lac per annum respectively.
Another attribute ‘purpose’ has domain values {tax_saving, investment}. The investor whose primary objective is tax saving prefers those schemes that gives tax rebates under section 80C. Schemes for tax rebate considered in this study are PPF account, FDL and MFL.
Another scheme ‘Time_horizon’ attribute specifies the time duration for which investment is to be done. This attribute has domain values {short, medium, high}. Range of domain value ‘short’ is less than 3 years. It is 3-7 years for ‘medium’ and more than 7 years for ‘high’ domain value.
The class label attribute investment_schemes has 6 distinct values namely {FDS, FDL, MFS, MFL, SM, PPF} therefore it has 6 distinct classes.
4.2 Expert Rules and optimal Dataset:
Expert’s knowledge has been gathered and from that knowledge some rules have been developed in PL/SQL code.The rules developed have been in the following format:
If purpose = ‘tax_saving’ and awareness = ‘No’ and Risk_ tolerance = ‘No’ and Time_horizon = ‘Long’ and Income = ‘High’ and age = ‘Young’ then Investment_scheme = ‘PPF’
If purpose = ‘Tax_saving’ and awareness=’No’ and risk_tolerance = ‘Yes’ and time_horizon = ‘Medium’ and age = ’middle’ then Investment_scheme = ‘MFL’.
[image:3.612.53.286.71.186.2]Fig 4: Dataset After implemention of Expert Rules
This step gives us an optimal dataset that will increase accuracy of classification rules.
4.3 Feature Reduction:
Feature reduction is a technique of identifying and removing those attributes that do not contribute towards classification of the dataset. In this work, gain ratio technique is used to evaluate the worth of an attribute with respect to the class. Then rankers algorithm is used to arrange these attributes in descending order according to their gain ratio and last three attributes having lowest gain ratio are removed.Ranked attributes after applying gain ratio and Rankers algorithm:
Table 1: Representing Gain Ratio of all attributes.
Gain Ratio Attribute Name
0.638 Risk_tolerance(3)
0.452 Awareness(4)
0.417 Time_horizon(6)
0.318 Purpose(5)
0.303 Loan_facility(7)
0.284 Sex(8)
0.2 Income(2)
0.101 Age(1)
Selected attributes: 3,4,6,5,7,8,2,1 : 8
The attributes Sex, Income and Age has minimum gain ratio. These three attributes will be removed because they do not contribute toward data classification. This will result in less computation time and less memory requirement.
Fig. 5: Representing Optimal dataset
4.4 Applying Classification algorithm, C4.5
and result evaluation:
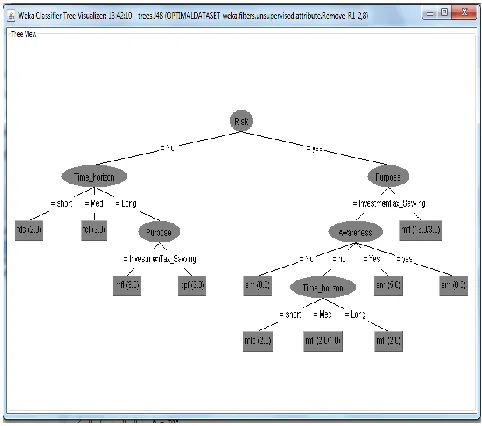
Finally, algorithm C4.5 is applied to an optimal dataset to construct an optimal decision tree. This tree will results in less error rate, consumes low memory and reduces computation time as compared to existing approach. From the investor’s point of view, the resulted classification rules will be more realistic and gives more revenue to the investor.
Fig 6: Representing final results by decision tree
[image:4.612.317.558.379.592.2]5.
RESULTS AND DISCUSSION
In this study classifiers provided in WEKA software are used for Automatic Evaluation of Best Investment Options for Investors. C4.5 algorithm is used in this study. The comparison between existing approach and our approach is made by this algorithm on the basis of computation time and accuracy.
Computation Time: The purposed technique is applied to the dataset of 5000 tuples to make it an optimal dataset and then comparison of computation time is done between existing and purposed technique.
Approach Computation time
Existing 0.1 second
[image:5.612.318.532.71.227.2]Purposed 0.06 second
Table 2: Representing comparison of computation time between existing and purposed approach.
After the refinement the computational time has reduced from 0.1 second to 0.06 second, showing a clear reduction in the computation time.
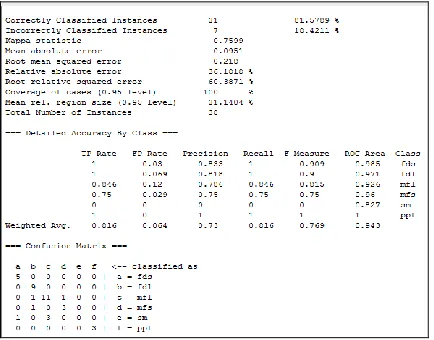
[image:5.612.66.296.197.298.2]Accuracy: The optimal dataset generated in this study increases the accuracy of classification process as compared to existing approach. The existing approach gives 81.5789% of correct classification of the data, and after refinement this has increased to 89.4737%.
[image:5.612.54.271.401.571.2]Fig 7: Representing the accuracy of Existing Approach
Fig 8: Representing the accuracy of Optimal Approach
6.
CONCLUSION AND SCOPE FOR
FUTURE
This optimal algorithm is improved based on C4.5 methods. It introduces new features such as implementation of Expert rules and feature reduction technique on large dataset. Several attempts have been made to design and develop the generic data mining system but no system found completely generic. Thus, for every domain the domain expert’s assistance is mandatory. The domain experts shall be guided by the system to effectively apply their knowledge for the use of data mining systems to generate required knowledge. By applying this optimal approach on Investor’s data, we can find out the important features that will influence investment decisions.
Moreover, supervised learning has been implemented. A user interface has been provided to the user to input various parameters. Based upon these parameters an output showing best investment scheme for the investor is displayed on the screen. This approach is better to an existing approach. The accuracy of decision has been improved by 9.6%. Computation time and memory requirement has also reduced.
This approach is capable to handle multivariate data which makes it suitable for many other applications. This research is not bounded to particular area. In this work, this optimal technique is applied to improve accuracy of investment decisions. But, other applications like Analysis of education patterns, Human talent management, risk evaluation etc can be implemented by this approach also.
7.
REFERENCES
[1] H. Trevor, T. Robert, and F. Jerome, “The Elements of Statistical Learning: Data Mining, Inference, and Prediction.” Springer, Second Edition, 2009.
[2] Nguyen Thai Nghe, P. Janecek, and P. Haddawy, “A comparative analysis of techniques for predicting academic performance", ASEE/IEEE Frontiers in Education Conference, pp. T2G7-T2G12, 2007.
[3] Weka, University of Waikato, New Zealand, http://www.cs.waikato.ac.nz/ml/weka.
[5] Income Tax and Investment Journal – (AY-2008-09)–by A.N. Agarwal (Income tax expert), Rajesh Agrwal(CA), Sanjay Kulkari (CA), and Dr. Gajanan Patil.- ABC Publication- Nagpur.
[6] Dr.Binod Kumar Singh“ A study on investors’ attitude towards mutual funds as an investment option”, International Journal of Research in Management ISSN 2249-5908 Issue2, Vol. 2 (March-2012
[7] Data Mining: Concepts and Techniques Second Edition Jiawei Han University of Illinois at Urbana-Champaign Micheline Kamber
[8] S. Saravana Kumar in his article “An Analysis of Investor Preference Towards Equity and Derivatives” published in The Indian journal of commerce, July-September 2010
[9] Mohammed M Mazid, A B M Shawkat Ali, Kevin S Tickle, ‘Improved C4.5 Algorithm for Rule Based Classification’, Recent Advances in Artificial Intelligence, Knowledge Engineering and Data Bases.
[10] Chotirat “Ann” Ratanamahatana and Dimitrious Gunopulos, ‘Scaling up the Naïve Bayesian Classifier: Using Decision Tree for Feature Selection’
[11] Jason R Beck, M Maria E Garcia, Mingyu Zhong, Michael Georgiopoulos, ‘A Backward Adjusting Strategy for the C4.5 Decision Tree Classifier’, 2007 AMALTHEA REU SITE; Beck
[12] Hamidah Jantan and Abdual Razak Hamdan ,‘Human Talent Prediction in HRM using C4.5 Classification Algorithm’ Hamidah Jantan et al. / (IJCSE) International Journal on Computer Science and Engineering Vol. 02, No. 08, 2010, 2526-2534
[13] Nur Atiqah Rochin Demong, Jie Lu and Farookh Khader Hursain, ‘Multidimensional and Data Mining Analysis for Property Investment Risk Analysis’ World Academy of Science, Engineering and Technology vol:6 2012-12-21
[14] Meenakshi Chaturvedi and Shruti Khare, study of saving pattern and investment preferences of individual household in india, volume no. 3 (2012), issue no. 5 (may), issn 0976-2183