Journal of Chemical and Pharmaceutical Research, 2014, 6(3):502-506
Research Article
CODEN(USA) : JCPRC5
ISSN : 0975-7384
Design and implementation of production logistic prediction software system
Yin Jing*, Meng Xiangying and Chennan
School of Mechanical-electronic and Automobile Engineering, Beijing University of Civil
Engineering and Architecture, Beijing, China
_____________________________________________________________________________________________
ABSTRACT
Focus on the information management in the modern chemical industry, the production logistic prediction model is set up with the objective is not only to minimize the warehousing costs, but also to reduce the machine switching time. On the base of the core model, the prediction software system of production logistic is designed and developed. At last, the implementation effectiveness is illustrated.
Key words:information management, production system, logistic prediction.
_____________________________________________________________________________________________
INTRODUCTION
In the modern chemical and pharmaceutical enterprises, management informatization has become the focus of academic research and application practice. There has been many research results obtained, such as ERP, OA, MES and etc , which make the working efficiency get improved[1].Meanwhile, as for working site management, especially
for the increasingly complex logistic optimization, there rarely been realized by software system. The design idea of logistic information system for chemical and pharmaceutical enterprises is discussed in [2]. On the logistic prediction, the bottleneck closed loop method based on bottleneck polymorphism is proposed in [3]. In the paper, by deeply analysis of the process flow in the production line, the optimization model of logistic prediction is setup. On this basis, the application software system is implemented, by which the real time machine unit prediction and inventory prediction can be realized.
PROCESS FLOW ANALYSIS
III. LOGISTICS PREDICTIONMODELSETUP
In order to convenient, introduce the following signs:
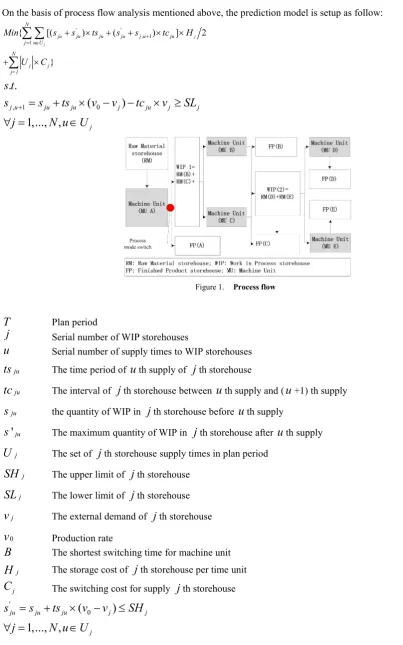
On the basis of process flow analysis mentioned above, the prediction model is setup as follow:
' '
, 1 1
{ [( ) ( ) ] 2
} j
j
N
ju ju ju ju j u ju j u U
N
j j j=1
Min s s ts s s tc H
U C
(1). .
s t
, 1
(
0)
1,..., ,
j u ju ju j ju j j
j
s
s
ts
v
v
tc
v
SL
j
N u U
[image:2.595.70.474.100.746.2]
(2)Figure 1. Process flow
T
Plan periodj
Serial number of WIP storehousesu
Serial number of supply times to WIP storehousesju
ts
The time period ofu
th supply ofj
th storehouseju
tc
The interval ofj
th storehouse betweenu
th supply and (u
+1) th supplyju
s
the quantity of WIP inj
th storehouse beforeu
th supply'
jus
The maximum quantity of WIP inj
th storehouse afteru
th supplyj
U
The set ofj
th storehouse supply times in plan periodj
SH
The upper limit ofj
th storehousej
SL
The lower limit ofj
th storehousej
v
The external demand ofj
th storehouse0
v
Production rateB
The shortest switching time for machine unitj
H
The storage cost ofj
th storehouse per time unitj
______________________________________________________________________________
'
,
,
,
ju ju ju ju
s s ts tc
Z
(5)(
),
1, ,
j
ju ju
u U
T
ts
tc
j
N
(6)The objective function is to minimize the cost of warehousing and machine process switching, as formular (1). Formula (2) represents the quantity balance of WIP. Formula (3) represents the maximum of WIP in storehouses must meet with the content limit. Formula (4) represents the minimum switching time period and supply interval is non-negative. Equation (5) represents the all variables data type are integer. The Equation (6) represents the machine units cannot be idle. Deb et al. put forward the NSGA II algorithm, and is one of the most effective evolutionary algorithm by far[4], this paper adopts the NSGA II algorithm to solve the above example, crossover
probabilityPc0.7; Mutation probability Pm 0.1.
IV. SOFTWAREDESIGN
A. Database Design
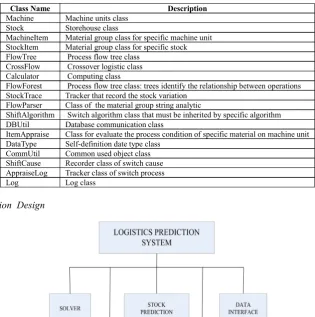
[image:3.595.148.464.285.603.2]SqlSever 2000 is adopted and there are totally eighteen classes defined in the database, as shown in table 1.
TABLE I. CLASS DEFINITION IN THE PROGRAM
Class Name Description
Machine Machine units class
Stock Storehouse class
MachineItem Material group class for specific machine unit
StockItem Material group class for specific stock
FlowTree Process flow tree class
CrossFlow Crossover logistic class
Calculator Computing class
FlowForest Process flow tree class: trees identify the relationship between operations
StockTrace Tracker that record the stock variation
FlowParser Class of the material group string analytic
ShiftAlgorithm Switch algorithm class that must be inherited by specific algorithm
DBUtil Database communication class
ItemAppraise Class for evaluate the process condition of specific material on machine unit
DataType Self-definition date type class
CommUtil Common used object class
ShiftCause Recorder class of switch cause
AppraiseLog Tracker class of switch process
Log Log class
B. Software Function Design
Figure 2 The system function
Figure 3 Machine units setting
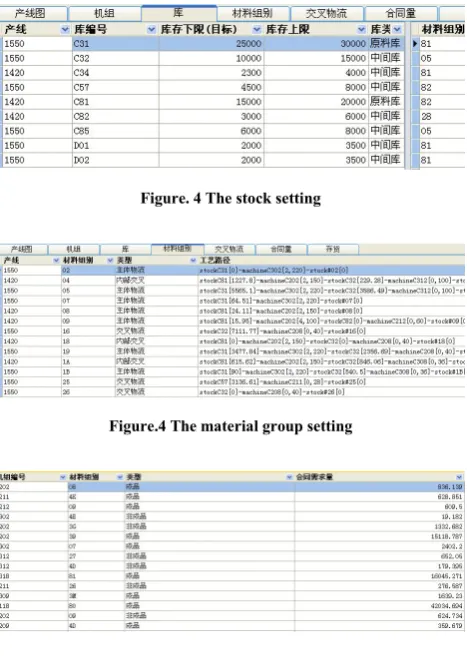
[image:4.595.188.422.244.573.2]Figure 3- Figure 5 illustrate how to set parameters according to specific production line, including machine units setting, stock setting, material group setting and requirement quantity setting.
Figure. 4 The stock setting
Figure.4 The material group setting
Figure.5 The requirement quantity setting
C. Application Effect
The running effect of the prediction system developed in the paper can be illustrated as shown in Fig.6 -Fig.7
______________________________________________________________________________
Figure.6 Inventory prediction
Figure.7 Machine unit prediction
CONCLUSION
As one of the new hot points discussed in the modern chemical industry information management, the real-time prediction of production logistics is concerned in the paper. Through study the process flow on the production line, the logistics prediction model is setup, which aims at not only decreasing the cost of process switching and material warehouse but also meeting with machine requirements and content limits. With the model embedded, the application software system is designed and realized. By real-time monitoring and predicting, the condition of raw material, work in process and finished product can be illustrated on the interface and this can well help to improve operation efficiency and economic benefits.
In the paper, the solving algorithm adopted in the paper is a kind of general algorithm. In the next work, new solving procedure will be designed and algorithm will be realization with considering the specific characteristics of problem.
REFERENCES
[1] Hua Lanrong. Digitalization. promote production logistics automation.Modern Manufacture.2008, (31).
[2]Zhao Jun.Digital technology and application. 2013, (8).
[3]Liu Zhi, Tang Juan, Fei Zhimin.Computer Integrated Manufacturing Systems,2012, (11)..