Journal of Chemical and Pharmaceutical Research, 2017, 9(11):39-45
Research Article
CODEN(USA) : JCPRC5
ISSN : 0975-7384
39
Development of Validated High Performance Thin Layer Chromatography
Method for Simultaneous Determination of Apigenin and Luteolin in
Achillea
Millefolium
Hiteksha Panchal
1*, Aeshna Amin
2, Mamta Shah
2and Vijay Bhatt
31Anand Pharmacy College, Anand, Gujarat, India 2
Department of Pharmacognosy, L.M. College of Pharmacy, Ahmedabad, Gujarat, India 3Herbal Research & Development Institute, Mandal, Gopeshwar, Chammoli, Uttarakhand _____________________________________________________________________________
ABSTRACT
A simple, rapid and precise high-performance thin-layer chromatographic method was developed for quantitative simultaneous estimation of Apigenin and Luteolin in aerial part of Achillea millefolium, family Asteraceae. Separation was performed on silica gel 60 F254 HPTLC plates using toluene: ethyl acetate: formic acid (6:4:0.3 v/v/v) as mobile phase for elution of marker from extract. The determination was carried out using densitometric absorbance-reflection mode at 254 nm for Apigenin and Luteloin. The method was validated in terms of linearity, accuracy, precision and specificity. The calibration curve was found to be linear between 200-1200 ng/spot for apigenin and 500-3000 ng/spot for luteolin. For apigenin, the limit of detection was found to be 71.06 ng/spot while the limit of quantitation was 230.33 ng/spot respectively and for luteolin, the limit of detection was found to be 74.05 ng/spot while the limit of quantitation was 243.72 ng/spot respectively This developed validated method is capable of quantifying and resolving apigenin and luteolin in its plant raw-material.
Keywords: HPTLC; Apigenin; Luteolin; Achillea millefolium
_____________________________________________________________________________
INTRODUCTION
In recent years focus on use of non-traditional approaches to treat diseases has been revived worldwide. The evidence collected till now shows immense potential of medicinal plants used in traditional systems. There is a tremendous increase in the usage of medicinal plants. Standardization of plant products using chromatography and spectroscopy methods was introduced by the WHO as a part of quality control [1-3]. Active marker present in the plant may vary substantially, depending on geographic origin, climate, soil, harvest season, processing techniques, and other factors [4-6]. It is a fact that sufficient bioactive phytochemical content is crucial for therapeutic effect. Quality control of herbal medicines is, therefore, highly desired to ensure their authenticity, stability, and consistency. HPTLC is widely used analytical technique because of its advantages of low operating cost, high sample throughput, simplicity, and speed, the need for minimum sample clean up, reproducibility, accuracy, reliability, and robustness [7-10].
40
inositol, dulcitol, mannitol, betaine, choline, trigonelline, betonicine and stachydrine. Flavonoids, viz. luteolin-7-D-glucoside, apigenin, luteolin, cosmosin and luteolin-7-O-β-D-glucopyranoside and sesquiterpenic lactone, austricin. The presence of folic acid, rutin and ascorbic acid in abundance has been reported in leaves [11,12]. Thorough literature review, concluded that there is no report on simultaneous thin layer chromatographic method for quantitative analysis of apigenin and luteolin in crude extracts of A. millefolium. On the basis of which we have developed an HPTLC method for simultaneous quantitative estimation of apigenin and luteolin. The developed method was validated in terms of system suitability, specificity, linearity, LOD, LOQ according to ICH guidelines [13].
EXPERIMENTAL SECTION
Equipment
A Camag Linomat V sample applicator was used the plates were saturated in a twin trough chamber; slit dimension settings of length 4 and width 0.3 mm, monochromator band width 20 nm and scanning rate of 20 mm/s. Zones were quantified by using Camag TLC Scanner III densitometer controlled by Win CATS version 1.4.3.6336 x software in the absorption mode using a deuterium source and a filter with wavelength of 366 nm.
Preparation of Standard Solution
The standard stock solution of 1000 µg/ml was prepared for apigenin and luteolin using methanol, kept in the refrigerator and tightly closed. The calibration curve was constructed according to the requirements of the International Conference of Harmonization (ICH) guidelines.
Chromatographic Conditions
Stationary phase: Precoated silica gel 60 F 254 HPTLC aluminium plates (10 10 cm, 0.2 mm thick) Mobile Phase: Toluene: Ethyl acetate: Formic acid (6:4:0.3 v/v/v)
Saturation time: 15 minutes Wavelength: 254 nm Lamp: Deuterium
The HPTLC analysis was performed in an air conditioned room maintained at 22°C and 55% humidity using precoated silica gel 60 F 254 aluminium backed plates (10 10 cm, 0.2 mm layer thickness, 5-6 µm particle size; Merck, Darmstadt, Germany). 5 microliters of the standard solutions were spotted using a linomat 5 autosampler fitted with a 100 µm Hamilton syringe (CAMAG, Muttenz, Switzerland) and operated with settings of a band length 6 mm; distance between bands, 11.7 mm; distance from the plate edge, 12 mm; and distance from the bottom of the plate, 8 mm. The plates were developed to a distance of 85 mm using Toluene: Ethyl acetate: Formic acid (6:4:0.3v/v/v) mobile phase in a CAMAG twin trough chamber presaturated with mobile phase. The developed plates were air dried and scanned with a CAMAG scanner 3 equipped with winCATS planar chromatography manager (Version 1.4.3.6336) software that was used for densitometry measurements, spectra recording and data processing. The absorption/ remission measurement mode was used at a scan speed of 20 mm/s. Densitogram was recorded at the wavelength of maximum absorption of apigenin and luteolin.
Preparation of Ethyl Acetate Extract
Hydro alcoholic extract of Achillea millefolium was dissolved by 2N HCl: toluene (1:1 v/v) and then reflux for three hours in reflux assembly it is than neutralized with 5-10% Na2CO3and refluxed for half hour. Allow the layers to separate. Collect aqueous layer and extract with ethyl acetate. Take ethyl acetate solution and evaporate it.
HPTLC Analysis of Plant Extract
Samples of ethyl acetate extract of aerial part of A. millefolium were used for HPTLC analysis. The plates after development were dried in air, scanned at 254 nm followed by UV spectra of the bands. The plate was also photographed at 254 nm and after derivatized by spraying with Boric acid: Oxalic acid (3:10) reagent using CAMAG Reprostar instrument (Figure 1) [14]. The amount of apigenin and luteolin in plant extract was quantified using calibration curve.
Validation of the Method
41
Linearity
Linear relationship between peak area and concentration of markers was evaluated over the concentration range expressed in ng/band by making five replicate measurements in the concentrations range of 200-1200 ng/band of apigenin and for luteolin (500 to 3000 ng/spot). Calibration plots were constructed by plotting the area of the peak of band versus the concentration of the markers and were further treated using the method of ordinary linear regression analysis.
Precision
The precision of the developed method was evaluated by performing day and Inter-day precision studies. Intra-day precision was carried out on same Intra-day and the inter-Intra-day precision study was performed on three different Intra-days by applying of three different concentrations (400, 600, and 800 ng/band) of Apigenin and (500, 1000, and 1500 ng/band) of Luteolin in triplicates. The peak area were measured and expressed in terms of percent relative standard deviation (% RSD).
Limit of Detection (LOD) and Limit of Quantitation (LOQ)
As per ICH guideline, limit of detection and quantitation of the developed method were calculated from the standard deviation of the response (σ) and slope of the calibration curve (S) of each drug using the formula; Limit of detection=3.3*σ/S and Limit of quantitation=10*σ/S.
Specificity
The specificity of the method was ascertained by comparing the spectra of plant extract with standards. The peak for apigenin and lutolin in plant extract was confirmed by comparing the Rf and overlaying peak purity spectra with that of standards. The peak purity of markers was assessed by comparing the spectra at three different levels, i.e., peak start (S), peak apex (M) and peak end (E) positions of the band.
RESULTS AND DISCUSSION
[image:3.612.230.379.467.666.2]Different proportions of Toluene, Ethyl acetate and Formic acidwere tried as the mobile phase on silica gel HPTLC plates and a ratio of (6:4:0.3 v/v/v) gave good resolution. Well resolved symmetric band for apigenin and luteolin in extract was obtained under the optimized conditions using precoated HPTLC plates with 0.2 mm thickness, 5-6 mm particle size and the mobile phase Toluene: Ethyl acetate: Formic acid(6:4:0.3v/v/v). Apigenin and luteolin on derivatization with Boric acid(3%) and Oxalic acid (10%) gave yellow fluorescence (Figures 1 and 2). Standard apigenin (Rf0.52) and luteolin (Rf0.44) showed single peak in HPTLC chromatogram (Figures 3 and 4). Calibration curve was prepared by plotting concentration of standardvs area of the peak.
42
Figure 2: UV mode at 366 nm standard Luteolin, A. mille E.A. extract- Achillea millefolium ethyl acetate extract and standard apigenin
[image:4.612.135.477.330.560.2]43
Figure 4: Chromatogram of standard luteolin
Determination of Marker in Extract
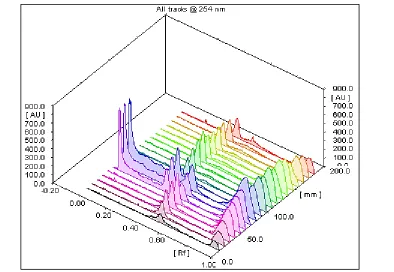
The ethyl acetate extract of aerial part of A. millefolium was found to contain apigenin and luteolin. Furthermore, ethyl acetate extract has shown peak in the chromatogram at same Rf value as apigenin (0.52) standard and luteolin (0.44) (Figures 5 and 6).
[image:5.612.123.491.388.639.2]44
Figure 6: 3D Chromatogram of Achillea millefolium extract
Linearity
[image:6.612.178.438.421.642.2]Apigenin and luteolin showed good correlation coefficient thus exhibiting good linearity between concentration and peak area (Table 1).
Table 1: Method validation parameters for estimation of apigenin and luteolin
Parameters Apigenin Luteolin
Wavelength, nm 254 254
Linearity range, ng/spot 200-1200 500-3000 Regression equation y=11.433x + 4067.4 y = 4.1506x + 2885
Correlation coefficient 0.9933 0.9937
Limit of detection, ng/spot 71.06 74.05
Limit of quantification, ng/spot 230.33 243.72
Specificity Specific Specific
Table 2: Intermediate precision studies of apigenin
Conc. ng/spot Intraday (n=3) CV Inter day (n=3) CV 400 9012.2 ± 11.086 0.69 9085.6 ± 23.67 0.15 600 11210.5 ± 17.351 0.48 11183.8 ± 21.89 0.06 800 13143.5 ± 43.315 0.08 13149.6 ± 45.82 0.08
Table 3: Intermediate precision studies of luteolin
Conc. ng/spot Intraday (n=3) CV Inter day (n=3) CV 500 4569.3 ± 12.504 1.6 4580.23 ± 14.63 1.91 1000 7656.567 ± 7.864 0.63 7612.49 ± 10.9 0.8 1500 9817.267 ± 10.286 0.59 9856.76 ± 11.8 0.64
Precision
45
Accuracy
Markers after spiking with standard afforded recovery of apigenin in the range of 99.15% - 101.53% and luteolin in the range of 99.5% - 99.92% at three concentration levels.
Limit of Detection and Limit of Quantification
For apigenin, the limit of detection was found to be 71.06 ng/spot while the limit of quantitation was found to be 230.33 ng/spot and for luteolin, the limit of detection was found to be 74.05 ng/spot while the limit of quantitation was found to be 243.72 ng/spot.
Specificity
Specificity of the method was ascertained by comparing retardation factor of markers in chromatogram obtained from prepared extract and standard drug. The retardation factor of the standard drugs and prepared extract was found to be same in the plant extracts, so the method was found to be specific. Moreover there was no interference from other active ingredients at the peaks observed for apigenin and luteolin from the prepared extract and also the base line did not show any significant noise (Figures 3-5).
CONCLUSION
The proposed HPTLC method was found to be rapid, simple and accurate for quantitative estimation of apigenin and luteolin in routine quality control of the raw material. The recovery value of apigenin and luteolin was found to be 99.15% - 101.53% and 99.5% - 99.92% which shows the reliability and suitability of the method.
REFERENCES
[1] NR Farnsworth; O Akerele; AS Bingel; DD Soejarto; ZG Guo. Bulletin WHO.1985, 63, 965-981.
[2] WHO/PHARM/92.559, Quality Control Methods for Medicinal Plant Material, WHO/PHARM, Geneva,
1992.
[3] JG Brun. Acta Pharm Nord. 1989, 1, 117. [4] AR Bilia. Fitoterapia73. 2002, 276-279. [5] PJ Houghton. Drug Info J. 1998, 32, 401-469.
[6] DM Marcus; AP Grollman. Engl J Med. 2002, 347, 2073-2076.
[7] P Xie; S Chen; Y Liang; X Wang; R Tian; R Upton. J Chromatogr. 2006, A1112 171-180.
[8] K Dhalwal; VM Shinde; KR Mahadik; AG Namdeo. J Sep Sci. 2007, 30, 2053-2058.
[9] B Milind; H Srinivasa; H Padh; M Rajani. J Sep Sci. 2005, 28, 581-584.
[10] MN Ravishankara; N Srivastava; H Padh; M Rajani. Planta Medica. 2001, 294-296.
[11] The Wealth of India, A Dictionary of Indian Raw Materials and Industrial Products, Council of Scientific and Industrial Research, New Delhi, 54-55, 1962.
[12] KR Kirtikar, BD Basu. Indian Medicinal Plants, Periodicals Experts, Bombay, 1999, 2(3), 2350-2351. [13] International Conference on Harmonization, Validation of Analytical Procedures: Text and Methodology
ICH-Q2 (R1), Geneva, Switzerland, 2005.