Research Article
Methyl Esters Selectivity of Transesterification Reaction with
Homogenous Alkaline Catalyst to Produce Biodiesel in Batch,
Plug Flow, and Continuous Stirred Tank Reactors
N. F. Nasir,
1,2W. R. W. Daud,
1S. K. Kamarudin,
1and Z. Yaakob
1 1Department of Chemical and Process Engineering, Faculty of Engineering and Built Environment,Universiti Kebangsaan Malaysia (UKM), 43600 Bangi, Selangor, Malaysia
2Department of Plant and Automotive Engineering, Faculty of Mechanical and Manufacturing Engineering,
Universiti Tun Hussein Onn Malaysia, Batu Pahat, 86400 Parit Raja, Johor, Malaysia
Correspondence should be addressed to N. F. Nasir; [email protected]
Received 28 March 2014; Revised 24 July 2014; Accepted 7 August 2014; Published 25 August 2014
Academic Editor: Janez Levec
Copyright © 2014 N. F. Nasir et al. This is an open access article distributed under the Creative Commons Attribution License, which permits unrestricted use, distribution, and reproduction in any medium, provided the original work is properly cited.
Selectivity concept is essential in establishing the best operating conditions for attaining maximum production of the desired product. For complex reaction such as biodiesel fuel synthesis, kinetic studies of transesterification reaction have revealed the mechanism of the reaction and rate constants. The objectives of this research are to develop the kinetic parameters for determination of methyl esters and glycerol selectivity, evaluate the significance of the reverse reaction in transesterification reaction, and examine the influence of reaction characteristics (reaction temperature, methanol to oil molar ratio, and the amount of catalyst) on selectivity. For this study, published reaction rate constants of transesterification reaction were used to develop mathematical expressions for selectivities. In order to examine the base case and reversible transesterification, two calculation schemes (Case 1 and Case 2) were established. An enhanced selectivity was found in the base case of transesterification reaction. The selectivity was greatly improved at optimum reaction temperature (60∘C), molar ratio (9 : 1), catalyst concentration (1.5 wt.%), and low free fatty acid feedstock. Further research might explore the application of selectivity for specifying reactor configurations.
1. Introduction
Biodiesel, a major renewable fuel to replace fossil fuel, is clean, environmental friendly, and derived from readily available sources such as vegetable oils and animal fats. In the biodiesel production, transesterification reaction is used to convert triglycerides to esters. It can be defined as alcoholysis of oil and fat with an alcohol to form esters and glycerol [1]. Various types of catalysts such as acidic and basic catalysts, which are either homogeneous or heterogeneous, as well as enzymes, can catalyse the reaction.
Transesterification of the oil often represented by triglyc-erides, T, with methanol, A, in the presence of a catalyst, usually alkaline, yields esters of fatty acids, E, and glycerol, G.
Monoglyceride, M, and diglyceride, D, are the intermediates. The overall reaction is written typically as
T+ 3A⇐⇒ 3catalyst E+G (1)
However, (1) is misleading because the rates of the for-ward reactions are not equal. The transesterification reaction is known to occur in three stages, where D produced from methanolysis in the first stage reaction becomes the reactant for the second stage methanolysis and the M produced from the second stage reaction becomes the reactant for the third stage reaction. The third stage reaction produces G as a byproduct. All three reactions produce different types of
methyl esters, collectively designated by E. The reactions are shown in (2) to (4), where𝑘+1–𝑘−3are rate constants:
T+A⇐⇒𝑘+1
𝑘−1
E1 +D (2)
D+A⇐⇒𝑘+2
𝑘−2
E2 +M (3)
M+A⇐⇒𝑘+3
𝑘−3
E3 +G (4)
A stoichiometric balance of the above three reversible reactions yield the correct form of the overall reaction, which is given below:
T+ (1 + (𝑟+2− 𝑟−2)
(𝑟+1− 𝑟−1)+
(𝑟+3− 𝑟−3)
(𝑟+1− 𝑟−1))A
catalyst
→E1+(𝑟+2− 𝑟−2)
(𝑟+1− 𝑟−1)E2+
(𝑟+3− 𝑟−3)
(𝑟+1− 𝑟−1)E3
+ ((𝑟+3− 𝑟−3)
(𝑟+1− 𝑟−1))G,
(5)
where𝑟+1 is the rate of the forward reaction in reaction 1, 𝑟−1 is the rate of the backward reaction in reaction 1, 𝑟+2 is the rate of the forward reaction in reaction 2,𝑟−2 is the rate of the backward reaction in reaction 2,𝑟+3 is the rate of the forward reaction in reaction 3, and𝑟−3 is the rate of the backward reaction in reaction 3. Equation (5) reduces to (1) if and only if all the net rates of reactions are equal or
(𝑟+1− 𝑟−1) = (𝑟+2− 𝑟−2) = (𝑟+3− 𝑟−3).
Kinetic studies of the chemical reactions in biodiesel production provide parameters that are used to predict the extent of the reactions at any time under any condition. Published kinetic data of biodiesel production are mostly dependent on the type of oil feed stock and the type of catalyst used as well as on the reaction conditions such as reaction temperature and catalyst concentration [2–4]. Previous evidence suggests that an important factor in the transesterification process is the degree of mixing between the alcohol, A, and the triglyceride, T, phases. As T and A phases are not miscible and they form two liquid layers upon their initial introduction into the reactor, mechanical mixing is typically applied to increase the contact between the reactants, resulting in an increase in mass transfer rate [5].
Many works have studied the kinetics of the transester-ification reaction mechanism and determined its reaction rate constants [2–11]. Leevijit et al. [3] who conducted batch transesterification reaction and evaluated the reaction rate constants𝑘+1–𝑘−3found that the forward reactions are faster than the reverse reactions. The rate constants are presented as dataset 10 in Table 1. Similar kinetic study of palm oil methanolysis was conducted by Narv`aez et al. [9] in order to investigate the effects of temperatures and concentration of NaOH catalyst. His results also suggest that the reaction kinetics for the forward reactions dominate over the reverse. From the result of their study on overall reaction of transes-terification, the energy of activation for the forward reaction
(16.4 kcal gmol−1) is greater than the energy of activation for the reverse reaction (13.6 kcal gmol−1).
A kinetic study on the transesterification of Jatropha curcasoil by Jain and Sharma [4] using a two-step acid-base catalyst process in a batch system found that the esterification reaction was slower than the transesterification reaction because the process was assisted by the esterification reaction. Apart from that, recent studies reported the kinetics of transesterification reaction in the absence of a catalyst using soybean oil, palm oil, and rapeseeds oil [6–8, 10]. The rate constants, conversion, and yield of E showed an increasing trend with the reaction temperature, but the E content in the reaction product decreased as the reaction temperature was increased.
Reactor design uses information, knowledge, and expe-rience from a variety of areas such as thermodynamics, chemical kinetics, fluid mechanics, heat transfer, mass trans-fer, and economics [12]. A considerable research has been devoted into the determination of the reaction rate constants of transesterification reactions of various types of edible and inedible vegetable oils. The published reaction rate constants at various conditions can be further used to determine the selectivity of E and G, providing opportunities for specifying reactor configurations using process system engineering tools such as the attainable region method. Selectivity can be described in a number of different ways, such as the pro-duction of the desirable component divided by the amount of limiting reactant converted or the production of desired component divided by the production of the undesired component [13]. The objectives of this present work are to develop the kinetic models of transesterification reaction and determine the selectivity of E and G using published reaction kinetic constants of the transesterification reactions and to investigate the effect of reaction conditions on them. In addition, this paper evaluates the significance of the reverse reactions in transesterification reaction on the E and G selectivities.
2. Methodology
developing the kinetic model of alkali-catalyzed transes-terification reaction [21]. However, the kinetics parameter for alkali-catalyzed transesterification in the present work is developed by assuming that triglycerides were pretreated earlier. Also, this work represents a preliminary design of reactors for a biodiesel plant. Therefore, some important issues such as the existence of competing reaction along with the transesterification such as saponification reaction and the presence of water in the oil, the transport process, heterogeneity of the reaction, and loss of polarity of an alkaline catalyst were not considered.
The kinetic model was developed by first performing stoichiometric mole balance of each species in a plug flow reactor (PFR) using the reaction kinetics in (2) to (4). However, since a simpler mole balance of each species in a batch reactor produces the same solution as inSection 3, the batch reactor balance is used instead.
Mole balance of T is as follows:
−𝑑𝐶T
𝑑𝑡 = 𝑘+1𝐶T𝐶A− 𝑘−1𝐶D𝐶E1. (6)
Mole balance of D is as follows:
−𝑑𝐶D
𝑑𝑡
= − (𝑘+1𝐶T𝐶A− 𝑘−1𝐶D𝐶E1− 𝑘+2𝐶D𝐶A+ 𝑘−2𝐶M𝐶E2) .
(7)
Mole balance of M is as follows:
−𝑑𝐶M
𝑑𝑡
= − (𝑘+2𝐶D𝐶A− 𝑘−2𝐶M𝐶E2− 𝑘+3𝐶M𝐶A+ 𝑘−3𝐶G𝐶E3) .
(8)
Mole balance of E1 is as follows:
−𝑑𝐶E1
𝑑𝑡 = − (𝑘+1𝐶T𝐶A− 𝑘−1𝐶D𝐶E1) . (9)
Mole balance of E2 is as follows:
−𝑑𝐶E2
𝑑𝑡 = − (𝑘+2𝐶D𝐶A− 𝑘−2𝐶M𝐶E2) . (10)
Mole balance of E3 is as follows:
−𝑑𝐶E3
𝑑𝑡 = − (𝑘+3𝐶M𝐶A− 𝑘−3𝐶G𝐶E3) . (11)
Mole balance of A (methanol) is as follows:
−𝑑𝐶A
𝑑𝑡 = 𝑘+1𝐶T𝐶A− 𝑘−1𝐶D𝐶E1+ 𝑘+2𝐶D𝐶A
− 𝑘−2𝐶M𝐶E2+ 𝑘+3𝐶M𝐶A− 𝑘−3𝐶G𝐶E3.
(12)
Mole balance of G is as follows:
−𝑑𝐶G
𝑑𝑡 = − (𝑘+3𝐶M𝐶A− 𝑘−3𝐶G𝐶E3) . (13)
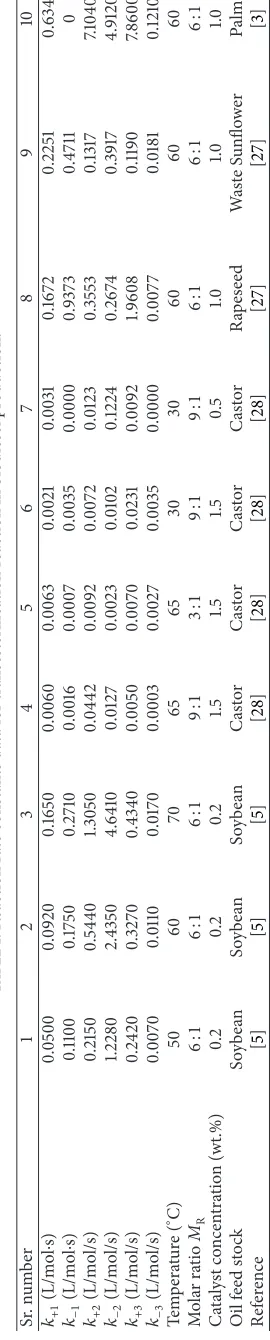
Published reaction rate constants(𝑘+1–𝑘𝑥−3)are listed in Table 1. In this work, methanol is assumed in excess while triglyceride is the limiting reactant.
Closed form simultaneous solution of ordinary differen-tial equations (6) to (13) by analysis is possible if only the forward reactions are considered significant but the backward reactions are neglected. On the other hand, if both forward and reverse reactions are equally significant, closed form solution for (6) to (13) cannot be found and they have to be solved numerically using a 4th order Runge-Kutta algorithm, which is available in MATLAB. The solution generates the molar concentrations of all species,𝐶𝑖, as functions of the design variables, that is, the conversion of the limiting reactant,𝑋T, and the molar ratio of the excess variable,𝑀𝑅.
Conversion is defined as
conversion= loss of reactant
feed of reactant. (14)
For reactant T, the conversion is
𝑋T=
𝑁T0− 𝑁T
𝑁T0
= 1 −𝑁T0/𝑉
𝑁T0/𝑉
= 1 − 𝐶T
𝐶T0
. (15)
Selectivity is defined as the ratio of the desired product to the amount of limiting reactant that has undergone chemical change [22]. That is,
Selectivity
= amount of desired product
amount of limiting reactant that has undergone chemical change.
(16)
In this study, the total methyl ester is defined as
Total methyl ester=methyl ester1 +methyl ester2
+methyl ester3. (17)
The selectivity of the total methyl ester,𝑆E, and of glycerol, 𝑆G, defined as the moles of total methyl ester or glycerol
produced, respectively, per moles of the limiting reactant T that have reacted is then formulated as functions of the conversion of triglyceride,𝑋T, as shown in
𝑆E=
𝐶E1+ 𝐶E2+ 𝐶E3
𝐶T𝑜𝑋T
,
𝑆G =
𝐶G
𝐶T𝑜𝑋T
.
(18)
2.2. Selectivity of Methyl Esters and Glycerol in Continuous Stirred Tank Reactor. The kinetic model for continuous stirred tank reactor (CSTR) is much simpler. The stoichio-metric mole balance of each species in a CSTR, using the reaction kinetics in (2) to (4), yields a set of nonlinear equations in (19) to (26).
Mole balance of T is as follows:
𝐶T𝑜− 𝐶T =
𝑉
𝐹T
(𝑘+1𝐶T𝐶A− 𝑘−1𝐶D𝐶E1)
= 𝜏 (𝑘+1𝐶T𝐶A− 𝑘−1𝐶D𝐶E1) .
Mole balance of D is as follows:
𝐶D𝑜− 𝐶D
= −𝜏 (𝑘+1𝐶T𝐶A− 𝑘−1𝐶D𝐶E1− 𝑘+2𝐶D𝐶A+ 𝑘−2𝐶M𝐶E2) .
(20)
Mole balance of M is as follows:
𝐶M𝑜− 𝐶M
= −𝜏 (𝑘+2𝐶D𝐶A− 𝑘−2𝐶M𝐶E2− 𝑘+3𝐶M𝐶A+ 𝑘−3𝐶G𝐶E3) .
(21)
Mole balance of E1 is as follows:
𝐶E1𝑜− 𝐶E1= −𝜏 (𝑘+1𝐶T𝐶A− 𝑘−1𝐶D𝐶E1) . (22)
Mole balance of E2 is as follows:
𝐶E2𝑜− 𝐶E2= −𝜏 (𝑘+2𝐶D𝐶A− 𝑘−2𝐶M𝐶E2) . (23)
Mole balance of E3 is as follows:
𝐶E3𝑜− 𝐶E3= −𝜏 (𝑘+3𝐶M𝐶A− 𝑘−3𝐶G𝐶E3) . (24)
Mole balance of A (methanol) is as follows:
𝐶A𝑜− 𝐶A
= 𝜏 (𝑘+1𝐶T𝐶A− 𝑘−1𝐶D𝐶E1+ 𝑘+2𝐶D𝐶A− 𝑘−2𝐶M𝐶E2
+𝑘+3𝐶M𝐶A− 𝑘−3𝐶G𝐶E3) .
(25)
Mole balance of G is as follows:
𝐶G𝑜− 𝐶G= −𝜏 (𝑘+3𝐶M𝐶A− 𝑘−3𝐶G𝐶E3) . (26)
Closed form simultaneous solution of nonlinear equa-tions (19) to (26) by analysis is not possible. They have to be solved numerically using a matrix inversion algorithm, which is available in MATLAB. The solution generates the molar concentrations of all species,𝐶𝑖, as functions of the design variables, that is, the conversion of the limiting reactant, and the molar ratio of the excess variable,𝐴.
3. Solution of the PFR and CSTR
3.1. Removal of Temporal Dependence. Equations (6) to (13) cannot be solved in their time dependent forms because of the single degree of freedom of the problem. In order to solve the equations simultaneously, the degree of freedom is reduced to zero by changing the independent variable from time to the conversion or concentration of the limiting reactant using the chain rule and the mole balance equation for T (6). Consider the following:
𝑑𝐶𝑖
𝑑𝐶T
= (𝑑𝐶𝑖
𝑑𝑡 ) (
𝑑𝑡
𝑑𝐶T
) . (27)
Hence, (7) to (13) can be rewritten with concentration of T as their independent variable as follows:
𝑑𝐶D
𝑑𝐶T
= − (1 −𝛼2𝐶D𝐶A− 𝛼3𝐶M𝐶E2
𝐶T𝐶A− 𝛼1𝐶D𝐶E1 ) ,
𝑑𝐶M
𝑑𝐶T
= − (𝛼2𝐶D𝐶A− 𝛼3𝐶M𝐶E2− 𝛼4𝐶M𝐶A+ 𝛼5𝐶G𝐶E3
𝐶T𝐶A− 𝛼1𝐶D𝐶E1
) ,
𝑑𝐶E1
𝑑𝐶T
= −1,
𝑑𝐶E2
𝑑𝐶T
= − (𝛼2𝐶D𝐶A− 𝛼3𝐶M𝐶E2
𝐶T𝐶A− 𝛼1𝐶D𝐶E1 ) ,
𝑑𝐶E3
𝑑𝐶T
= − (𝛼4𝐶M𝐶A− 𝛼5𝐶G𝐶E3
𝐶T𝐶A− 𝛼1𝐶D𝐶E1
) ,
𝑑𝐶A
𝑑𝐶T
= 1 + 𝛼2𝐶D𝐶A− 𝛼3𝐶M𝐶E2+ 𝛼4𝐶M𝐶A− 𝛼5𝐶G𝐶E3
𝐶T𝐶A− 𝛼1𝐶D𝐶E1
,
𝑑𝐶G
𝑑𝐶T
= − (𝛼4𝐶M𝐶A− 𝛼5𝐶G𝐶E3
𝐶T𝐶A− 𝛼1𝐶D𝐶E1 ) ,
(28)
where
𝛼1= 𝑘𝑘−1
+1, 𝛼2 =
𝑘+2
𝑘+1, 𝛼3=𝑘𝑘−2
+1,
𝛼4= 𝑘+3
𝑘+1, 𝛼5=
𝑘−3
𝑘+1.
(29)
Similarly, (28) cannot be solved in their time dependent forms because of the single degree of freedom of the problem. In order to solve the equations simultaneously, the degree of freedom is reduced to zero by changing the independent variable from time to the conversion or concentration of the limiting reactant using algebraic manipulation and the mole balance equation for T (19). Consider the following:
𝐶𝑖𝑜− 𝐶𝑖
𝐶T𝑜− 𝐶T
= − (𝐶𝑖𝑜− 𝐶𝑖
𝜏 ) (
𝜏
𝐶T𝑜− 𝐶T
) . (30)
Hence, (28) can be rewritten with concentration of T as their independent variable as follows:
𝐶D𝑜− 𝐶D
𝐶T𝑜− 𝐶T
= − (1 −𝛼2𝐶D𝐶A− 𝛼3𝐶M𝐶E2
𝐶T𝐶A− 𝛼1𝐶D𝐶E1 ) ,
𝐶M𝑜− 𝐶M
𝐶T𝑜− 𝐶T
= − (𝛼2𝐶D𝐶A− 𝛼3𝐶M𝐶E2− 𝛼4𝐶M𝐶A+ 𝛼5𝐶G𝐶E3
𝐶T𝐶A− 𝛼1𝐶D𝐶E1 ) ,
𝐶E1𝑜− 𝐶E1
𝐶T𝑜− 𝐶T
𝐶E2𝑜− 𝐶E2
𝐶T𝑜− 𝐶T
= − (𝛼2𝐶D𝐶A− 𝛼3𝐶M𝐶E2
𝐶T𝐶A− 𝛼1𝐶D𝐶E1
) ,
𝐶E3𝑜− 𝐶E3
𝐶T𝑜− 𝐶T
= − (𝛼4𝐶M𝐶A− 𝛼5𝐶G𝐶E3
𝐶T𝐶A− 𝛼1𝐶D𝐶E1 ) ,
𝐶A𝑜− 𝐶A
𝐶T𝑜− 𝐶T
= 1 +𝛼2𝐶D𝐶A− 𝛼3𝐶M𝐶E2+ 𝛼4𝐶M𝐶A− 𝛼5𝐶G𝐶E3
𝐶T𝐶A− 𝛼1𝐶D𝐶E1
,
𝐶G𝑜− 𝐶G
𝐶T𝑜− 𝐶T
= − (𝛼4𝐶M𝐶A− 𝛼5𝐶G𝐶E3
𝐶T𝐶A− 𝛼1𝐶D𝐶E1 ) . (31)
Two main cases are considered: the base case where the reactions (2) to (4) are irreversible and the alternative case where the reactions are reversible.
3.2. Case 1: Base Case: Irreversible Reactions. In Case 1, the base case is considered by assuming (2) to (4) to be irre-versible reactions. In other words, the forward reactions are so dominant that the reverse reaction can be neglected and the overall effect is that the reactions are irreversible. The results of the base case can then be compared with that of the alternative Case 2, where the reactions are all reversible, in order to verify the importance of the reverse reaction and its implication to the maximum attainable molar concentration of methyl ester. Since the reverse reactions are omitted, the value of𝛼1,𝛼3, and𝛼5 is zero. Hence, (28) for PFR can be rewritten as follows:
𝑑𝐶D
𝑑𝐶T
= − (1 −𝛼2𝐶D
𝐶T
) , (32)
𝑑𝐶M
𝑑𝐶T
= − (𝛼2𝐶D− 𝛼4𝐶M
𝐶T
) , (33)
𝑑𝐶E1
𝑑𝐶T
= −1, (34)
𝑑𝐶E2
𝑑𝐶T
= −𝛼2𝐶D
𝐶T
, (35)
𝑑𝐶E3
𝑑𝐶T
= −𝛼4𝐶M
𝐶T
, (36)
𝑑𝐶A
𝑑𝐶T
= 1 + 𝛼2𝐶D+ 𝛼4𝐶M
𝐶T
, (37)
𝑑𝐶G
𝑑𝐶T
= −𝛼4𝐶M
𝐶T
. (38)
The solution of the set of ordinary differential equations (32) can be found analytically by using the integrating factor method [23]. The concentrations of all the species generated
by the solution are then expressed in terms of the triglycerides conversion,𝑋T, as shown in
𝐶T = 𝐶T𝑜(1 − 𝑋T) ,
𝐶D=
𝐶T𝑜
𝛼2− 1[(
𝐶T
𝐶T𝑜) − (
𝐶T
𝐶T𝑜)
𝛼2
]
= 𝐶T𝑜
𝛼2− 1[(1 − 𝑋T) − (1 − 𝑋T)𝛼2] ,
𝐶M= 𝐶T𝑜[1 − 𝛼𝛼2
2[
(1 − 𝑋T)
1 − 𝛼4 −
(1 − 𝑋T)𝛼2
𝛼2− 𝛼4 ]
+ 𝛼2(1 − 𝑋T)𝛼4
(1 − 𝛼4) (𝛼2− 𝛼4)] ,
𝐶E1= 𝐶T𝑜(1 − (𝐶𝐶T
T𝑜)) = 𝐶T𝑜(1 − (1 − 𝑋T)) = 𝐶T𝑜𝑋T,
𝐶E2= 𝐶T𝑜{1 − 𝛼𝛼2
2− 1[(1 − 𝑋T) −
(1 − 𝑋T)𝛼2
𝛼2 ]} ,
𝐶E3= 𝛼4𝐶T𝑜[1 − 𝛼𝛼2
2[
𝑋T
1 − 𝛼4 −
[ 1 − (1 − 𝑋T)𝛼2]
(𝛼2− 𝛼4) 𝛼2 ]
+𝛼2[ 1 − (1 − 𝑋T)
𝛼4]
(1 − 𝛼4) (𝛼2− 𝛼4) 𝛼4] ,
𝐶A= 𝐶T𝑜{𝑀𝑅+(1 − 𝛼𝛼2
2)
× [((1 − 𝛼𝛼 2)
2 +
2𝛼4− 1
(1 − 𝛼4)) 𝑋T
− ( 2𝛼4− 𝛼2
𝛼2(𝛼2− 𝛼4)) [ 1 − (1 − 𝑋T)
𝛼2]
− (1 − 𝛼2)
(1 − 𝛼4) (𝛼2− 𝛼4)
× [ 1 − (1 − 𝑋T)𝛼4] ]} ,
𝐶G= 𝛼4𝐶T𝑜[1 − 𝛼𝛼2
2[
𝑋T
1 − 𝛼4 −
[ 1 − (1 − 𝑋T)𝛼2]
(𝛼2− 𝛼4) 𝛼2 ]
+𝛼2[ 1 − (1 − 𝑋T)
𝛼4]
(1 − 𝛼4) (𝛼2− 𝛼4) 𝛼4] .
(39)
For the CSTR, (31) can be manipulated algebraically and rewritten with conversion of T as their independent variable as follows:
𝐶D=
𝐶T𝑜𝑋T(1 − 𝑋T)
(1 − (1 − 𝛼2) 𝑋T)
𝐶M=
𝛼2𝐶T𝑜𝑋2T(1 − 𝑋T)
(1 − (1 − 𝛼4) 𝑋T) (1 − (1 − 𝛼2) 𝑋T)
, (41)
𝐶E1= 𝐶T𝑜𝑋T, (42)
𝐶E2= 𝛼2𝐶T𝑜𝑋
2
T
(1 − (1 − 𝛼2) 𝑋T)
, (43)
𝐶E3= 𝛼2𝛼4𝐶T𝑜𝑋
3
T
(1 − (1 − 𝛼4) 𝑋T) (1 − (1 − 𝛼2) 𝑋T)
, (44)
𝐶A= 𝐶T𝑜(𝑀𝑅− 1 +
𝛼2𝐶T𝑜𝑋2T
(1 − (1 − 𝛼2) 𝑋T)
+ 𝛼2𝛼4𝐶T𝑜𝑋3T
(1 − (1 − 𝛼4) 𝑋T) (1 − (1 − 𝛼2) 𝑋T)
) , (45)
𝐶G=
𝛼2𝛼4𝐶T𝑜𝑋3T
(1 − (1 − 𝛼4) 𝑋T) (1 − (1 − 𝛼2) 𝑋T)
. (46)
3.3. Case 2: Alternative Case: Reversible Reactions. In Case 2, an alternative case was considered by assuming that the reactions in (2) to (4) are reversible. Together with the base case, where the reactions are irreversible, it can be used to discover the significance of the reverse and forward reactions. Since the values of all 𝛼𝑖’s in (28) for the PFR and (31) for the CSTR are not zero, no closed form solution to them can be found because they are too complex for analytical solution. The solution of both sets of equations can be achieved by numerical methods using a computer simulation software. Equations (28) for the PFR are solved by using the ordinary differential equation 45, (ODE 45) in MATLAB. Concentration of each species is obtained using Rungge-Kutta numerical integration algorithm. On the other hand, (31) for the CSTR are solved by using the simultaneous nonlinear equations solver in MATLAB. Concentration of each species is obtained using the multivariable Newton-Raphson algorithm.
3.4. Selectivity of Methyl Esters and Glycerol for Case 1 and Case 2. The net concentration of methyl esters is the sum of concentration of ester 1, ester 2, and ester 3. In Case 1, the net concentration of methyl esters in the PFR is given by
𝐶E1+ 𝐶E2+ 𝐶E3
= 𝐶T𝑜{1 + 𝑋T−
𝛼2
𝛼2− 1[(1 − 𝑋T) −
(1 − 𝑋T)𝛼2
𝛼2 ]
+𝛼4[ 𝛼2
1 − 𝛼2[
𝑋T
1 − 𝛼4 −
[ 1 − (1 − 𝑋T)
𝛼2]
(𝛼2− 𝛼4) 𝛼2 ]
+𝛼2[ 1 − (1 − 𝑋T)
𝛼4]
(1 − 𝛼4) (𝛼2− 𝛼4) 𝛼4]} .
(47)
Similarly, the net concentration of methyl esters in the CSTR for Case 1 is given by
𝐶E1+ 𝐶E2+ 𝐶E3
= 𝐶E1𝑜+ 𝐶E2𝑜+ 𝐶E3𝑜
+ [𝐶T𝑜𝑋T+
𝛼2𝐶T𝑜𝑋2T
(1 − (1 − 𝛼2) 𝑋T)
+ 𝛼2𝛼4𝐶T𝑜𝑋3T
(1 − (1 − 𝛼4) 𝑋T) (1 − (1 − 𝛼2) 𝑋T)
] . (48)
The selectivity of methyl esters in Case 1 for PFR is given by
𝑆E= {
𝑋T+ 1
𝑋T
− 𝛼2
𝛼2− 1[
(1 − 𝑋T)
𝑋T
−(1 − 𝑋T)
𝛼2
𝛼2𝑋T
]
+𝛼4[ 𝛼2
1 − 𝛼2 [
1
1 − 𝛼4 −
[ 1 − (1 − 𝑋T)
𝛼2]
(𝛼2− 𝛼4) 𝛼2𝑋T
]
+ 𝛼2[ 1 − (1 − 𝑋T)
𝛼4]
(1 − 𝛼4) (𝛼2− 𝛼4) 𝛼4𝑋T
]} .
(49)
The selectivity of glycerol in Case 1 for PFR is given by
𝑆G =
𝛼4
𝑋T
[ 𝛼2
1 − 𝛼2[
𝑋T
1 − 𝛼4 −
[ 1 − (1 − 𝑋T)𝛼2]
(𝛼2− 𝛼4) 𝛼2 ]
+𝛼2[ 1 − (1 − 𝑋T)
𝛼4]
(1 − 𝛼4) (𝛼2− 𝛼4) 𝛼4] .
(50)
On the other hand, the selectivity of methyl esters in Case 1 for CSTR is given by
𝑆E= [1 +
𝛼2𝑋T
(1 − (1 − 𝛼2) 𝑋T)
+ 𝛼2𝛼4𝑋2T
(1 − (1 − 𝛼4) 𝑋T) (1 − (1 − 𝛼2) 𝑋T)
] .
(51)
The selectivity of glycerol in Case 1 for CSTR is given by
𝑆G=
𝛼2𝛼4𝑋2
T
(1 − (1 − 𝛼4) 𝑋T) (1 − (1 − 𝛼2) 𝑋T)
. (52)
For Case 2, there is no closed form expression for selec-tivity of methyl esters and glycerol. The selectivities of methyl esters and glycerol have to be calculated using (18) from the concentration of the species generated by the numerical solution.
4. Results and Discussion
0 0.5 1 1.5 2 2.5 3 3.5
0 0.2 0.4 0.6 0.8 1
Se
le
ct
iv
it
y
Conversion of triglycerideXT
Case1-T = 60∘CMR= 6: 1catalyst =0.2wt%
[image:8.600.58.286.69.249.2]Case2-T = 60∘CMR= 6: 1catalyst =0.2wt%
Figure 1: Selectivity plots of Cases 1 and 2 at reaction temperature 60∘C, molar ratio 6 : 1, and catalyst concentration 0.2 wt.%.
0 0.5 1 1.5 2 2.5 3 3.5
0 0.2 0.4 0.6 0.8 1
S
elec
ti
vi
ty
Conversion of triglycerideXT
Case1-T = 70∘CMR= 6: 1catalyst =0.2wt%
Case2-T = 70∘CMR= 6: 1catalyst =0.2wt%
Figure 2: Selectivity plots of Cases 1 and 2 at reaction temperature 70∘C, molar ratio 6 : 1, and catalyst concentration 0.2 wt.%.
transesterification reaction; it has also established several mathematical equations for the same. Furthermore, a par-ticularly important parameter for designing a reactor, that is, product selectivity, was determined for each case and condition. For comparing the base case and an alternative case, datasets 2 and 3 were evaluated using each calculation schemes. The difference in the selectivity between Case 1 and Case 2, which were investigated under the same conditions, is very significant and is attributed to the reversibility factor of the reaction, as illustrated in Figures1and2. The results of the base case show that when all the reactions are irreversible, it implies that the maximum attainable molar concentration and selectivity of methyl ester have been reached. This verifies the significant role of the forward reactions in (2)–(4).
[image:8.600.308.549.99.312.2]For a simple reversible reaction, we can see the effects of thermodynamic parameter like temperature on the reversibility of the reaction whereas the reversibility of a reaction is controlled by reaction equilibrium constant.
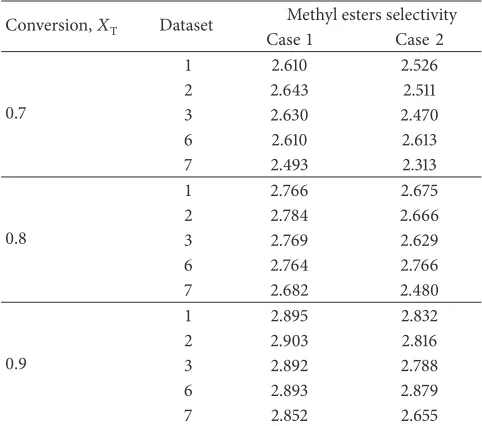
Table 2: Selectivity at 0.7–0.9 triglycerides conversion for datasets (1–3) and (6-7).
Conversion,𝑋T Dataset Methyl esters selectivity
Case 1 Case 2
0.7
1 2.610 2.526
2 2.643 2.511
3 2.630 2.470
6 2.610 2.613
7 2.493 2.313
0.8
1 2.766 2.675
2 2.784 2.666
3 2.769 2.629
6 2.764 2.766
7 2.682 2.480
0.9
1 2.895 2.832
2 2.903 2.816
3 2.892 2.788
6 2.893 2.879
7 2.852 2.655
The reaction equilibrium constant, 𝐾, is defined as the forward rate constant divided by the reverse rate constant and affected by temperature [12]. This transesterification reaction is a complex reaction which consists of three reversible and consecutive reactions. Therefore, for simplification and preliminary design purpose, selectivity is effectively used to determine the effect of temperature and role of catalyst on the reversibility. Figures1and2show significant changes of the selectivity plots for conversion of triglycerides from 0.7 to 0.9 and the plots finally reach the equilibrium at the end of the reaction. In order to access the role of temperature and amount of catalyst on the reversibility of transesterification reaction, Table 2 was constructed by observing the methyl esters selectivity for conversion of triglycerides from 0.7 to 0.9. It presents the difference in selectivity for Case 1 and Case 2. Datasets (1–3) are used to determine the effects of different temperatures on the reversibility of the transesterifi-cation reaction which represent a temperature of 50, 60, and 70, respectively. Conversion of triglyceride at 0.9 is selected for analysis. From this data, we can see that the forward reaction alone is able to provide better selectivity than reverse reaction at any temperature. Datasets (6-7) are used to ana-lyze the role catalyst on the reversibility of transesterification reaction whereas datasets 6 and 7 represent the amount of catalyst of 1.5% and 0.5%, respectively. A significant role of the forward reaction once again was determined at a higher catalyst concentration. The results obtained also indicate that a higher catalyst concentration controls the forward reactions and gives preferably product selectivity.
[image:8.600.58.286.303.477.2]Table 3: Activation energy.
Reaction Activation energy (cal/mol)
T → D 13145
D → T 9932
D → M 19860
M → D 14639
M → G 6421
G→ M 9588
which affects the selectivity and methyl ester conversion, which is likely due to the reverse nature of the reaction [4]. This result suggests that for establishing the optimal chemical process for biodiesel fuel production, it can be assumed that when irreversible reactions are employed, better selectivity can be obtained because of the absence of reverse reactions.
4.2. Effects of Reaction Characteristics on Selectivity. The reactor design stage for a biodiesel plant utilizes methyl ester selectivity for the material balances and stream costs. Attain-ing the appropriate operatAttain-ing conditions through product selectivity can eliminate material and energy recycling, thus reducing costs. The effects of the reaction temperature, molar ratio of methanol to oil, and the catalyst concentration on the selectivity of methyl esters and glycerol are analyzed for both Case 1 and Case 2 in the following subsections.
4.2.1. Effect of Reaction Temperature on Selectivity. An investi-gation on the effect of temperature on methyl ester selectivity was conducted using datasets (1–3), where the molar ratio of alcohol to oil and the catalyst concentration are fixed. The Arrhenius equation was used for this investigation:
𝑘 = 𝑘∘exp(− 𝐸
𝑅𝑇) . (53)
According to (53), the reaction rate, 𝑘, is an integral part of the selectivity expressions. It depends on the energy of activation (𝐸) obtained from the Arrhenius equation [22]. For reactions at different temperatures, fixed molar ratios, and catalyst concentrations, the activation energy is constant. In this study, the kinetic data used to analyze the temperature effect were adapted from Noureddini and Zhu [5]. Because the data published in their research utilize the average reaction rate constants at 50∘C and constant activation energy, (53) can be manipulated to obtain the other reaction rate constants (at 60∘C and 70∘C) listed inTable 1. The results of the activation energy investigated in their study are shown inTable 3.
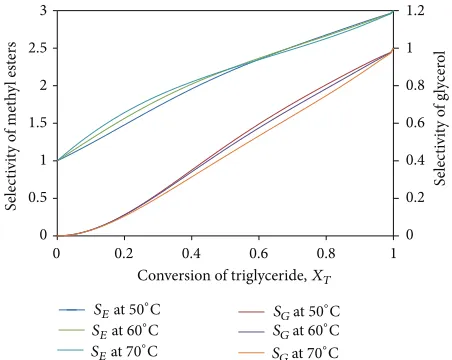
Figures3and4show the effects of the reaction tempera-ture on the selectivity of methyl esters and glycerol for Cases 1 and 2, respectively. The reaction temperature had a small but substantial effect on the selectivity. The figures show that the selectivity of methyl esters is high at a high temperature in the early conversion of T. However, in both figures, the selectivities of E for both Cases 1 and 2 at 70∘C were found to decrease toward the completion of the reaction. As the boiling point of methanol is 64.7∘C, an additional 5∘C has
0 0.2 0.4 0.6 0.8 1 1.2
0.0 0.5 1.0 1.5 2.0 2.5 3.0
0 0.2 0.4 0.6 0.8 1
S
elec
ti
vi
ty o
f g
ly
cer
o
l
S
elec
ti
vi
ty o
f met
h
yl
est
er
s
Conversion of triglyceride,XT
SEat50∘C
SEat60∘C
SEat70∘C
SGat50∘C
SGat60∘C
SGat70∘C
Figure 3: Selectivity of methyl ester at various temperatures and fixed molar ratio and catalyst concentration for Case 1.
S
elec
ti
vi
ty o
f met
h
yl
est
er
s
0 0.2 0.4 0.6 0.8 1 1.2
0 0.5 1 1.5 2 2.5 3
0 0.2 0.4 0.6 0.8 1
S
elec
ti
vi
ty o
f g
ly
cer
o
l
Conversion of triglyceride,XT
SEat50∘C
SEat60∘C
SEat70∘C
SGat50∘C
SGat60∘C
SGat70∘C
Figure 4: Selectivity of methyl ester at various temperatures and fixed molar ratio and catalyst concentration for Case 2.
the effect of lowering the product concentration and affecting the selectivity of E at the equilibrium. This temperature effect changes the slope of selectivity from a concave to a convex shape, which is also related with the reaction rate constant at different temperatures.
[image:9.600.315.541.301.481.2]S
elec
ti
vi
ty o
f g
ly
cer
o
l
0 0.2 0.4 0.6 0.8 1 1.2
0 0.5 1 1.5 2 2.5 3
0 0.1 0.2 0.3 0.4 0.5 0.6 0.7 0.8 0.9 1
S
elec
ti
vi
ty o
f met
h
yl
est
er
s
Conversion of triglyceride,XT
SEfor MR9: 1 SGfor MR9: 1
SGfor MR3: 1
[image:10.600.62.280.70.235.2]SEfor MR3: 1
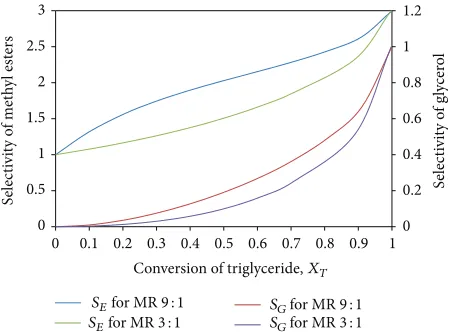
Figure 5: Selectivity of methyl ester at various molar ratios, constant temperature of 65∘C, and catalyst concentration of 1.5 wt.% for Case 1.
S
elec
ti
vi
ty o
f g
ly
cer
o
l
0 0.2 0.4 0.6 0.8 1 1.2
0 0.5 1 1.5 2 2.5 3
0 0.1 0.2 0.3 0.4 0.5 0.6 0.7 0.8 0.9 1
S
elec
ti
vi
ty o
f met
h
yl
est
er
s
Conversion of triglyceride,XT
SEfor MR9: 1 SGfor MR9: 1
SGfor MR3: 1
SEfor MR3: 1
Figure 6: Selectivity of methyl ester at various molar ratios, constant temperature of 65∘C, and catalyst concentration of 1.5 wt.% for Case 2.
The findings confirm that methyl ester selectivity effects can be realistically obtained at the optimum temperature, which is 60∘C in this study. As the reactor optimization requires the relationship between the conversion and selec-tivity in both cases (Case 1 and Case 2), the selecselec-tivity within the studied temperature indicates that the biodiesel reactor may work more efficiently in converting T to E at 60∘C.
4.2.2. Effect of Molar Ratio of Methanol to Oil on Selectivity. An investigation into the effects of the methanol-to-oil molar ratio involves datasets 4 and 5. Selectivity plots of methyl esters and glycerol are shown in Figures5and6. For Cases 1 and 2, the selectivity of methyl esters and glycerol was rela-tively affected by the molar ratio of methanol to oil. It can be seen from the figures that the higher molar ratio of methanol to oil encourages the formation of transesterification reaction products, thus contributing to a higher selectivity.
The most striking result to emerge from the figures is the change in the shape of the selectivity plot from concave
0 0.2 0.4 0.6 0.8 1 1.2
0 0.2 0.4 0.6 0.8 1
Se
le
ct
iv
it
y
(a) (b)
(c)
Triglyceride conversion,XT
Figure 7: Selectivity plots: (a) methyl ester 1, (b) methyl ester 2, and (c) methyl ester 3 for dataset 4.
[image:10.600.314.543.74.230.2]to convex for a molar ratio of 9 : 1. An increasing selectivity of methyl ester can be found in an early conversion of triglyceride, but toward equilibrium, the selectivity is found to slightly decrease. A possible explanation for this might be that the methyl ester concentration has both quadratic as well as cubic effects that can be explained by (42)–(44) and Figure 7.
According to (42), the selectivity of methyl ester 1 is constant at 1. Equation (43) is a quadratic equation, which gives a parabolic shape to the plot of methyl ester 2. Equation (44) clearly illustrates the selectivity of methyl ester 3 when the equation is a cubic one. In more detail, the power of two is more dominant at an𝑋T of less than 0.3, which means
that the formation of E2 is more active under this condition. However, we can see an active formation of E3 at an 𝑋T
of 0.5–1 when the power of three is dominant. At the same time, E1 is formed linearly with a triglyceride conversion. The stepwise transesterification reaction in (2)–(4) shows that each E is formed consecutively. This means that to achieve the maximum yield, the maximum selectivity at the maximum T conversion is necessary, and each E must be formed during the process. Therefore, it can be assumed that the selectivity of methyl ester is more greatly affected by the quadratic and cubic functions at a higher molar ratio of methanol to oil than at a lower one.
[image:10.600.58.283.293.459.2]S
elec
ti
vi
ty o
f g
ly
cer
o
l
S
elec
ti
vi
ty o
f met
h
yl
est
er
s
0 0.2 0.4 0.6 0.8 1 1.2
0 0.5 1 1.5 2 2.5 3
0 0.1 0.2 0.3 0.4 0.5 0.6 0.7 0.8 0.9 1
Conversion of triglyceride,XT
SEfor1.5wt%catalyst
SEfor0.5wt%catalyst SG
for1.5wt%catalyst
[image:11.600.316.543.71.238.2]SGfor0.5wt%catalyst
Figure 8: Selectivity of methyl ester at various catalyst concentra-tions, constant temperature of 30∘C, and molar ratio 9 : 1 for Case 1.
S
elec
ti
vi
ty o
f g
ly
cer
o
l
S
elec
ti
vi
ty o
f met
h
yl
est
er
s
0 0.2 0.4 0.6 0.8 1 1.2
0 0.5 1 1.5 2 2.5 3
0 0.1 0.2 0.3 0.4 0.5 0.6 0.7 0.8 0.9 1
Conversion of triglyceride,XT
SEfor1.5wt%catalyst
SEfor0.5wt%catalyst SG
for1.5wt%catalyst
SGfor0.5wt%catalyst
Figure 9: Selectivity of methyl ester at various catalyst concentra-tions, constant temperature of 30∘C, and molar ratio 9 : 1 for Case 2.
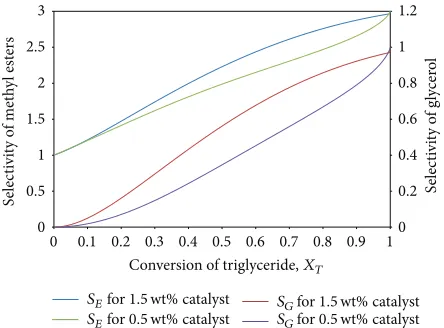
4.2.3. Effect of Catalyst Concentration on Selectivity. Apart from the temperature and molar ratio, the parameters that affect the selectivity are the same as those influencing the reaction rates, namely, the catalyst. The effects of the catalyst concentration are studied through datasets 6 and 7, and the selectivity plots can be seen in Figures8 and9. When analyzing the figures, it can be seen that the selectivity of both products is higher at a higher catalyst concentration.
Toward the equilibrium of the reaction, the selectivity was observed to increase at a higher catalyst concentra-tion, thus contributing to an increased amount of methyl ester formation. Vicente et al. [25] stated that the largest methyl ester conversions are obtained when a large catalyst concentration is employed (1.3%) at a mild temperature (20–50∘C). This agrees with the resulting selectivity curves plotted, which indicates that the catalyst concentration has a positive effect on the selectivity of methyl esters and glycerol. However, a greater application of an alkali catalyst can lead to the production of large amounts of soap, and extra cost is required to remove the catalyst from the reaction system. Srivastava and Prasad [26] have stated that a catalyst
0 0.2 0.4 0.6 0.8 1 1.2
0 0.1 0.2 0.3 0.4 0.5 0.6 0.7 0.8 0.9 1
Se
le
ct
iv
it
y
(a)
(c) (b)
[image:11.600.58.282.71.236.2]Triglyceride conversion,XT
Figure 10: Selectivity plots: (a) methyl ester 1, (b) methyl ester 2, and (c) methyl ester 3 for dataset 6.
concentration of 0.5–1% can yield up to a 99% methyl ester conversion.
In Figures8and9, there is a clear increasing trend of the selectivity of methyl ester for a 1.5 wt.% catalyst concentration during the early conversion of the reactant, which decreases at the end of the reaction. The same transition trend has been found when analyzing the influence of the molar ratio on methyl ester selectivity. A further detailed analysis showed that the quadratic and cubic effects are more significant at a higher catalyst concentration than at a lower catalyst concentration. As shown inFigure 10, the selectivity of E2 has a quadratic plot, whereas the selectivity of E3 has a parabolic shape. Referring to (42)–(44), we can see that E1 is linearly formed with a T conversion. E2 is produced more at a T conversion of lower than 0.35, where we can see that the power of two in (43) is more dominant at this stage. At a T conversion of over 0.5, the effect of the power of three in (44) is dominant, causing a higher formation of E3. Because the transesterification reaction is a reversible and consecutive equation, the formation of three Es is important to achieve a better selectivity. With an optimum amount of catalyst, the reactor becomes more efficient in converting the reactant into the products.
[image:11.600.60.282.284.448.2]0 0.5 1 1.5 2 2.5 3
0 0.1 0.2 0.3 0.4 0.5 0.6 0.7 0.8 0.9 1
PO-case 1 RO-case 1
WSO-case 1 WSO-case 2
RO-case 2 PO-case 2
Conversion of triglyceride,XT
S
elec
ti
vi
ty o
f met
h
yl
est
er
[image:12.600.59.284.70.274.2]s
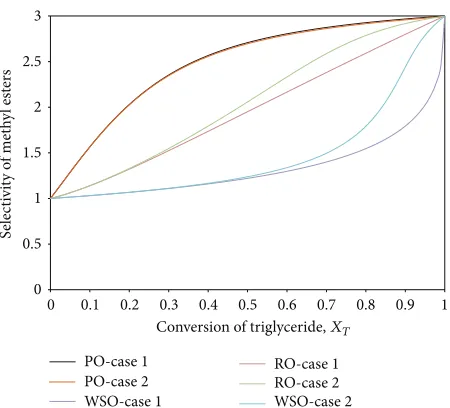
Figure 11: Selectivity plots of methyl ester from various feedstock for Cases 1 and 2.
As discussed before, these free fatty acids will react with alkali catalysts to produce soaps that will inhibit the transesterification reaction. Soaps will allow emulsification that causes the phase separation of methyl ester and glycerol to be less sharp. It produces water that can hydrolyze the triglycerides and contribute to the formation of more soap [14]. The effect of reversibility of transesterification can be seen significantly when analysing the selectivity of methyl ester derived from palm oil. InFigure 11, methyl ester derived from palm oil shows a higher selectivity plot for base case. This finding suggests that forward reaction dominates the reaction and contributes to a better selectivity when low FFAs feedstock is used in biodiesel production. As there are many low cost feedstocks available for biodiesel production, a pretreatment to these feedstocks can be carried out in order to ensure the value of FFAs is within the allowable range.
5. Conclusions
This paper has presented a comprehensive kinetic modeling of a transesterification reaction for biodiesel with homoge-neous alkaline catalyst. The purpose of the study was to develop the kinetic models of transesterification reaction, determine the selectivity of methyl ester and glycerol, and evaluate the significance of the reverse reactions in the trans-esterification reaction. This study has shown that a process model solution was found for two types of common biodiesel reactors. The concentration of each species during transes-terification was found, leading to a selectivity determination during the biodiesel production. In addition, the reversible and irreversible effects of a transesterification reaction were discovered. The forward reaction is more dominant than the reverse reaction, and the maximum selectivity can be found if a base case of transesterification reaction is assumed to have occurred in the biodiesel reactor system. For the various reaction characteristics under investigation, the selectivities
are influenced by the temperature, molar ratio of methanol to oil, catalyst concentration, and type of oil used as the feedstock. Furthermore, an analysis of the selectivity plots indicates an enhanced effect of the reaction characteristics on the selectivity. This research has shown that the selectivity of methyl ester is maximized at 60∘C, a 9 : 1 molar ratio of methanol to oil, and a catalyst concentration of 1.5%. This investigation into the effects of the molar ratio of methanol to oil and the catalyst concentration on the selectivity can be made more interesting if several more curves are plotted at a molar ratio of methanol to oil between 3 : 1 to 9 : 1 and a catalyst concentration between 0.5 and 1.5%. However, a limitation of this research remains in the availability of the reaction rate constants under various reaction condi-tions. In addition, a comparison should be made through mutual reaction conditions. The findings from this study will enhance the concept of selectivity and its applications in the evaluation of complex transesterification reactions when the goal is to attain the maximum production of methyl esters and glycerol. It is recommended that further research is undertaken in exploring the selectivity data for specifying the reactor configurations and may be used in the synthesis of reactor network for biodiesel production.
Nomenclature
𝑘+1, 𝑘−1, 𝑘+2,
𝑘−2,𝑘+3,𝑘−3:
Reaction constant
𝐶T,𝐶D,𝐶M,𝐶G,
𝐶E1, 𝐶E2, 𝐶E3,
𝐶A,𝐶E:
Molar concentration of triglyceride, diglyceride, monoglyceride, glycerol, ester 1, ester 2, ester 3, methanol, and methyl ester
𝑋T: Conversion of triglyceride
𝑀𝑅: Molar ratio
𝐶T0: Initial molar concentration of
triglyceride
𝑆E,𝑆G: Selectivity of methyl ester, glycerol 𝛼: Reaction rate constant factor
wt.%: Weight percent
T: Triglyceride
D: Diglyceride
M: Monoglyceride
A: Methanol
G: Glycerol
E: Methyl ester
E1: Methyl ester 1
E2: Methyl ester 2
E3: Methyl ester 3
PFR: Plug flow reactor
CSTR: Continuous stirred tank reactor 𝑁T0: Initial amount of triglyceride at𝑡 = 0
𝑁T: The amount of triglyceride present at
time,𝑡
𝑉: Volume
PO: Palm oil
RO: Rapeseed oil
Conflict of Interests
The authors declare that there is no conflict of interests re-garding the publication of this paper.
Acknowledgment
The work was carried out with the financial support from the Ministry of Education, Malaysia.
References
[1] A. Demirbas, “Biodiesel from triglycerides via transesterifica-tion,” inBiodiesel, pp. 121–140, Springer, London, UK, 2008. [2] D. Darnoko and M. Cheryan, “Kinetics of palm oil
transesteri-fication in a batch reactor,”JAOCS, Journal of the American Oil Chemists’ Society, vol. 77, no. 12, pp. 1263–1267, 2000.
[3] T. Leevijit, W. Wisutmethangoon, G. Prateepehaikul, C. Tongu-rai, and M. Allen, “A second order kinetics of palm oil transes-terification in a batch reactor,” inProceedings of the Joint Inter-national Conference on Sustainable Energy and Environment, pp. 277–281, 2004.
[4] S. Jain and M. P. Sharma, “Kinetics of acid base catalyzed trans-esterification ofJatropha curcasoil,”Bioresource Technology, vol. 101, no. 20, pp. 7701–7706, 2010.
[5] H. Noureddini and D. Zhu, “Kinetics of transesterification of soybean oil,”Journal of the American Oil Chemists’ Society, vol. 74, no. 11, pp. 1457–1463, 1997.
[6] D. Kusdiana and S. Saka, “Kinetics of transesterification in rape-seed oil to biodiesel fuel as treated in supercritical methanol,” Fuel, vol. 80, no. 5, pp. 693–698, 2001.
[7] M. Diasakou, A. Louloudi, and N. Papayannakos, “Kinetics of the non-catalytic transesterification of soybean oil,”Fuel, vol. 77, no. 12, pp. 1297–1302, 1998.
[8] H. Maeda, S. Hagiwara, H. Nabetani et al., “Biodiesel fuels from palm oil via the non-catalytic transesterification in a bubble column reactor at atmospheric pressure: a kinetic study,” Renewable Energy, vol. 33, no. 7, pp. 1629–1636, 2008.
[9] P. C. Narv`aez, S. M. Rinc´on, and F. J. S´anchez, “Kinetics of palm oil methanolysis,”Journal of the American Oil Chemists’ Society, vol. 84, pp. 971–977, 2007.
[10] E. Minami and S. Saka, “Kinetics of hydrolysis and methyl esterification for biodiesel production in two-step supercritical methanol process,”Fuel, vol. 85, no. 17-18, pp. 2479–2483, 2006. [11] B. Freedman, R. O. Butterfield, and E. H. Pryde, “Transesteri-fication kinetics of soybean oil 1,”Journal of the American Oil Chemists’ Society, vol. 63, no. 10, pp. 1375–1380, 1986.
[12] O. Levenspiel,Chemical Reaction Engineering, John Wiley & Sons, New York, NY, USA, 3rd edition, 1999.
[13] J. M. Douglas, Conceptual Design of Chemical Processes, McGraw Hill, 1988.
[14] J. van Gerpen, B. Shanks, R. Pruszko, D. Clements, and G. Knothe,Biodiesel Production Technology. Subcontractor Report, National Reanewable Energy Laboratory, 2004.
[15] H. J. Wright, J. B. Segur, H. V. Clark, S. K. Coburn, E. E. Langdon, and R. N. DuPuis, “A report on ester interchange,”Oil & Soap, vol. 21, no. 5, pp. 145–148, 1944.
[16] H. Fukuda, A. Kondo, and H. Noda, “Biodiesel fuel production by transesterification of oils,”Journal of Bioscience and Bioengi-neering, vol. 92, no. 5, pp. 405–416, 2001.
[17] L. Friesenhagen and H. Lepper, “Process for the production of fatty acid esters of short-chain aliphatic alcohols from fats and/or oils containing free fatty acids,” US Patent 4608202, 1986. [18] P. Felizardo, J. MacHado, D. Vergueiro, M. J. N. Correia, J. P. Gomes, and J. M. Bordado, “Study on the glycerolysis reaction of high free fatty acid oils for use as biodiesel feedstock,”Fuel Processing Technology, vol. 92, no. 6, pp. 1225–1229, 2011. [19] A. Tafesh and S. Basheer, “Pretreatment methods in biodiesel
production processes,” inPretreatment Techniques for Biofuels and Biorefineries, Z. Fang, Ed., Green Energy and Technology, pp. 417–434, Springer, Berlin, Germany, 2013.
[20] D. Kusdiana and S. Saka, “Effects of water on biodiesel fuel production by supercritical methanol treatment,”Bioresource Technology, vol. 91, no. 3, pp. 289–295, 2004.
[21] K. Komers, F. Skopal, R. Stloukal, and J. Machek, “Kinetics and mechanism of the KOH—catalyzed methanolysis of rapeseed oil for biodiesel production,”European Journal of Lipid Science and Technology, vol. 104, pp. 728–737, 2002.
[22] A. K. Coker,Modeling of Chemical Kinetics and Reactor Design, Gulf Publishing, Houston, Tex, USA, 2001.
[23] C. D. Holland and R. G. Anthony,Fundamentals of Chemical Reaction Engineering, Prentice-Hall, 1979.
[24] J. K. Rodr´ıguez-Guerrero, M. F. Rubens, and P. T. V. Rosa, “Production of biodiesel from castor oil using sub and super-critical ethanol: effect of sodium hydroxide on the ethyl ester production,”The Journal of Supercritical Fluids, vol. 83, pp. 124– 132, 2013.
[25] G. Vicente, M. Mart´ınez, and J. Aracil, “Optimisation of integrated biodiesel production. Part I. A study of the biodiesel purity and yield,”Bioresource Technology, vol. 98, no. 9, pp. 1724– 1733, 2007.
[26] A. Srivastava and R. Prasad, “Triglycerides-based diesel fuels,” Renewable and Sustainable Energy Reviews, vol. 4, no. 2, pp. 111– 133, 2000.
[27] B. Klofutar, J. Golob, B. Likozar, C. Klofutar, E. ˇZagar, and I. Poljanˇsek, “The transesterification of rapeseed and waste sunflower oils: mass-transfer and kinetics in a laboratory batch reactor and in an industrial-scale reactor/separator setup,” Bioresource Technology, vol. 101, no. 10, pp. 3333–3344, 2010. [28] S. D. Crymble, “Optimization and Reaction Kinetics of the
International Journal of
Aerospace
Engineering
Hindawi Publishing Corporation
http://www.hindawi.com Volume 2014
Robotics
Journal ofHindawi Publishing Corporation
http://www.hindawi.com Volume 2014
Hindawi Publishing Corporation
http://www.hindawi.com Volume 2014
Active and Passive Electronic Components
Control Science and Engineering
Journal of
Hindawi Publishing Corporation
http://www.hindawi.com Volume 2014
Machinery
Hindawi Publishing Corporation
http://www.hindawi.com Volume 2014
Hindawi Publishing Corporation http://www.hindawi.com
Journal of
Engineering
Volume 2014
Submit your manuscripts at
http://www.hindawi.com
VLSI Design
Hindawi Publishing Corporation
http://www.hindawi.com Volume 2014
Hindawi Publishing Corporation
http://www.hindawi.com Volume 2014
Shock and Vibration Hindawi Publishing Corporation
http://www.hindawi.com Volume 2014
Civil Engineering
Advances inAcoustics and VibrationAdvances in Hindawi Publishing Corporation
http://www.hindawi.com Volume 2014
Hindawi Publishing Corporation
http://www.hindawi.com Volume 2014
Electrical and Computer Engineering
Journal of
Advances in OptoElectronics
Hindawi Publishing Corporation
http://www.hindawi.com Volume 2014
The Scientific
World Journal
Hindawi Publishing Corporation
http://www.hindawi.com Volume 2014
Sensors
Journal ofHindawi Publishing Corporation
http://www.hindawi.com Volume 2014
Modelling & Simulation in Engineering
Hindawi Publishing Corporation
http://www.hindawi.com Volume 2014
Hindawi Publishing Corporation
http://www.hindawi.com Volume 2014
Chemical Engineering
International Journal of Antennas and
Propagation
International Journal of
Hindawi Publishing Corporation
http://www.hindawi.com Volume 2014
Hindawi Publishing Corporation
http://www.hindawi.com Volume 2014
Navigation and Observation
International Journal of
Hindawi Publishing Corporation
http://www.hindawi.com Volume 2014