16S rRNA Gene Sequencing as Alternative Methods of Bacterial
Pathogen Detection
Brianna Lindsay,aMihai Pop,bMartin Antonio,cAlan W. Walker,dVolker Mai,eDilruba Ahmed,fJoseph Oundo,gBoubou Tamboura,h Sandra Panchalingam,aMyron M. Levine,aKaren Kotloff,aShan Li,aLaurence S. Magder,aJoseph N. Paulson,bBo Liu,b
Usman Ikumapayi,cChinelo Ebruke,cMichel Dione,cMitchell Adeyemi,cRichard Rance,dMark D. Stares,dMaria Ukhanova,e Bret Barnes,iIan Lewis,iFiroz Ahmed,fMeer Taifur Alam,fRuhul Amin,fSabbir Siddiqui,fJohn B. Ochieng,gEmmanuel Ouma,g Jane Juma,gEunice Mailu,gRichard Omore,gCiara E. O’Reilly,lJames Hannis,jSheri Manalili,jJonna DeLeon,jIrene Yasuda,j Lawrence Blyn,jRaymond Ranken,jFeng Li,jRoberta Housley,jDavid J. Ecker,jM. Anowar Hossain,fRobert F. Breiman,g J. Glenn Morris,eTimothy K. McDaniel,iJulian Parkhill,dDebasish Saha,cRangarajan Sampath,jO. Colin Stine,aJames P. Natarok
University of Maryland, School of Medicine, Baltimore, Maryland, USAa; University of Maryland, College Park, Maryland, USAb; Medical Research Council Unit, Serrekunda,
The Gambiac; Wellcome Trust Sanger Institute, Hinxton, Cambridgeshire, United Kingdomd; University of Florida, Gainesville, Florida, USAe; International Centre for
Diarrhoeal Disease Research, Bangladesh, Dhaka, Bangladeshf; CDC/Kenya Medical Research Institute Research Station, Kisumu, Kenyag; Center for Vaccine Development,
Bamako, Malih; Illumina, San Diego, California, USAi; Ibis, San Diego, California, USAj; University of Virginia, Charlottesville, Virginia, USAk; Division of Foodborne,
Waterborne, and Environmental Diseases, U.S. Centers for Disease Control and Prevention, Atlanta, Georgia, USAl
Cultivation-based assays combined with PCR or enzyme-linked immunosorbent assay (ELISA)-based methods for finding
viru-lence factors are standard methods for detecting bacterial pathogens in stools; however, with emerging molecular technologies,
new methods have become available. The aim of this study was to compare four distinct detection technologies for the
identifica-tion of pathogens in stools from children under 5 years of age in The Gambia, Mali, Kenya, and Bangladesh. The children were
identified, using currently accepted clinical protocols, as either controls or cases with moderate to severe diarrhea. A total of
3,610 stool samples were tested by established clinical culture techniques: 3,179 DNA samples by the Universal Biosensor assay
(Ibis Biosciences, Inc.), 1,466 DNA samples by the GoldenGate assay (Illumina), and 1,006 DNA samples by sequencing of 16S
rRNA genes. Each method detected different proportions of samples testing positive for each of seven enteric pathogens,
entero-aggregative
Escherichia coli
(EAEC), enterotoxigenic
E.
coli
(ETEC), enteropathogenic
E.
coli
(EPEC),
Shigella
spp.,
Campylobac-ter jejuni,
Salmonella enterica, and
Aeromonas
spp. The comparisons among detection methods included the frequency of
posi-tive stool samples and kappa values for making pairwise comparisons. Overall, the standard culture methods detected
Shigella
spp., EPEC, ETEC, and EAEC in smaller proportions of the samples than either of the methods based on detection of the
viru-lence genes from DNA in whole stools. The GoldenGate method revealed the greatest agreement with the other methods. The
agreement among methods was higher in cases than in controls. The new molecular technologies have a high potential for highly
sensitive identification of bacterial diarrheal pathogens.
T
he detection of pathogens in stools has been performed
tradition-ally using techniques developed and applied in high-income
countries. These methods, developed over the past century and
rig-orously tested and approved for use for clinical diagnostic purposes,
include the standard clinical culture for identifying pathogens,
some-times after an enrichment step, on a selective or differential medium
that inhibits the growth of many bacteria and is permissive to the
pathogen of interest. After sufficient growth is attained, the colonies
are tested by PCR for the selected genes or agglutinated with antisera
specific for the pathogen. Alternatively, enzyme-linked
immunosor-bent assays (ELISAs) or PCR methods may be used directly on fecal
samples. Despite the widespread use of these methods in
high-in-come countries, their adoption for routine use in low-inhigh-in-come
coun-tries has been very limited (1,
2). The availability and costs of technical
expertise, supplies, equipment, and equipment maintenance are
fac-tors which have limited the adoption of diagnostic microbiology
methods in these settings (3). Simple, inexpensive, and reliable
point-of-care diagnostic tests that rapidly identify treatable etiologies of
di-arrhea are needed in low-income countries. We sought to compare
the abilities of four different emerging technologies to identify the
presence of enteric pathogens in stools from children in low-income
countries.
The new molecular methods have great appeal as the
technol-ogies are increasingly robust and affordable and potentially more
precise. Three alternative technologies are based upon detection
of specific DNA sequences. One technology, the GoldenGate assay
(Illumina, San Diego, CA), has been adapted for microbiological
detection (4). The assay is based on the specific hybridization of
primers to target DNA in the solution and the ligation of two
primers to form a product that can be amplified with efficiency
equal to that for the other ligated products. Amplified ligation
products are hybridized to microbeads and detected in an optical
microarray format in a Bead Express station (Illumina). The
sec-Received22 May 2013Returned for modification24 June 2013
Accepted16 July 2013
Published ahead of print24 July 2013
Address correspondence to Brianna Lindsay, [email protected]. B. Lindsay, M.P., M.A., A.W.W., V.M., D.A., J.O., and B.T. are co-first authors. M.A.H., R.F.B., J.G.M., T.K.M., J.P., D.S., R.S., O.C.S., and J.P.N. are co-senior authors. Copyright © 2013, American Society for Microbiology. All Rights Reserved.
doi:10.1128/JCM.01342-13
on May 16, 2020 by guest
http://jcm.asm.org/
ond technology is the Ibis Universal Biosensor assay (5). It
em-ploys a series of PCR primers to amplify selected targets; after
amplification, the target DNAs are detected by electrospray
ion-ization-mass spectrometry (ESI-MS) (Ibis, San Diego, CA). The
third technology is high-throughput sequencing of fecal community
DNA after amplification of 16S rRNA genes (6). Sequences are then
processed to identify operational taxonomic units (OTUs). This
method can distinguish between genera and some species of bacteria
but cannot distinguish among pathotypes of a single species, e.g.,
enteroaggregative
Escherichia coli
(EAEC), enterotoxigenic
E. coli
(ETEC), enteropathogenic
E. coli
(EPEC), and
Shigella
spp.
These three new technologies were compared with
conven-tional methods on stool samples collected from case and control
children in The Gambia, Mali, Kenya, and Bangladesh during the
Global Enterics Multicenter Study (GEMS) funded by the Bill and
Melinda Gates Foundation (7,
8). Comparisons were done for seven
detectable pathogens, EAEC, ETEC, EPEC,
Shigella
spp.,
Campylo-bacter jejuni
,
Salmonella enterica
, and
Aeromonas
spp. Our analyses
showed that no method is clearly superior, but the GoldenGate
method agreed most frequently with the other methods.
MATERIALS AND METHODS
Stool samples and DNA isolation.Stool samples were collected as part of the GEMS. Children less than 5 years old seeking care for episodes of diarrhea (passage ofⱖ3 abnormally loose stools within the previous 24 h) at health care facilities serving field site populations were considered. Those who presented within 7 days of the onset of their illness and met the case definition of moderate to severe diarrhea were eligible for enrollment. The episodes meeting the inclusion criteria included exhibition of the most objective signs of dehydration, including sunken eyes, a loss of nor-mal skin turgor, a decision to initiate intravenous hydration or hospitalize the child, or the presence of blood in the stool (dysentery). Within 2 weeks of enrollment of a case, 1 to 3 randomly selected control children without diarrhea, matched to the case by age, gender, and village, were enrolled from the community (8). Stool samples were cultured 7 h on average after defecation. The stool samples were tested for 15 potential diarrheagenic pathogens and their subtypes by culture and subsequent PCR and immu-nological methods (7). After homogenization of fecal samples by vortex-ing with 3-mm glass beads (Sigma Life Science, St. Louis, MO), bacterial cell walls were disrupted using a bead beater with 0.1-mm zirconium beads (catalog no. 110791012; BioSpec Products, Bartlesville, OK). The cell slurry was centrifuged, and the supernatant was removed and pro-cessed using the Qiagen (Hilden, Germany) QIAamp DNA stool extrac-tion kit. The extracted DNA was precipitated, and the DNA was shipped to the University of Maryland (Baltimore, MD), following the appropriate in-country approvals. DNA was then resuspended, and aliquots were dis-tributed to Ibis and Illumina. For the current study, we utilized specimens from The Gambia, Mali, Kenya, and Bangladesh, chosen based on geo-graphic representation from Asia and sub-Saharan Africa and close col-laboration with the sites’ principal investigators.
Culture.The clinical pathogen identification methods were com-pleted in each of the participating countries (The Gambia, Mali, Kenya, and Bangladesh) and were described in detail by Panchalingam et al. (7). Briefly, the stool specimens were collected in sterile containers and exam-ined within 24 h of passage. The stool specimens were stored at 2 to 8°C while in transit to the laboratory. Conventional bacteriological, immuno-logical, and molecular methods were used to identify bacterial pathogens.
Vibrio cholerae,Vibrio parahaemolyticus,Aeromonasspp.,C. jejuni, Cam-pylobacter coli,Salmonellaspp.,Shigellaspp., and diarrheagenicE. coli
were isolated from the appropriate selective media and identified by stan-dard biochemical tests. The stanstan-dard protocol was to test three putative lactose-positive and indole-positiveE. coli-like colony morphologies se-lected from the MacConkey plate for diarrheagenicE. colias previously described (7). The species and subtypes were confirmed by serotyping (for
ShigellaandSalmonellaspp.) with commercially available antisera (Rea-gensia, Solna, Sweden, and Denka Seiken, Tokyo, Japan) and by PCR tests for both the heat-labile and heat-stable enterotoxin producers of ETEC, typical and atypical EPEC, and EAEC.
GoldenGate assay.Performed at Illumina, the GoldenGate assay con-sists of allele-specific oligonucleotides (ASOs) or locus-specific oligonu-cleotides (LSOs) that are hybridized to the target sequence and ligated together, and the ligated products are PCR amplified using primers attached to the 5=ends of the ASOs or LSOs. The primers were designed using GoldenGate design software (see reference9for details in the Gold-enGate assay workflow). In addition, a “Laguna” probe was designed to hybridize to the target DNA, specifically avoiding sequences from human and the various target organisms. The probe is attached to streptavidin and, when precipitated, increases the purity of the target DNA. Multiple probes sets were designed for each target organism.
Sixty-nine sets of probes were simultaneously hybridized to the target DNAs following the methods described in the GoldenGate Genotyping with VeraCode Technology instructions (4). After the beads were scored in the array, the background intensity was calculated for each sample by taking the 50th percentile for all probes present, because it is unlikely that more than half of the targets would be present in a sample. After back-ground subtraction from all the probes, the mean intensities and standard deviations were calculated for all the probes. Greater than 3 standard deviations was the threshold for a probe to detect a target. To call a target present, at least half of its probes had to be detected.
Universal Biosensor assay.Performed at Ibis, this method uses an automated process for aliquoting extracted DNAs, amplifying DNA using PCR primers for the detection of microorganisms of interest, and then subjecting the amplified products to ESI-MS (5). Six pairs of primers targeting 16S and 23S rRNA genes were used to identify microbes broadly (Gram positive, Gram negative, aerobic, and anaerobic), followed by primer pairs to characterize 17 additional genes (ctxA,ctxB,east-1,east -2A,estA1,eltA,eltB,stx1A,stx1B,aggR,aatA,eae,invA,ipaH,ipaA,ipaC, andipaB) used to identify the pathogen-specific markers. The mass spec-trometer measures the amplicons of the PCR product to calculate a mo-lecular weight, and the composition of the nucleotides can be deduced for each amplicon present. The Universal Biosensor assay utilizes a database of sequence base composition of known microorganisms to determine which microorganisms are present. The Universal Biosensor assays tested for broad groups of microorganisms, includingCampylobacterspp., Clos-tridiumspp.,E. coli,Escherichiaspp., nontyphoidalSalmonellaspp., Sal-monella entericaserovar Typhi,Shigella dysenteriae,Shigella flexneri, Shi-gella boydii,Shigella sonnei,V. cholerae,V. parahaemolyticus, ETEC, EPEC, EAEC, andYersiniaspp. and the genesctxA,ctxB,eae,east-1,invA,ipaB,
ipaC,ipaD, andipaH.
16S rRNA gene survey.The DNA from stool samples was amplified using “universal” primers 27F (5=-AGAGTTTGATCCTGGCTCAG-3=) and 338R (5=-CATGCTGCCTCCCGTAGGAGT-3=). A single reverse primer and a set of 96 barcoded forward primers were used. The presence of amplified products was confirmed on agarose gels, and aliquots from each of the 96 samples were added in equimolar amounts to a final mix. This was sequenced using the FLX sequencing kit and the 454 FLX se-quencing platform (454 Life Sciences, Branford, CT). Individual reads were filtered for quality using custom in-house scripts that perform the following checks suggested by Huse et al. (10): (i) sequences containing any ambiguous bases (N) were removed, (ii) sequences that were shorter than 75 cycles of the 454 instrument were removed (each cycle yields an average of 2.5 bp, depending on the sequence composition), and (iii) sequences for which a barcode could not be identified were removed (10). The remaining sequences were separated into sample-specific sets accord-ing to their barcodes, and the barcodes were removed. The conservative OTUs were constructed by pooling together the sequences from all sam-ples and then were clustered using DNACLUST with the default parame-ters (98% identity clusparame-ters) (11). Pooling the samples ensures that the definition of an OTU is consistent across all the samples. To obtain
taxo-Lindsay et al.
on May 16, 2020 by guest
http://jcm.asm.org/
nomic identification, a representative sequence from each OTU was aligned to the Ribosomal Database Project (RDP) (release 10.4 [seehttp: //rdp.cme.msu.edu]) using BLASTN with long word length (-W 100) in order to detect only nearly identical sequences. A reference database of 16S rRNA gene sequences from known enteric pathogens was manually curated by extracting full-length 16S rRNA gene sequences from isolated genomes in the RDP (on 1 April 2011) forClostridium difficile,V. cholerae,
V. parahaemolyticus,S. enterica,SalmonellaEnteritidis,Salmonella Typhi-murium,C. jejuni,C. coli,Helicobacter pylori, andYersinia enterocolitica. All sequences from each OTU were searched against the full RDP and the enteric pathogen subset using BLAST (best hit with similarity,ⱖ97%).
Statistical analysis.The percentages of samples positive for diarrheal pathogens in each method were determined by dividing the number of samples identified as positive by the total number of samples tested. Co-hen’s kappa was used to describe the agreement between two detection methods. Cohen’s kappa is advantageous because it does not require the specification of a gold standard but simply quantifies the agreement be-tween binary outcomes of tests (positive or negative), taking into account agreement occurring by chance (12). The kappa term ranges from⫺1 to 1 and can be negative if the agreement is less than what would be expected by chance. The following labels were assigned to the corresponding ranges of kappa strength: poor agreement,⬍0; slight, 0.0 to 0.20; fair, 0.21 to 0.40; moderate, 0.41 to 0.60; substantial, 0.61 to 0.80; and almost perfect, 0.81 to 1.00 (12,13). All statistical analyses were performed using SAS version 9.2 (SAS Institute, Cary, NC).
RESULTS
Pathogen detection in stool samples.
The frequency of detection
of each pathogen varied from one method to the next (Fig. 1A
and
B). The comparisons were based on the percent frequency of
de-tection in order to normalize the methods because different
num-bers of specimens were tested. We tested 3,610 stool samples with
the culture method, 3,179 DNA samples with the Universal
Bio-sensor method, 1,466 DNA samples with the GoldenGate method,
and 1,006 DNA samples with the 16S rRNA gene survey method
(Table 1). Although attempts were made to identify
V. cholerae
and
V. parahaemolyticus
on each sample, no method detected
more than 10 specimens with these pathogens, so no comparisons
were made. Identification of EHEC was attempted with only the
Universal Biosensor method, so these results are not presented.
[image:3.585.44.543.65.303.2]The pathotypes of
E. coli
and
Shigella
spp. were differentiated
FIG 1Histogram of the percentages of samples positive for specific pathogens by each method of detection. The pathogens were separated into two panels because the 16S rRNA gene survey is unable to identify the pathogens in panel A. (A) Percentage of samples that were positive forShigellaspp. and specific pathotypes ofE. coliby the GoldenGate, Universal Biosensor, and culture methods. (B) Samples that were positive for specific species. The heights of each histogram bar was calculated by dividing the number of samples where the pathogen was detected by the total number of samples. The bars are colored according to the proportion of cases and the proportion of controls.TABLE 1Demographic characteristics of enrolled children and detection methods by case and control status
Characteristics and detection methods
Cases (n⫽1,500)
Controls (n⫽2,110)
Total (n⫽3,610)
No. % No. %
Age group (mo)
0 to⬍12 645 45.9 759 54.1 1,404
12 to⬍24 497 39.9 750 60.1 1,247
24 to 59 358 37.3 601 62.7 959
Site
The Gambia 418 44.0 532 56.0 950
Mali 139 48.8 146 51.2 285
Kenya 694 44.2 875 55.8 1,569
Bangladesh 249 30.9 557 69.1 806
Male 834 41.3 1,187 58.7 2,021
Detection method
Culture 1,500 41.6 2,110 58.5 3,610
16S rRNA gene survey 513 51.0 493 49.0 1,006
GoldenGate assay 678 46.3 788 53.8 1,466
Universal Biosensor assay 1,327 41.7 1,852 58.3 3,179
on May 16, 2020 by guest
http://jcm.asm.org/
[image:3.585.298.543.503.723.2]on the basis of virulence genes specific to each subtype. As the 16S
rRNA gene survey method does not detect virulence genes, it was
not compared to the other methods for these pathogens. As seen
in
Fig. 1A, the culture-based method detected
Shigella
spp., EPEC,
ETEC, and EAEC in a smaller proportion of the samples than
either of the methods (GoldenGate or Universal Biosensor) based
on detection of the virulence genes from DNA from whole stools.
For
Shigella
spp., EPEC, and ETEC, the proportions of samples in
which the virulence genes were detected were very similar for the
Universal Biosensor and GoldenGate methods, while for EAEC,
the GoldenGate method detected the virulence genes in a
substan-tially higher proportion of samples.
Two pathogens,
C. jejuni
and
S. enterica
, could be detected by
all of the four methods (Fig. 1B).
Aeromonas
spp. were detected by
the culture-based method, the 16S rRNA gene survey, and the
GoldenGate method, and
C. difficile
was detected by the 16S rRNA
gene survey, the GoldenGate method, and the Universal Biosensor
method. The Universal Biosensor method rarely detected
C. jejuni
and
C. difficile
, but it identified
S. enterica
in the highest
propor-tion of cases. As with the pathotypes, the culture-based method
consistently detected pathogens in fewer stool samples than did
the GoldenGate method. The 16S rRNA gene survey method
de-tected
C. jejuni
,
C. difficile
, and
S. enterica
in proportions similar to
those detected by the GoldenGate method.
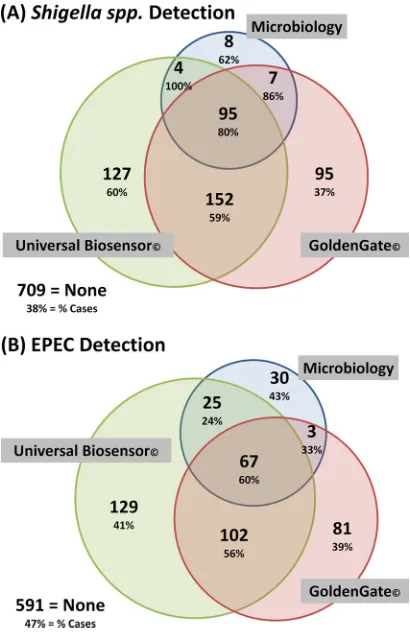
Shigella
spp. and EPEC were detected relatively more
consis-tently among the methods.
Figure 2A
and
B
shows Venn diagrams
that highlight the numbers of
Shigella
spp. and EPEC identified by
each method and the overlap of the methods. Generally, as the
number of detection methods that positively identified the
patho-gen increased, so did the proportion of cases within that group.
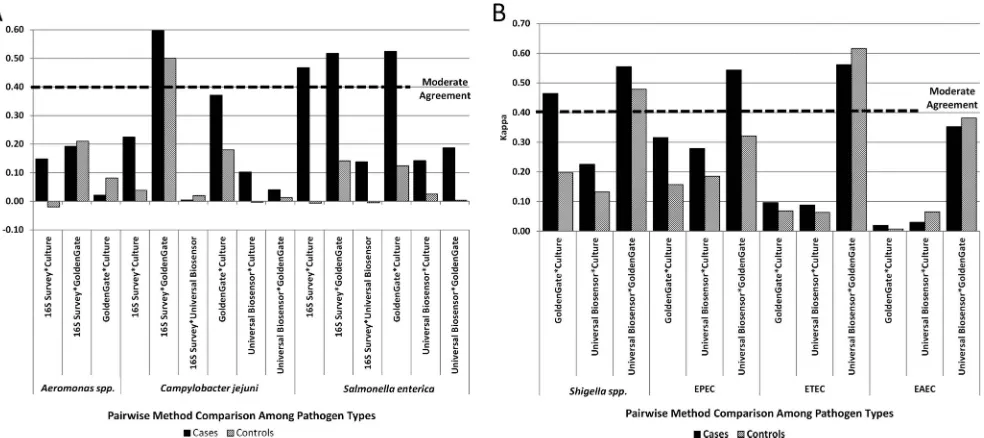
Comparison between methods.
The agreement between
methods was determined by comparing the positive and negative
results for each sample successfully tested by each possible pair of
methods. The best agreement exceeding the threshold (0.41) for
moderate agreement was observed in four instances; the Universal
Biosensor and GoldenGate methods agreed on EPEC, ETEC, and
Shigella
spp., and the GoldenGate and 16S rRNA gene survey
methods agreed on
C. jejuni
. Fair agreement (kappa values, 0.21 to
0.40) was observed between the GoldenGate and culture methods
for five pathogens (EPEC,
Shigella
spp.,
C. jejuni
,
Aeromonas
spp.,
and
S. enterica
), and between the Universal Biosensor and culture
methods for two pathogens (EPEC and
Shigella
spp.). We found
that the agreement between methods was higher in the cases than
in the controls in 21 of the 27 possible comparisons (Fig. 3).
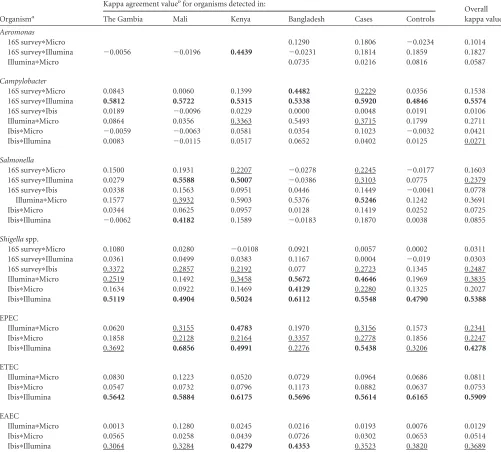
To determine whether there were any site-specific biases,
kappa values were computed for the data from each individual site
(Table 2). After a comparison across all four sites, the GoldenGate
method appears to be the one that contributes to relatively high
kappa values most frequently. The GoldenGate and Universal
Biosensor methods detect pathogenic ETEC, EPEC, EAEC, and
Shigella
spp. at similar rates and at greater-than-conventional
cul-ture rates. The GoldenGate and 16S rRNA gene survey methods
detected
Aeromonas
spp.,
C. jejuni
,
Salmonella enterica
, and
Clos-tridium
spp. at similar rates, greater than the culture-based rates.
16S rRNA gene survey results.
The survey detected a total of
97,666 nonunique OTUs. Of these, only 25,834 that were detected
in more than 5 samples or had more than 20 sequences in at least
1 sample were included in further analyses. The number of OTUs
per sample averaged 465.27 and ranged from 3 to 1,439. For the
pathogens
C. jejuni
,
C. difficile
,
S. enterica
, and
Aeromonas
spp.,
representative 16S rRNA gene sequences were selected from the
Ribosomal Database Project, and OTUs that varied by less than
2% from these sequences were assigned to that species. This was
not done for OTUs matching
E. coli
, as
E. coli
strains can be either
commensal or pathogenic. Seventy OTUs were designated
C.
jejuni
, 8
C. difficile
, 3
S. enterica
, and 3
Aeromonas
spp.
C. jejuni
was
detected most often, being present in 25% of the total number of
samples, with
C. difficile
,
S. enterica
, and
Aeromonas
spp. being
present in 7%, 2%, and 2%, respectively.
DISCUSSION
Culture-based methods are commonly used for detecting enteric
pathogens, and in our hands, the standard tests detected many
pathogens. It is notable, though, that there were numerous
sam-ples where the alternative molecular techniques detected the
ap-parent presence of a pathogen despite the absence of that
patho-gen according to the standard clinical method. However, that
same statement could be made for every other method as well;
each method failed to detect a specific pathogen in a sample where
one or more of the other methods did detect the same pathogen.
A
priori
reasons abound for false positives and false negatives for
FIG 2Venn diagram depicting identification overlap between methods. Each case and control sample was tested by all three methods. The top number in each sector represents the number of positive cases and controls identified by each method, and the lower percentage is the number of cases identified di-vided by the total number of samples (cases and controls) positive by each method. The size of the circle and overlap between circles are proportional to the categoricalnvalues. (A)Shigellaspp. (n⫽1,197). In 709 samples, noShigellasp. was detected. (B) EPEC (n⫽1,028). In 591 samples, no method detected EPEC.
Lindsay et al.
on May 16, 2020 by guest
http://jcm.asm.org/
[image:4.585.319.524.66.382.2]each of the methods; the potential sources include contamination,
PCR failure, limits to detection, genetic variation, and complexity
of the composition of the stools (14). Nevertheless, the different
methods of detection often detect the same pathogen in the same
stool sample, indicating that the methods have some agreement.
We interpret these data to indicate that, at this time, there is no
gold standard for detecting pathogens. The lack of a gold standard
limits the analyses.
When the culture methods identified the target organisms,
we were able to confirm that the microbes were truly present.
However, a negative result may have been either true, because
the organism was not present, or false, because (i) the organism
did not grow as a result of inadvertent inhibition by the
selec-tive medium used, (ii) the specimen transport conditions
com-promised the organism, or (iii) laboratory inefficiencies were
present. Published results and our own unpublished results
revealed that testing a greater number of
E. coli
isolates (e.g.,
testing 5 colonies instead of 3 picked from a MacConkey plate)
will increase the rates of recovery, thereby confirming the
pos-sibility of some false negatives (15). Compared to those of other
methods, the culture-based results showed fair agreement with
the GoldenGate method on
Aeromonas
spp.,
C. jejuni
, and
S.
enterica
and with both the Universal Biosensor and
Golden-Gate methods for EPEC and
Shigella
spp.
The Universal Biosensor and GoldenGate methods are the two
most similar methods. Both methods detected EAEC, EPEC,
ETEC, and
Shigella
spp. at much higher rates than did the
culture-based method and had the highest rates of agreement for these
pathogens. Each method starts with the specific hybridization of
two primers to DNA and detects the same virulence genes,
al-though with distinct primers, but they have limits of detection
based on the ability of the primers to hybridize. Any sample with
the specific DNA of interest below the detection limit will produce
a false negative that may be overcome in the culture-based
method, which has the potential to enrich and grow a bacterium
from a single CFU. False positives will occur if the virulence genes,
usually found on mobile elements, are found in bacteria other
than the expected pathogen.
The sequence survey method is based on amplifying the 16S
rRNA gene of bacteria using universal primers and then counting
the presence of the different 16S rRNA gene sequences. In order to
be counted, the bacteria must constitute 1/
n
or more (where
n
is
the number of sequences counted) of the community. Since
n
is
on average 3,900, the bacteria in question must be
⬃
0.03% of the
sample, and those near the cutoff level are also subject to sampling
error (for an example, see Fig. 1B in reference
16). The method
cannot distinguish among the pathotypes of
E. coli
and
Shigella
spp. However, the method did distinguish among
Aeromonas
spp.,
C. jejuni
,
S. enterica
, and
C. difficile
as expected, and for the
latter three, the method detected these pathogens at levels that
were most similar to those of the GoldenGate method. The two
methods revealed moderate agreement for
C. jejuni
. The
Univer-sal Biosensor method for detecting
C. jejuni
and
C. difficile
is based
on the detection of 16S rRNA genes, and the underestimation of
these pathogens is likely the result of the complexity of the stool
samples such that even in samples from cases, the sequence-based
method yielded extremely large numbers of distinct 16S rRNA
gene sequences. The amplification of the whole sample for the
sequencing approach raises the question of whether an alternative
approach, like complete shotgun sequencing using
next-genera-tion sequencing, would detect taxa similar to those detected by the
other methods.
The agreement between methods was consistently greater in
cases than in controls. Almost certainly this observation can be
attributed to the higher concentration of a pathogen in the cases
than in the controls and to the fact that the higher the
concentra-tion the more likely a pathogen is to be detected. Quantificaconcentra-tion of
the level of pathogens in the stool may improve the ability to
accurately diagnose the cause of the diarrhea (17). This may have
particular importance as the increased levels of detection (seen in
FIG 3Agreement between methods among cases and controls for detection of pathogens. The kappa values between pairs of methods for individual pathogens are plotted. A moderate agreement between methods is marked by the dashed line (kappa⬎0.41). (A) Kappa values forC. jejuni,S. enterica, andAeromonasspp.; (B) kappa values between methods for pathotypes ofE. coliandShigellaspp.on May 16, 2020 by guest
http://jcm.asm.org/
[image:5.585.50.542.67.286.2]the Golden Gate and Universal Biosensor methods) will mean that
multiple pathogens will be detected in an increasing number of
stool samples. The proportion of hospitalized patients in Kolkata,
India, with multiple pathogens using cultures was approximately
30%, and when multiple pathogens were present, there were often
strong associations between them (18,
19). With the GEMS
reveal-ing many pathogens in control stool samples, quantitation of
pathogens may be an important diagnostic criterion.
In conclusion, our results demonstrate that traditional
culture-based methods underestimate the numbers of stool samples in
which specific enteric pathogens can be detected compared with
those by the alternative molecular methods. Not surprisingly, the
alternative methods based on detection of specific unique genes
produced the most similar results. Methods based on 16S rRNA
gene sequences had distinct limitations. However, in the absence
of a gold standard, replication and consistency between methods
become important criteria. The GoldenGate method revealed the
greatest agreement with the other methods. However,
improve-ments in terms of targeted genes and the ability to quantify the
number of pathogens present would enhance the usefulness of the
method used for diagnosis.
ACKNOWLEDGMENTS
This work was supported by the Bill and Melinda Gates Foundation (grant 42917).
[image:6.585.41.542.81.533.2]T.K.M., B.B., and I.L. are employees and shareholders of Illumina, the
TABLE 2Kappa agreement values stratified by country and case/control status
Organisma
Kappa agreement valuebfor organisms detected in:
Overall kappa value
The Gambia Mali Kenya Bangladesh Cases Controls
Aeromonas
16S surveyⴱMicro 0.1290 0.1806 ⫺0.0234 0.1014
16S surveyⴱIllumina ⫺0.0056 ⫺0.0196 0.4439 ⫺0.0231 0.1814 0.1859 0.1827
IlluminaⴱMicro 0.0735 0.0216 0.0816 0.0587
Campylobacter
16S surveyⴱMicro 0.0843 0.0060 0.1399 0.4482 0.2229 0.0356 0.1538
16S surveyⴱIllumina 0.5812 0.5722 0.5315 0.5338 0.5920 0.4846 0.5574
16S surveyⴱIbis 0.0189 ⫺0.0096 0.0229 0.0000 0.0048 0.0191 0.0106
IlluminaⴱMicro 0.0864 0.0356 0.3363 0.5493 0.3715 0.1799 0.2711
IbisⴱMicro ⫺0.0059 ⫺0.0063 0.0581 0.0354 0.1023 ⫺0.0032 0.0421
IbisⴱIllumina 0.0083 ⫺0.0115 0.0517 0.0652 0.0402 0.0125 0.0271
Salmonella
16S surveyⴱMicro 0.1500 0.1931 0.2207 ⫺0.0278 0.2245 ⫺0.0177 0.1603
16S surveyⴱIllumina 0.0279 0.5588 0.5007 ⫺0.0386 0.3103 0.0775 0.2379
16S surveyⴱIbis 0.0338 0.1563 0.0951 0.0446 0.1449 ⫺0.0041 0.0778
IlluminaⴱMicro 0.1577 0.3932 0.5903 0.5376 0.5246 0.1242 0.3691
IbisⴱMicro 0.0344 0.0625 0.0957 0.0128 0.1419 0.0252 0.0725
IbisⴱIllumina ⫺0.0062 0.4182 0.1589 ⫺0.0183 0.1870 0.0038 0.0855
Shigellaspp.
16S surveyⴱMicro 0.1080 0.0280 ⫺0.0108 0.0921 0.0057 0.0002 0.0311
16S surveyⴱIllumina 0.0361 0.0499 0.0383 0.1167 0.0004 ⫺0.019 0.0303
16S surveyⴱIbis 0.3372 0.2857 0.2192 0.077 0.2723 0.1345 0.2487
IlluminaⴱMicro 0.2519 0.1492 0.3458 0.5672 0.4646 0.1969 0.3835
IbisⴱMicro 0.1634 0.0922 0.1469 0.4129 0.2280 0.1325 0.2027
IbisⴱIllumina 0.5119 0.4904 0.5024 0.6112 0.5548 0.4790 0.5388
EPEC
IlluminaⴱMicro 0.0620 0.3155 0.4783 0.1970 0.3156 0.1573 0.2341
IbisⴱMicro 0.1858 0.2128 0.2164 0.3357 0.2778 0.1856 0.2247
IbisⴱIllumina 0.3692 0.6856 0.4991 0.2276 0.5438 0.3206 0.4278
ETEC
IlluminaⴱMicro 0.0830 0.1223 0.0520 0.0729 0.0964 0.0686 0.0811
IbisⴱMicro 0.0547 0.0732 0.0796 0.1173 0.0882 0.0637 0.0753
IbisⴱIllumina 0.5642 0.5884 0.6175 0.5696 0.5614 0.6165 0.5909
EAEC
IlluminaⴱMicro 0.0013 0.1280 0.0245 0.0216 0.0193 0.0076 0.0129
IbisⴱMicro 0.0565 0.0258 0.0439 0.0726 0.0302 0.0653 0.0514
IbisⴱIllumina 0.3064 0.3284 0.4279 0.4353 0.3523 0.3820 0.3689
aMicro, microbiology; 16S survey, 16S rRNA gene survey; Illumina, Illumina GoldenGate assay; Ibis, Ibis Universal Biosensor assay.ⴱ, pairs of methods were compared. b
Agreement: fair, 0.21 to 0.40 (underlined); moderate,⬎0.40 (bold). Cells without data indicate a zero cell count.
Lindsay et al.
on May 16, 2020 by guest
http://jcm.asm.org/
manufacturer of GoldenGate technology, one of the platforms evaluated in this study. J.H., S.M., J.D., I.Y., L.B., R.R., F.L., R.H., D.J.E., and R.S. are employees of Ibis Biosciences, the manufacturer of Universal Biosensor technology. J.P. has received funding for conference travel and accommo-dation from Illumina.
M.A., D.A., J.O., B.T., S.P., M.M.L., K.K., U.I., C.E., M.D., M.A., F.A., M.T.A., R.A., S.S., J.B.O., E.O., J.J., E.M., R.O., C.E.O., M.A.H., R.F.B., and D.S. contributed to the collection, culture, and data management; B. Lindsay, M.P., A.W.W., V.M., S.L., J.N.P., B. Liu, R.R., M.D.S., M.U., J.G.M., J.P., O.C.S., and J.P.N. performed 16S rRNA gene data collection and analysis; B.B., I.L., and T.K.M. provided GoldenGate data; J.H., S.M., J.D., I.Y., L.B., R.R., F.L., R.H., D.J.E., and R.S. provided Universal Bio-sensor data; M.P., A.W.W., V.M., K.K., M.M.L., L.S.M., D.J.E., T.K.M., R.S., M.A.H., R.F.B., J.N.P., J.G.M., D.S., O.C.S., and J.P.N. provided the study design; B. Lindsay, L.S.M., M.P., and O.C.S. performed statistical analyses; and B. Lindsay, M.P., V.M., O.C.S., and J.P.N. wrote the article. We acknowledge the contributions of Eric Mintz, Michele Parsons, and Cheryl Bopp, Division of Foodborne, Waterborne, and Environmental Diseases, U.S. Centers for Disease Control and Prevention, Atlanta, GA.
The use of trade names and commercial sources is for identification only and does not imply endorsement by the Centers for Disease Control and Prevention or the U.S. Department of Health and Human Services. The findings and conclusions in this presentation are those of the authors and do not necessarily represent those of the Centers for Disease Control and Prevention.
REFERENCES
1.Guerrant RL, Van Gilder T, Steiner TS, Thielman NM, Slutsker L, Tauxe RV, Hennessy T, Griffin PM, DuPont H, Sack RB, Tarr P, Neill M, Nachamkin I, Reller LB, Osterholm MT, Bennish ML, Pickering LK.
2001. Practice guidelines for the management of infectious diarrhea. Clin. Infect. Dis.32:331–351.
2.Zaidi AK, Macone A, Goldmann AD.1999. Impact of simple screening criteria on utilization of low-yield bacterial stool cultures in a children’s hospital. Pediatrics103:1189 –1192.
3.Liu J, Gratz J, Amour C, Kibiki G, Becker S, Janaki L, Verweij JJ, Taniuchi M, Sobuz SU, Hague R, Haverstick DM, Houpt ER.2013. A laboratory-developed TaqMan array card for simultaneous detection of 19 enteropathogens. J. Clin. Microbiol.51:472– 480.
4.Illumina.VeraCode GoldenGate genotyping assay. Illumina, San Diego, CA. http://www.illumina.com/technology/veracode_goldengate_assay.ilmn. 5.Ecker D, Sampath R, Massire C, Blyn L, Hall T, Eshoo M, Hofstadler S.
2008. Ibis T5000: a universal biosensor approach for microbiology. Nat. Rev. Microbiol.6:553–558.
6.Gill SR, Pop M, Deboy RT, Eckburg PB, Turnbaugh PJ, Samuel BS, Gordon JI, Relman DA, Fraser-Liggett CM, Nelson KE.2006. Metag-enomic analysis of the human gut distal microbiome. Science312:1355– 1359.
7.Panchalingam S, Antonio M, Hossain A, Mandomando I, Ochieng B, Oundo J, Ramamurthy T, Tamboura B, Zaidi AKM, Petri W, Houpt E,
Murray P, Prado V, Vidal R, Steele D, Strockbine N, Sansonetti P, Glass RI, Robins-Browne RM, Tauschek M, Svennerholm A, Kotloff K, Levine MM, Nataro JP.2012. Diagnostic microbiologic methods in the GEMS-1 case/control study. Clin. Infect. Dis.55(Suppl 4):S294 –S302. 8.Kotloff K, Blackwelder WC, Nasrin D, Nataro JP, Farag TH, van Eijk A,
Adegbola RA, Alonso PL, Breiman RF, Faruque ASG, Saha D, Sow SO, Sur D, Zaidi AKM, Biswas K, Panchalingam S, Clemens JD, Cohen D, Glass RI, Mintz ED, Sommerfelt H, Levine MM.2012. The global enteric multicenter study (GEMS) of diarrheal disease in infants and young chil-dren in developing countries: epidemiologic and clinical methods of the case/control study. Clin. Infect. Dis.55(Suppl 4):S232–S245.
9.Illumina.2013. GoldenGate assay workflow. Illumina, San Diego, CA.http: //res.illumina.com/documents/products/workflows/workflow_goldengate _assay.pdf.
10. Huse S, Huber J, Morrison H, Sogin M, Welch D.2007. Accuracy and quality of massively parallel DNA pyrosequencing. Genome Biol.8:R143. doi:10.1186/gb-2007-8-7-r143.
11. Ghodsi M, Liu B, Pop M.2011. DNACLUST: accurate and efficient clustering of phylogenetic marker genes. BMC Bioinformatics12:271. 12. Landis JR, Koch G.1977. The measurement of observer agreement for
categorical data. Biometrics33:159 –174.
13. Feuerman M, Miller A.2008. Relationships between statistical measures of agreement: sensitivity, specificity, and kappa. J. Eval. Clin. Pract.14:
930 –933.
14. Operario DJ, Houpt E.2011. Defining the causes of diarrhea: novel approaches. Curr. Opin. Infect. Dis.24:464 – 471.
15. Iijima Y, Tanaka S, Miki K, Kanamori S, Toyokawa M, Asari S.2007. Evaluation of colony-based examinations of diarrheagenicEscherichia coli
in stool specimens: low probability of detection because of low concentra-tions, particularly during the early stage of gastroenteritis. Diagn. Micro-biol. Infect. Dis.58:303–308.
16. Benson AK, Kelly SA, Legge R, Ma F, Low SJ, Kim J, Zhang M, Oh PL, Nehrenberg D, Hua K, Kachman SM, Moriyama EN, Walter J, Peterson DA, Pomp D.2010. Individuality in gut microbiota composition is a complex polygenic trait shaped by multiple environmental and host ge-netic factors. Proc. Natl. Acad. Sci. U. S. A.107:18933–18938.
17. Lindsay B, Ocheing JB, Ikumapayi U, Aliou T, Ahmed D, Li S, Pan-chalingam S, Levine M, Kotloff K, Rasko D, Morris C, Juma J, Fields BS, Dione M, Malle D, Becker SM, Houpt ER, Nataro JP, Sommerfelt H, Pop M, Oundo J, Antonio M, Hossain A, Tamboura B, Stine OC.
2013. Quantitative polymerase chain reaction for detection ofShigella
improves ascertainment ofShigellaburden in children with moderate to severe diarrhea in low income countries. J. Clin. Microbiol.51:1740 – 1746.
18. Nair GB, Ramamurthy T, Bhattacharya MK, Krishnan T, Ganguly S, Saha DR, Rajendran K, Manna B, Ghosh M, Okamato K, Takeda Y.
2010. Emerging trends in the etiology of enteric pathogens as evidenced from an active surveillance of hospitalized diarrhoeal patients in Kolkata, India. Gut Pathog.2:4. doi:10.1186/1757-4749-2-4.
19. Lindsay BR, Ramamurthy T, Sen Gupta S, Takeda Y, Rajendran K, Nair GB, Stine OC.2011. Diarrheagenic pathogens in polymicrobial infec-tions. Emerg. Infect. Dis.17:606 – 611.