a
Corresponding author: [email protected]
Transient Response of Low-Power ECG Recoding Amplifiers for
Use with Un-gelled Electrodes
Martin J. Burke1,a Oscar Tuohy1
1Dept. of Electronic and Electrical Engineering, Trinity College, University of Dublin, College Green, Dublin 2, Ireland.
Abstract.This paper addresses the design of the low-frequency response of a multi-stage bioelectric amplifier intended for use in the measurement of the human electrocardiogram (ECG) using high-impedance un-gelled electrodes. The response is optimised to meet the International Electrotechnical Commission 60601 standards [1,2] for electrocardiograph recorders in both the time and frequency domains. The optimum design for a three stage amplifier, having two differential stages and a differential-to-single-ended conversion stage was established in the context of low-power ambulatory ECG monitoring. The optimum configuration was found to be two differential stages with a gain of 20dB each and a differentialto singleended output stage with unity gain. The -3dB pole is placed at 0.013Hz and a zero at 0.0013Hz in the first and second stages to give an overall --3dB low cut-off frequency of 0.02Hz. In addition, the pole of the input ac coupling network was placed at 0.0013Hz in order to cancel the zero in the non-inverting front-end stage. This ensured that undershoot and recovery slope performance requirements in response to a narrow pulse of 3mV amplitude and 100ms duration were met.
1 Introduction
The nature of the low-frequency response of bioelectric amplifiers intended for use in recording the human electrocardiogram (ECG) is of the utmost importance because of the clinical significance of these recordings. Adequate magnitude and phase responses are required to prevent distortion of the ECG signal profile which can introduce changes into the waveform morphology that have serious diagnostic implications [3,4]. The nature of the distortion which results from poor low frequency response has a detrimental effect primarily on the T-wave, the S-T segment and the Q-T interval.
In recent years, miniaturisation and portability has meant that the use of ECG recorders has extended beyond the hospital clinics and wards to non-clinical scenarios such as general practice, sports medicine, physiology and even the factory floor. This increase in low-power, battery-operated equipment has meant corresponding changes in electronic instrumentation and circuit design. Trends have therefore changed in the design of the bioelectric amplifiers for ECG recording. Lower power supply voltages have tended to make amplifier front-end stages ac coupled rather than dc coupled as in the past. This is because of large electrode polarisation voltages that must be eliminated at the amplifier input so that they do not saturate the front-end stage of the amplifier. Recent trends towards un-gelled electrodes have increased the magnitude of these polarisation voltages.
AC coupling at the amplifier input also allows high gain to be maintained in the early stages of the amplifier for the preservation of the signal-to-noise ratio.
Low-power technology has significantly reduced the gain-bandwidth product of operational amplifiers among other parameters. This means that the high gain required in ECG amplifiers must usually be distributed across several stages. This in turn has led to an increase in multi-stage amplifier configurations and an associated increase in the complexity of the low frequency response. This paper investigates the issues in the design of the low-frequency response of bioelectric amplifiers intended for ECG recording using un-gelled or dry electrodes. The aim is to optimise the response to meet both time and frequency domain performance requirements for ECG recording equipment issued by international standards authorities.
2 Background
2.1 Frequency domain requirements
Early standards for ECG recorder performance were based on recommendations issued by the AHA and the IEEE in 1967 [5,6]. These standards required that the magnitude of the frequency response be within ± 0.5 dB of the mid-band gain within the frequency range 0.67Hz–150Hz. The low-frequency limit was based on a practical lowest heart rate value of 40 beats-per-minute (bpm). The phase response was required to be no greater than that corresponding to a single-pole high-pass filter having a -3dB cut-off frequency of 0.05Hz [5,6]. These magnitude and phase response requirements are illustrated in Figure 1.
More recent standards issued by both the EU and the US [1,2] require that the amplitude response of an ambulatory ECG recorder shall be within ±3 dB of the response at 5Hz, within a frequency band of 0.05Hz to at least 55Hz. A phase response requirement is not specified but the merits of a single-pole high-pass filter having a cut-off frequency of 0.05Hz are still cited as a benchmark. Instead of the phase response requirement a time-domain specification has been introduced.
Figure 1. Magnitude and phase response requirements.
2.2 Time domain requirements
The IEC 60601 most recent standards, which are now closely aligned and merged with those of ANSI, have
introduced two time-domain methods of testing ECG recorder performance. These are both shown in Figure 2. Method A was introduced in a previous IEC standard and allows a maximum baseline undershoot of 100μV in the transient response to a narrow rectangular pulse of 3mV amplitude and 100ms duration. A maximum recovery slope of 300μV/s following undershoot at the end of the pulse is allowed, as can be seen in Figure 2. The output waveform is input-referred to make it independent of amplifier gain. Method B, on the other hand, uses a triangular wave to model the QRS complex of the ECG. An isosceles triangular wave of peak amplitude of 1.5mV and a duration varying between 20ms and 200ms with a repetition rate of less than 1Hz is applied as input to the recorder. The amplitude of the peak of the triangle must maintain a variation within +0dB and -1dB (-12%) as the pulse duration is varied between 20ms and 200ms. This can be seen in Figure 2. In the studies carried out by the author, the rectangular pulse of Method A was preferred.
Method A: Rectangular Pulse
Method B: Triangular Wave
Figure 2. Transient response requirements [from 1,2]
3 Single-Ended Amplifier Stage
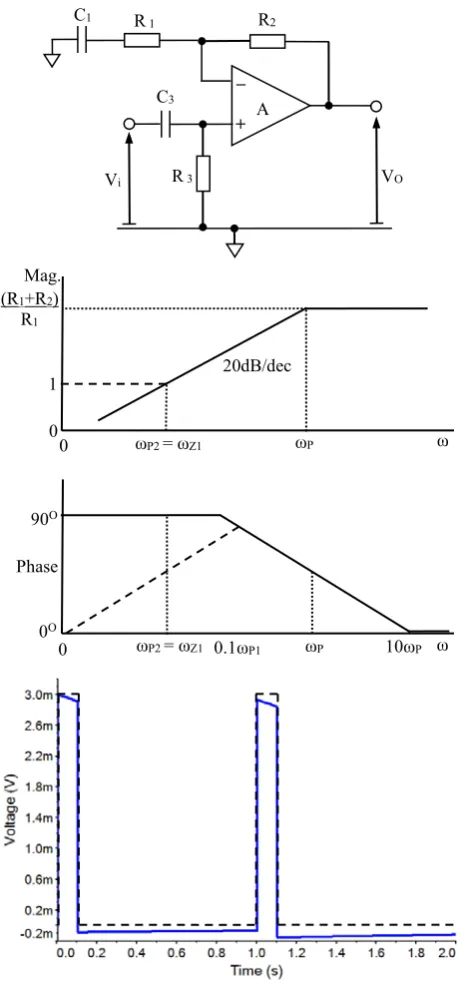
The first stage of interest is the single-ended non-inverting amplifier stage shown in Figure 3. This stage is ac coupled and therefore has a high-pass frequency response. It provides gain in the pass band and has a steady-state transfer function of the form:
) R
ωC
j 1 )( R C jω (1
R
ωC
)]j R R ( C jω [1 V V
1 1
2 1 1 i
o
3 3
3 3
(1)
electrocardiograph response: y(t) input impulse signal: x(t) max offset
(100 μV) 100ms
max slope (300 μVs-1)
3mV
si
gna
l a
m
pl
it
ude
time
time
sig
n
al
amp
li
tu
d
Bode plots of the magnitude and phase of the frequency response of this stage are shown in Figure 3. The stage has an in-band high-frequency gain AV0 = (R1+ R2)/R1. The -3dB pole in the high-pass response is located at a radian frequency of ωP1 = 1/(C1R1). An ac coupling network in the form of resistor R3 and capacitor C3 has been included at the input to ensure that dc electrode polarisation potentials do not appear at the amplifier input and cause it to saturate. If this network were omitted, the gain of this stage would level out at unity, at the location of the zero at a radian frequency ωZ1 =
1/[C1(R1+ R2)] = ωP1/AV0, as indicated by the dashed line in the magnitude characteristic of Figure 3. The zero would also have the effect of restoring the phase to 0O as
[image:3.595.57.288.270.762.2]ω 0, as shown by the dashed line in the phase characteristic of Figure 3.
Figure 3. Magnitude and phase Bode plots of 1-stage amplifier
In order to get an overall response of the form of a high-pass filter, the lower frequency pole, ωP2, of the input network is arranged to cancel the zero in the response of the feedback network by a choice of time constants such that C3R3= C1(R1+ R2).In this case the transfer function of the stage simplifies to:
1 12 1 1 1
1 i
o
R C jω 1
) R R ( C jω R C jω 1
R
ωC
j V V
3 3 (2)
This is depicted by the solid-line magnitude and phase responses in Figure 3.
The magnitude response can be expressed as:
2
1 2
1
1
P Z
i o
ω ω ω
ω
V
V (3)
The -0.5dB point in this response in absolute terms is defined as 6% below unity gain as:
94 0 1
2
1 5 0
2
1 5 0
.
ω ω ω ω
P dB . Z
dB .
(4)
This gives the relationship between the -0.5dB and -3dB points in the magnitude response as:
1 5
0.dB 2.75ωP
ω (5)
This implies that if the magnitude response is to stay within ±0.5dB of the in-band value down to a frequency of 0.67Hz, then the -3dB cut-off frequency must be below 0.25Hz. This is well above the 0.05Hz limit recommended in the performance standard, which is chosen more on the basis of minimising the low-frequency phase distortion than of obtaining a flat magnitude response.
The response of this filter in the time domain to the narrow input pulse which is defined in Figure 2 can also be seen in Figure 3. The undershoot in the response is 93μV and the recovery slope is 29μV/s which meets the requirements illustrated in Figure 2. This first-order ac-coupled stage satisfies all of the performance criteria for ECG amplifiers when it is assumed that the input signal is obtained from a voltage source having zero internal impedance. The input stage of a more practical differential recording amplifier should give at least equivalent performance in order to prevent distortion of the signal. The nature of the impedance of the source must also be taken into account since this will have a profound effect on both the steady-state and the transient responses.
+ A
C1 R1 R2
_
Vi R3 VO
C3
Mag.
0
ωP ω
20dB/dec (R1+R2)
R1
0
0O
Phase 90O
0.1ωP1 ωP 10ωP ω
0 1
ωP2 = ωZ1
4 Multi-stage amplifiers
4.1 Two-stage differential amplifier
The schematic diagram of a simple differential amplifier is shown in Figure 4. This is essentially the differential version of the single-ended amplifier stage of Figure 3. This has a single cross-coupled input stage with differential input voltages V1 and V2. This is followed by a differential-to-single-ended conversion stage providing the output voltage, VO. The A and B designated components will nominally have the same values.
Figure 4. Schematic Diagram of 2-Stage Differential Amplifier
The steady-state transfer function of this amplifier structure is given for a differential input V1– V2 as:
) R
ωC
j 1 )( R C jω (1
R
ωC
)]j R 2 R ( C jω [1 R R V V
V
3 3 1
1
3 3 2 1 1 4
5 2 1
o
(6)
Very often R5 = R4 so that the output stage has unity gain, to maximize the CMRR. In this case the in-band differential gain of this stage isAV = (R1+ 2R2)/R1. The -3dB cut-off frequency is again located at ωP1 = 1/(C1R1) while the zero is located at ωZ1 = 1/[C1(R1+ 2R2)] =
ωP1/AV. The pole due to the input network, which is identical at each input terminal, is again located at a frequency ωP2 = 1/(C3R3). The same pole-zero cancellation that was implemented in the single stage amplifier can be replicated in the differential amplifier by choosing C3R3 = C1(R1 + 2R2). The steady-state magnitude and phase responses and the time-domain pulse response are identical to those of the single-ended amplifier stage illustrated in Figure 3 if no source impedance is taken into account.
4.2 Three-stage differential amplifier
In the low-power semiconductor technology associated with ambulatory monitoring of the ECG and the use of dry electrodes, op-amps generally have very limited gain-bandwidth product. It is consequently rarely possible to implement the overall gain needed to amplify a recorded ECG signal to the desired level in a single differential stage. The gain must therefore be distributed between two differential stages with a final output differential-to-single-ended conversion stage. This leads to the 3-stage differential amplifier shown in Figure 5. This has a high-pass input stage and a differential-to-single-ended output stage identical to the two stage amplifier. There is a second differential stage which is dc coupled to the first so that the output dc bias potentials of the first stage will carry through to the second stage. The ac coupling of the first stage is sufficient to block any electrode polarisation potentials from the amplifier input.
[image:4.595.60.283.220.421.2]The steady state transfer function of this three stage amplifier is given as:
Figure 5. Schematic Diagram of a 3-stage Differential Amplifier for ECG Recording.
+ A2
R2B
R1
C1
R4B R5B
+ A3
R3B
C3B
V2
+ A1
R2A
R4A R5A
C3A
R3A
V1
VO
VO +
A4
R4B R5B
+ A5
R6B
R3B C3B
V2
R7 C7
R4A R5A
C3A
R3A V1
+ A3
R6A
R2B +
A1
R2A
R1 C1
) R
ωC
j 1 )( R C jω (1 ) R C jω (1
R
ωC
)]j R 2 R ( C jω )][1 R 2 R ( C jω [1
R R V V
V
3 3 7
7 1
1
3 3 6 7 7 2
1 1
4 5 2 1
o
(5)
where, R6, R7 and C7 are the components in the second differential stage. It can be seen that the dc coupling in the second differential stage adds an additional pole and zero to the transfer function. If the output stage has unity gain and the overall gain is distributed equally between the two differential stages then the poles and zeros of both of these stages are identical so that ωP1 = 1/(C1R1)
= ωP3 = 1/(C7R7) and ωZ1 = 1/[C1(R1+ 2R2)] = ωP1/AV1
= ωZ2 = 1/[C7(R7 + 2R6)] = ωP3/AV2. In an ECG recording amplifier the gains of the individual differential stages would be in the region of 20dB so as to give an overall gain for the three-stage amplifier of 40dB. If the intention, in the first instance, is to maintain the -3dB frequency of the three-stage amplifier at the same location as for the two-stage amplifier it can be shown that:
3dB1 -3dB1
-dB
ω
.
ω
ω
3 22
1
0
65
(6)where ω-3dB2 is the -3dB frequency of a single differential stage in the three-stage amplifier having two identical differential stages and ω-3dB1 is the -3dB frequency of a single-pole differential amplifier, and is taken as the overall -3dB frequency of the three-stage amplifier. If f-3dB1 = 0.05Hz then f-3dB2 = 0.03Hz to obtain the desired overall response. If the values of components are chosen accordingly the magnitude, phase and pulse responses of the three stage amplifier will be almost identical to those of Figure 3 and will meet all of the performance requirements when no source impedance is taken into account.
5 Effect of Electrode Impedance
5.1 Electrode Electrical Model
The purpose of the ECG recording amplifier is to provide a signal which accurately represents the electrical potential existing on the surface of the patient’s body. Therefore the amplifier cannot be considered in isolation. The impedance of the electrodes used to provide the necessary interface between the patient’s skin and the amplifier must be treated as an intrinsic part of the recording system. The IEC 60601 standard specifies a simple electrode model of a single parallel C-R network with C = 47nF and C-R = 51kΩ. This is inserted in series with each amplifier input when injecting signals from a test signal generator. This simplified model does provide an accurate reflection of all of the effects that are present when using a surface electrode. In particular, it does not accurately model the un-gelled electrodes that are becoming more popular in portable recording equipment. The IEC 60601 standard also recommends a minimum amplifier input impedance of 10MΩ.
Electrode
E34
R3
R4
Electrolyte
R1
R2
E23
C2
Stratum Corneum/ Epidermis
Sweat/
C4
Dermis Subcutaneous Layer
Deeper Tissues Electrode
E34
R3
R4
Electrolyte
R1
R2
E23
C2
Stratum Corneum/ Epidermis
Sweat/
C4
Dermis Subcutaneous Layer
[image:5.595.354.497.72.226.2]Deeper Tissues
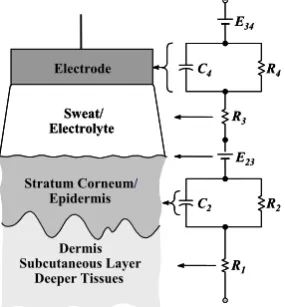
Figure 6 An Electrical Model of an Un-gelled ECG Electrode
[image:5.595.310.537.456.571.2]Previous work has shown that surface bio-electrodes are modelled more accurately by the network shown in Figure 6. This model consists of two parallel C-R networks as well as a series resistance. The dc voltages represent polarisation potentials that will be blocked from the input of the amplifier by the use of ac coupling. Studies have yielded the values of the model components for a number of un-gelled or dry ECG recording electrodes [7]. For this study component values were selected that represent the extremes of the associated time constants involved. Electrode models used include: a single C-R network as specified in the IEC 60601 standard, a double C-R model with component values obtained from stainless-steel contact electrodes, and two double C-R models representative of conducting rubber electrodes. These are listed in Table 1.
Table 1: Properties of Electrode Models
Electrode Model
Single C-R (IEC)
Stainless Steel 2-CR
Conductive Rubber #1
Conductive Rubber #2 R1+R3(kΩ) NA 5 12 5
C2(μF) 0.047 878 220 432
R2(kΩ) 51 256 267 72
2(s) 0.002 225 59 31
C4(μF) NA 56 23 6.9
R4(kΩ) NA 380 380 158
4(s) NA 21 8.6 1.1
5.2 Transient Response of Electrode & Amplifier
Table 2: Pulse Response, 2-Stage Amplifier f-3dB=0.05Hz
Electrode Model
Amplifier R3 (MΩ)
1 10 100 1000
Single C-R
Undershoot (μV) 157 164 165 165
Recov. Slope (μVs-1) 174 188 200 200
Stainless Steel
Undershoot (μV) 187 166 164 170
Recov. Slope (μVs-1) 233 205 203 203
Conductive Rubber #1
Undershoot (μV) 554 206 168 164
Recov. Slope (μVs-1) 3400 498 213 185
Conductive Rubber #2
Undershoot (μV) 486 199 173 165
Recov. Slope (μVs-1)
2000 449 235 185
value of the input blocking capacitor C3 when the value of the input resistance R3 was altered in order to keep the time constant C3R3 fixed to match the time constant C1(R1+ 2R2). The values of the undershoot and recovery slope in response to the pulse of Figure 2 are given in Table 2. All values are referred back to the amplifier input for direct comparison with the input pulse. Values in bold indicate a violation of the requirements of the IEC 60601 performance specification. It can be seen from the table that the undershoot requirement of less than 100μV is violated by all electrode models for all values of amplifier input impedance. The recovery slope requirement of 300μVs-1 is satisfied by all electrode models for an input impedance of 100MΩ or greater but is violated by the conductive rubber electrodes for values of impedance below this.
[image:6.595.54.289.480.611.2]The same set of tests was carried out on the 3-stage amplifier of Figure 5, with the overall -3dB low cut-off frequency f-3dB1 = 0.05Hz by choosing f-3dB2 = 0.03Hz for each of the differential stages considered individually. The results of these tests are shown in Table 3.
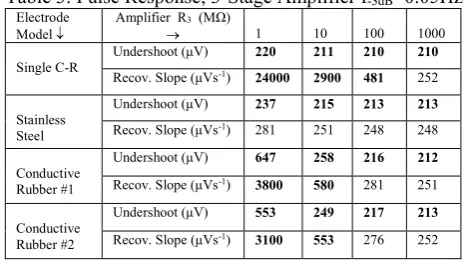
Table 3: Pulse Response, 3-Stage Amplifier f-3dB=0.05Hz
Electrode Model
Amplifier R3 (MΩ)
1 10 100 1000
Single C-R
Undershoot (μV) 220 211 210 210
Recov. Slope (μVs-1) 24000 2900 481 252
Stainless Steel
Undershoot (μV) 237 215 213 213
Recov. Slope (μVs-1) 281 251 248 248
Conductive Rubber #1
Undershoot (μV) 647 258 216 212
Recov. Slope (μVs-1)
3800 580 281 251
Conductive Rubber #2
Undershoot (μV) 553 249 217 213
Recov. Slope (μVs-1) 3100 553 276 252
A similar pattern of violations of the performance specification exist as for the 2-stage amplifier. All electrode models lead to a violation of the undershoot requirement for all values of amplifier input impedance. The recovery slope requirement is violated by the conductive rubber electrodes for an amplifier input impedance below 100MΩ, and by the single C-R model for less than 1GΩ. Several further series of tests were subsequently carried out on the 3-stage amplifier while progressively lowering the -3dB low cut-off frequency. Table 4 shows the results of the tests for f-3dB1 = 0.02Hz with f-3dB2 = 0.013Hz. It can be seen in this case that all of the electrode models meet both performance limits for an amplifier input impedance of 100MΩ or greater. This
Table 4: Pulse Response 3-Stage Amplifier f-3dB=0.02Hz
Electrode Model
Amplifier R3 (MΩ)
1 10 100 1000
Single C-R
Undershoot (μV) 256 106 90 88 Recov. Slope (μVs-1) 652 147 100 94
Stainless Steel
Undershoot (μV) 106 84 81 80 Recov. Slope (μVs-1) 122 94 90 90
Conductive Rubber #1
Undershoot (μV) 537 129 85 81 Recov. Slope (μVs-1) 3400 390 118 91
Conductive Rubber #2
Undershoot (μV) 399 122 82 79
Recov. Slope (μVs-1)
2500 321 109 88
was identified as the highest value of the low cut-off frequency for which all electrode models would meet both performance requirements and was only possible with an input impedance of 100MΩ.
5 Conclusion
The existing IEC 60601 performance specification for ECG amplifiers suggests that a -3dB frequency of 0.05Hz and an input impedance of 10MΩ will meet the performance requirements of a maximum of 100μV undershoot and a recovery slope of 300μVs-1 in the transient response to a narrow 3mV-100ms pulse. The authors have shown experimentally for a number of un-gelled electrode models that an amplifier needs to have a -3dB low cut-off frequency of ≤0.02Hz and an input impedance of ≥100MΩ in order to meet these specifications. Future work will be carried out to establish the amplifier requirements analytically for un-gelled electrode models as the latter are becoming increasingly more common in both clinical and ambulatory ECG measurement scenarios.
References
1. International Electrotechnical Commission, Medical Electrical Equipment Std. 2-25. IEC 60601, 2011. 2. International Electrotechnical Commission, Medical
Electrical Equipment Std. 2-47. IEC 60601, 2012. 3. A. S. Berson and H. V. Pipberger, ‘The
Low-Frequency Response of Electrocardiographs, A Frequent Source of Recording Errors’; Amer. Heart J.; 71, 779-789, 1966.
4. D. Tayler and R. Vincent, ‘Signal distortion in the electrocardiogram due to inadequate phase response’, IEEE Trans. Biomed. Eng.; 30, 352-356, 1983.
5. C. E. Kossmann et al., ‘Recommendations for standardization of leads and of specifications for instruments in electrocardiograpy and vectorcardiography.; Circulation, 35, 583–602, 1967.
6. H. V. Pipberger et al., ‘Recommendations for standardization of instruments in electrocardiography and vectorcardiograhy, IEEE Trans Biomed. Eng.;
14, 60-68, 1967.