Uncertainty Modeling of Radiological Risk using
Probability and Possibility Methods
Tazid Ali
Dept. of Mathematics Dibrugarh University Dibrugarh-786004, India.
Hrishikesh Boruah
Dept. of Mathematics Dibrugarh University Dibrugarh-786004, India.
Palash Dutta
Dept. of Mathematics Dibrugarh University Dibrugarh-786004, India.
ABSTRACT
Uncertainty is inherent in almost all aspects of our life. We usually ignore uncertainty to avoid complexity. However solutions so obtained are quite far from the reality and ignoring uncertainty may lead to over (under) estimation. So we need to quantify the uncertainty so as to be aware of the risk involved in any decision making process. Uncertainties can be modeled and analyzed using different theories, viz. Probability theory, Possibility theory, Evidence theory etc. Modeling of an uncertain parameter depends on the nature of the information available. In this paper we have considered uncertainty quantification of parameters in the case of radiological risk assessment. Radiological Risk means, risk associated with the release of radionuclides when radioactive materials are released into the environment. There are various pathways through which radionucliodes can reach human being namely inhalation, ingestion through drinking water and through contaminate food. The main aim of risk assessment is to determine the potential detriment to human health from exposure to a substance or activity that under plausible circumstances can cause to human health. We have analyzed the propagation of the risk both in terms of probability and possibility theory. One advanced method of probabilistic risk assessment (PRAs),viz. P-box method is discussed in this paper. A case study is also carried out with this method and compared with the results taking the parameters of the input distribution of the model as Fuzzy number.
Keywords
Fuzzy number, Probability-box, Probability bounds analysis, Uncertainty, Variability,.
1. INTRODUCTION
Uncertainty analysis is a systematic study in which “a neighborhood of alternative assumptions is selected and the corresponding interval of inferences is identified” [2]. Uncertainty plays a critical role in the analysis for a wide and diverse set of fields. Ideals and concepts of uncertainty have long been associated with gambling and games. The Greek in the 4th century BC were the first recorded civilization to have considered uncertainty. There are two kinds of uncertainty. One kind arises as variability (or Aleatory uncertainty) resulting from inherent variability, natural stochasticity, environmental or structural variation across space or through time, manufacturing or genetic heterogeneity among components or individuals, and variety of other sources of randomness. It is also called randomness, Stochastic Uncertainty, objective Uncertainty, dissonance, or irreducible Uncertainty. The standard representation of variability is the probability distribution function. The other kind called Epistemic Uncertainty is defined as uncertainty which arises
from incompleteness of knowledge about the world. Sources of epistemic Uncertainty include measurement uncertainty, small sample size, detection limits and data censoring, ignorance about the details of the physical mechanisms and processes involved and other imperfection in scientific understanding.
These two kinds of Uncertainty can propagate through various mathematical expressions with different calculation method. Probability Bounds Analysis (PBA) ([4], [6]) is related to one of these methods. It is a combination of probability theory and Interval Analysis. Probability Theory is used to propagate Aleatory Uncertainty (or variability) and Interval Analysis is used to propagate Epistemic Uncertainty. Probabilistic approaches characterize the uncertainty in the parameter by a probability distribution.
If the uncertainty consists purely of variability, we don’t know which particular value will come up in a random selection, but we know how likely each value is. This uncertainty is usually represented by an interval. Interval approach represents with an interval having lower bounds and upper bounds. Probability bounds analysis allows one to obtain fully rigorous results even when the empirical information is very poor. The idea of bounding probability has a very long tradition in probability theory. The uncertainty is characterized by a probability distribution, or by a p-box in the case of the probability bounds approach. P-box arises from probability distribution when there is uncertainty about the values of the defining parameters (mean, standard deviation etc.).
If the input variables of the risk assessment model consist variability and uncertainties, two interpretations are generally proposed for the distribution of the input variable. First, uncertainty regarding variability may be viewed in terms of probability regarding frequencies. Secondly variability is described by frequency distributions, and that uncertainty in general, including sampling error, measurement error, and estimates based upon judgment, is described by probability distribution.
Exposure Pathways:
Radioactive materials can flow accidently or intentionally. Accidental releases have occurred many times at commercial nuclear power plants and nuclear waste disposal sites. When radioactive materials are released in to the environment, radio nuclides will be moved into the body by inhalation and ingestion, which cause internal exposure.
An exposure pathway is any route that a chemical may travel from an environmental source to a receptor. An exposure pathway has five main parts [5]:
A chemical source
A release mechanism(e.g., leaking, leaching, wind erosion)
A transport and/or exposure medium(e.g., air, water, soil, sediment, food),
An exposure point with receptors present or potentially present(actual location where exposure is possible),and
A route of entry (inhalation, ingestion, dermal contact).
A complete exposure pathway is one that has no functional barrier that prevents an exposure. The pathway may be completed (i) by the chemical moving from the source to the receptor or (ii) by the receptor moving to the source. In this case study we used the ingestion path way only.
2. PROBABILITY BOX (P-BOX)
METHOD:
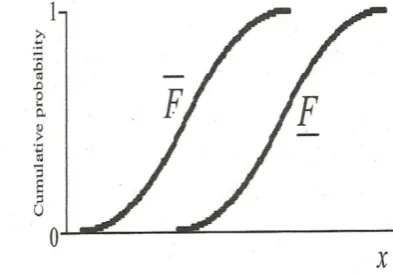
If the cumulative distribution functions for some variable lies on or between two monotonic curves, then these curves form a box can be called a probability box or p-box for that variable. A real-valued random variable is characterized by its distribution function, which is a monotonically increasing function from the real numbers into the interval [0, 1] such that the value of the function at negative infinity is zero and the value of the function at positive infinity is one. A probability box or “p-box” consists of a pair of such functions that are used to circumscribe an imprecisely known distribution function .
Suppose and are nondecreasing functions from the real line into [0, 1] and for all . Let
denote the set of all nondecreasing functions F from reals into [0, 1] such that . When the function and circumscribe an imprecisely known probability distribution, we call , specified by the pair of functions, a “Probability box” or “P-box” for that distribution. This means that , if is a P-box for a random variable whose distribution is unknown except that it is within the P-box ,then is a lower bound on
which is the (imprecisely known) probability that the random variable is smaller than . Likewise, is an upper bound on the same probability [1]. In the probability box , the gap between and reflects the incomplete nature of the knowledge, or in other words it gives the amount of epistemic uncertainty.
[image:2.595.320.517.82.219.2]
Fig. 1: p-box with upper and lower bounds
The idea of p-boxes is that the output p-box will contain all possible output distributions that could result from the input distributions, assuming the distributions of the random quantities actually lie in their respective p-boxes. We can use a p-box to circumscribe the uncertainty about a probability distribution in the same way that an ordinary interval is used to circumscribe uncertainty about a scalar number. If the probability distribution is completely specified, these bounds are coincident. A p-box represents both incertitude and variability at the same time.
There are two kinds of p-box. One is parametic p-box and other is nonparametric p-box. For parametic models where the distribution is specified, but the parameters of the model are described by intervals. Such type of p-box is called parametric p-box. But some p-box does not need a large amount of information. Such types of p-box can be constructed based on namely minimum, maximum, mean, median, mode, variance, percentile etc. This type of p-box is called nonparametric p-box.
Probability boxes can be used wherever a probability distribution can be used. P-boxes can be freely combined with scalars, interval and probability distribution in mathematical expression. It is not needed whether a variable is precisely specified distribution or only bounds on possibility distribution. Advantages of P-box are that there is a method for combining p-boxes for different random quantities without assuming anything about the dependence between random quantities and they are useful tools for risk and sensitivity analysis.
3. A CASE STUDY ON RADIOLOGICAL
RISK
OF
THE
RADIONUCLIDE
TRITIATED WATER (HTO)
We have considered a case of Radiological Risk due to HTO through the pathways of ingestion and inhalation. The uncertain parameters of the risk model are food intake, food activity, air intake, air activity, water intake and water
4. RESULTS AND DISCUSSIONS
We have considered the following models for the risk assessment
Risk due to ingestion of contaminated food :
Table 1: Intake of food, water and air, activity of food, water, air for the radionuclide HTO
Intake of food item (Kg/Yr)
Food item Values Representation
Minimum Most likely Maximum
Fish 12 15 16 P-box/ Fuzzy
Activity of radionuclide HTO in food item (Bq/Kg)
Fish 1.00E+02 3.60E+02 10.00E+02 P-box/ Fuzzy
Air Intake (m3/yr)
7300 8900 9850 P-box/ Fuzzy
Air Activity (Bq/m3) for radionuclide HTO
0.35 12 120 P-box/Fuzzy
Water Intake (L/Yr)
800 1100 1500 P-box/ Fuzzy
Water Activity(Bq/L) for the radionuclide HTO
20 90 200 P-box/Fuzzy
Risk factor (/Bq) for HTO of food item(fish)
1.20e-12
Risk factor (/Bq) for HTO of water
9.44e-13
Risk factor (/Bq) for HTO of air
1.04e-12
activity. For this case study, we consider some hypothetical data. Suppose the data are available in terms of Minimum, Most likely and Maximum values as shown in Table 1 below. Using this data, we calculate the radiological risk for the radionuclide HTO by P-box and Fuzzy set method.
Since nothing is known about the nature of the parameters, we can model them both as probabilistic and non-probabilistic. In the probabilistic case, the standard way of modeling such a parameter is a p-box, where the most likely value may be considered either as mean or mode or median. In this case we have considered the most likely value as mean. In such a situation the representation is having both aleatory and epistemic uncertainty. In the non-probabilistic case, the standard way of modeling the parameter with that information is a triangular fuzzy number with core as the most likely value. This representation has only epistemic uncertainty.
Here we have used the Risk Calc Software [3] for calculation.
Risk due to ingestion of water:
Risk(/Yr) = water activity(Bq/L) × water intake (L/Yr) × Risk factor(/Bq).
Risk due to air intake:
Risk(/Yr) = air activity(Bq/m3) × air intake (m3/Yr) × Risk
factor(/Bq)
Fig. 2(a), 3(a) and 4(a) give respectively the risk calculated for ingestion of food, water and air intake using p-box approach. Similarly 2(b), 3(b) and 4(b) respectively give the risk calculated for ingestion of food, water and air intake using Fuzzy set method.
Using the p-box approach, the total risk due to HTO through the three pathways is depicted in Fig.5(a). Fig. 5(b) gives the same using Fuzzy set method. The range of the risk is the interval [1.92012e-08, 1.53168e-06] in both the cases. The Fuzzy set method shows that the total risks is in and around
2.11008e-07, whereas the p-box method gives the same as an
interval [0.0000001, 0.0000003].
Risk
Fig.2(a) Risk due to contaminant fish(using P-Box).
(range=[1.44e-09,1.92e-08], mean=[5.6321509e-09,7.327849e-09], variance=[0,6.9901431e-17])
0 1e-08 2e-08
[image:3.595.104.491.91.384.2] [image:3.595.354.496.517.638.2]
Risk
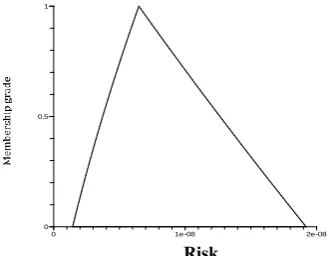
Fig.2(b) Risk due to contaminant fish(using Fuzzy set)
[ 1.44e-09, 6.479999e-09, 1.92e-08]
Risk
Fig.3(a) Risk due to ingestion of water( using P-box)
(range=[1.5104e-08,2.832e-07],
mean=[6.4760884e-08,0.0000002], variance=[0,1.7239818e-14])
Risk
Fig.3(b) Risk due to ingestion of water( using Fuzzy)
[ 1.5104e-08, 9.3456e-08, 2.832e-07]
Risk
Fig.4(a) Risk due to inhalation of air ( using P-box)
(range=[2.6572e-09,1.22928e-06], mean=[6.5591003e-08,0.0000002],
variance=[0,1.6508817e-13])
Risk
Fig.4(b) Risk due to inhalation of air ( using Fuzzy)
[ 2.6572e-09, 1.11072e-07, 1.22928e-06]
Total risk for the radionuclide HTO
= Risk from food ingestion + Risk from water+ Risk from air intake
Risk
Fig.5(a) Total risk(using P-box)
Range = [1.92012e-08,1.53168e-06] Mean = [0.0000001,0.0000003], Variance = [0,2.9808502e-13])
Risk
Fig.5(b) Total risk(using Fuzzy)
[ 1.92012e-08, 2.11008e-07, 1.53168e-06]
0 1e-08 2e-08
0 0.5 1
0 1e-07 2e-07 3e-07
0 0.5 1
0 1e-07 2e-07 3e-07
0 0.5 1
0 1e-06 2e-06
0 0.5 1
0 1e-06 2e-06
0 0.5 1
0 1e-06 2e-06
0 0.5 1
0 1e-06 2e-06
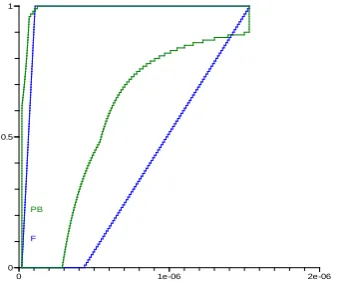
[image:4.595.75.508.67.749.2] [image:4.595.66.234.73.201.2] [image:4.595.353.509.130.263.2] [image:4.595.348.506.360.501.2] [image:4.595.351.508.567.710.2]The Fuzzy set of Fig. 5(b) is expressed in terms of possibility measure and necessity measure to express the uncertainty as lower and upper probability. The variance of the new structure obtained lies in the interval [0, 3.6800391042e-13] and the mean lies in the interval [9.10760459e-08,0.00000087]. To compare this with the p-box of Fig. 5(a), we superimposition both as given in Fig. 6. The blue figure indicates the total risk using Fuzzy Set Theory and the green figure indicates the total risk using P-Box Method. If we use variance as a measure of uncertainty, then we observed that the uncertainty in the p-box structure is less than that of the fuzzy set structure. Considering any fractile, we get an interval which gives the range of risk at that fractile. For any fractile less than 85, the range of risk is larger for fuzzy set, whereas for a fractile greater than 85 the range of risk is larger for p-box.
Fig.6 Comparison of total risk (using P-box and Fuzzy set) The objective of the uncertainty analysis is to quantify uncertainty in model output. Quantification of uncertainty helps in effective uncertainty management and increases confidence in the results. Many methods are available to propagate the uncertainty. Here, we compare risk for the radionuclide HTO in different path ways, using the Probability Box and Fuzzy Set method
5. ACKNOWLEDGEMENT
The authors would like to express their gratitude to the funding Agency Board of Research in Nuclear Sciences, Department of Atomic Energy, Govt. of India, for providing financial support under a Research Project.
6. REFERENCES
[1] Ferson Scott, Kreinovich, Vladik, Ginzburg, Lev, Myers, Davis S. and Sentz, Kari. (2003): Constructing Probability Boxes and Dempster-Shafer Structures.SAND2002-4015 Unlimited Release, Printed January.
[2] Ferson, S. and Tucker. W.Troy (2005): Sensitivity analysis using probability bounding. Elsevier Ltd [3] Ferson, S.(2002) : RAMAS Risk Calc 4.0
Software:RiskAssessment with Uncertain Numbers. Lewis Publishers, Boca Raton, Florida
[4] Karanki Durga Rao, Kushwaha Hari Shankar, Verma Ajit Kumar, and Ajit Srividya (2009): Uncertainty Analysis Based on Probability Bounds (P-Box) Approach in Probabilistic Safety Assessment .Risk Analysis, Vol. 29, No. 5, DOI: 10.1111
[5] Rao M.N, Rao H.V.N,(2003): Air pollution, Tata McGraw- Hill publishing Company Limited.
[6] Tucker W. Troy and Ferson Scott (2003):.Probability bounds analysis in environmental risk assessments .Applied Biomathematics Setauket, New York 11733 [7] Zadeh L.A. (1965). Fuzzy sets, Information Control, 8,
338-353.
0 1e-06 2e-06
0 0.5 1
F