Data mining, Classification and Clustering with
Morphological features of Microbes
Chayadevi ML
Department of ISE, JSSATE, Bangalore, VTU, Belgaum, Karnataka, India
Raju GT
Phd, Department of CSE, RNSIT, Bangalore VTU, Belgaum, Karnataka, India
ABSTRACT
The idiosyncrasies of the medical profession makes medical image mining a challenge. Image mining deals with the extraction of implicit knowledge, image data relationship, or other patterns not explicitly stored in the images. It is very difficult to determine the exact number of microorganisms under the microscope in the presence of a human expert in conventional methods. An automated tool for fast recognition of microbes is needed to examine the medical data before it expires. Digital image processing is an integral part of microscopy. Automated color image segmentation for bacterial image is proposed to classify the bacteria into two broad categories of gram images. Edge detection algorithm with 8 neighbor-connectivity contour is used. Bacterial morphological, geometric features extracted from microscopy images are used for classification and clustering. The potential and distinguished features are extracted from each bacterial cell. Experimental results with self organizing map shows that the bacterial cluster patterns obtained are better than the statistical approach.
Keywords
Data mining, Bacterial classification, Cluster performance, SOM, k-means.
1.
INTRODUCTION
Data Mining (DM) is the science of finding new interesting patterns and relationship in huge amount of data. Because of its popularity in other areas it is highly used in knowledge discovery in databases, medicine and health sector. The huge size of population along with globalization, speed of disease outbreaks and the huge amount of electronic data necessitates the data mining. The term bioinformatics was coined by Paulien Hogeweg and Ben Hesper in 1978 for the study of informatics processes in biotic systems [1]. The primary goal of bioinformatics is to increase the understanding of biological processes. Biomedical informatics is ultimately aimed at organizing, storing and processing information on molecular and cellular processes, tissues and organs, individuals, population and society to support the definition of suitable decision making strategies in health care.
The key challenge in the DM is the extraction of meaningful information, patterns from large datasets, especially in the field of bioinformatics research. Image is associated with bioinformatics research. Huge progresses in image acquisition and storage technologies have led to implausible growth in very large and detailed image data bases. Image mining is one of the great challenges of data mining which connects image processing with data mining. Image mining helps in extracting the inherent, hidden, embedded knowledge, relationship between the image data. The Challenging task in image processing is the knowledge cannot be transferred from one domain to other since image processing is domain specific. Knowledge indicates data classification, clustering or prediction. Bioinformatics is ultimately aimed at organizing, storing and processing information on molecular and cellular
processes, tissues and organs, individuals, population and society to support the definition of suitable decision making strategies in health care [2]. The qualitative and quantitative microscopy is fundamental in the study of microbial ecology for medical treatment. There are 2 existing methods to detect bacteria as per the medical association namely: Viable micro organisms counting method and Microscopic counting method. Both the methods have disadvantages. Firstly, Viable microorganism counting method needs specially designed equipments and it does not recognize and count all types of bacteria and it takes long time, very expensive and weaker section of the society cannot afford it. Secondly, microorganism counting method manually under a microscope lacks accuracy as it depends on field of microscope, lens, resolution and more importantly expert doctor should analyze the entire procedure as it is very laborious and tedious process.
Bacteria are basically colorless and can only be seen under microscope, and they are unicellular. Stains have been applied on the cultured bacteria to identify them under microscope. The size of bacteria is in millionth part of a meter. The growth of bacteria is exponential. The usual bacterial detection and identification methods include analysis of morphological, physiological, biochemical and genetic data. There exists different types of bacteria with different sizes and shapes like rod, spiral, and sphere, even they form chain or cluster like colonies during the growth. Proposed bacterial image color segmentation to classify the bacterial images Gram positive and Gram negative and. 8-connectivtity contour edge detection algorithm has been discussed in this paper. Combined advanced morphology, shape detection and bacterial particle analysis are used to extract bacterial morphological features like area, perimeter, major and minor axis, compactness, circularity, eccentricity, tortuosity from digital bacterial microscopy images for bacterial shape detection. Further, our proposed methods are invariant for color, shape and geometrical transformations. The statistical and neural network approaches for cluster evaluation and cluster performance compared.
2.
RELATED WORK
microscopic images to classify Bacilli bacteria. Riries Rulaningtya et al [7] addressed the automatic classification of tuberculosis bacteria with neural networks. S.Prabakar et al [8] discussed the development of image processing scheme for bacterial classification based on optimal discriminate feature. Computerized software machines like MB-Bact, ELISA [9] are used to detect particular type of bacteria but more expensive for weaker section. These above mentioned methods used non overlapping bacterial image for classification and some methods are applied only for bacillus bacteria. These techniques are applied to specific problem which is confined to the domain. Results obtained are more accurate than manual methods and faster than viable microorganism counting method.
3.
METHODOLOGY
[image:2.595.317.544.126.339.2]Bacterial primary identification involves 3 tests namely morphology, growth in presence or absence of air, growth on various types of culture media, catalase and oxidase tests. In conventional methods, 50 to 100 ml sample of sputum, blood or urine is placed on glass slide and stained with stains like Gram stain (Gram positive or Gram negative) for ordinary bacteria, Z.N stain for TB bacteria, Leishman Stain for Blood samples etc.,for identification of bacteria. Gram refers to Hans Christian Gram, the inventor of Gram staining. Conventional methods (microscopic reading) employed for microorganism detection is time consuming, very tedious, subject to poor specificity and requires highly trained personnel. Digital images of the bacteria are captured through a CCD camera which is mounted on top of microscope. Microscopic study of microbes staining reveals the shape, cell structure, with intracellular spores, cell growth etc.
Fig 1: Gram Staining Procedure for Bacteria
A primary stain, Crystal violet is applied on the glass smear to heat the bacterial culture. Gram’s Iodine, a mordant is added to bind the crystal violet in the cell. All the bacteria remain purple or blue in this stage. Decolorization is done using alcohol or acetone. Gram negative bacteria decolorize due to thinner cell membrane but stain remains constant in Gram positive bacteria. Counter staining is done with Safranin or Carbol fuchsin. Gram positive bacterial remains constant with purple or blue color and Gram negative bacteria accomplishes pink or red color due to counter staining. The staining procedure is shown in Figure1. Gram positive bacteria have thick cell wall made of peptidoglycan which is 50-90% of cell envelope and retains the crystal violet color. Gram negative bacteria have thinner cell wall which is 10% of cell envelope,
looses the stain color when decolorized, and hence appears pink or red with safranin counter staining. Figure 3 and Figure 4 shows Gram positive bacteria and Gram negative bacteria. Figure 2 shows the sample images of the different bacteria.
Fig 2: Images of the different bacteria
Fig 3: Gram Positive bacterial images
Fig 4: Gram Negative Bacterial images
Bacteria are basically colorless. Background color is represented by stain color and the usual shapes of bacteria are spiral, rod shaped, and circular. Rod shaped bacteria are called Bacillli, Round shaped are called Cocci and the kidney shaped curved bacteria are Vibrio. Microbes are 0.1-0.5 micron in breadth and 1-4 micron in length. They are identified by their shape. Bacteria develop in 4 phases, Lag phase, Exponential or Log phase, Stationary phase, and the Death phase. The total number of bacteria per unit time is directly proportional to the population of bacteria. It doubles and increases in each consecutive period if the growth is not limited. L represents the log numbers. The slope of the line with L versus T indicates the specific growth rate of the microbes.
4.
MICROBES DETECTION
The bacterial images are classified as Gram positive and Gram negative bacteria and the respective images are stored separately. Gram positive has blue or purple color and Gram negative image has pink or red color. Figure 5 and Figure 6 shows color pane extraction of R, G, B and classified as Gram positive or negative using color histograms thresholding. Separate image data repository is created for Gram positive and negative images after classification. This Bacterial image database has to be pre-processed for eliminating blur, irregular and noisy images. Grayscale morphology functions are used to filter or smooth the pixel intensities of an image. Using grayscale morphology noise has been filtered, uneven background corrected, and gray-level feature extracted. The gray-level morphology functions are applied to gray-level images. These functions smooth gradually varying patterns and increase the contrast in boundary areas. Gray-level morphology functions used are Erosion, Dilation, Opening, Closing, Proper-opening, Proper-closing, Auto-median.
[image:2.595.56.270.407.595.2]in the output image is set to 1 if and only if its color components fall within the specified ranges. Otherwise, the pixel value is set to 0. The following figure shows the histograms of each plane of a color image stored in RGB format. The gray shaded region indicates the threshold range for each of the color planes. For a pixel in the color image to be set to 1 in the binary image, its red value should lie between 130 and 200, its green value should lie between 100 and 150, and its blue value should lie between 55 and 115.
[image:3.595.347.505.81.143.2](a) (b) (c)
Fig 5: Histogram(a)Red plane(b)Green plane(c)Blue plane
(a) (b) Fig 6: (a) Color Extraction (b)HistoGram
The freeman chain contour algorithm for edge detection of bacteria is given below:
Scan the image row by row from left to right.
Check the intensity of the two adjacent pixels. If any change in the intensity of the adjacent pixels, then an edge point is detected and contour is continued.
Repeat Step2 for the entire image.
The edges obtained with the existing edge operators are do not have single pixel width. Figure8 shows the edge of the bacteria which is of primary importance in shape detection is traced using contour traversal. In this paper, we use 8-connectivity, to have more accuracy and efficiency. In this method each pixel is compared to its eight neighbors in contour, if a pixel p differs in sign or pixel value with its neighbor q, then an edge between them is detected. The contour values of pixel directions are stored.
) ( )
( 2
2
q f p
f
After pre-processing, the features of the bacteria are extracted that includes a set of 81 features. Some of the distinguished features like area, perimeter, circularity, major axis, minor axis, eccentricity, tortuosity which helps in bacterial classification are used for clustering and the results are shown in Table 1. K-means static method and SOM are used to extract bacterial clusters from the input image.
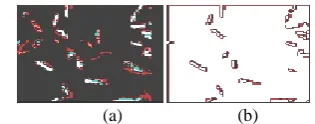
(a) (b) (c) Fig 7: (a) Original image (b) Gray level image (c) Binary
image
(a) (b)
Fig 8: (a) Original Image in Grey Threshold (b)The Edges of single pixel width
The features used in this proposed method are defined below
Area: the area of the bacteria with n pixels covered.
Perimeter : the contour length of the bacterial cell
Circularity : 4 π( area) /( perimeter)2
Compactness : (perimeter) 2 / 4 π( area)
Major axis: the longest distance between 2 pixel on the bacterial edge. Euclidean distance is used for
distance calculation
Minor axis: the maximum breadth of the perpendicular to major axis of the bacterial cell
Eccentricity : the ratio of length of major axis and length of minor axis
Eccentricity = Length major_axis / Length mior_axis
Tortuosity : Length major_axis / perimeter
5.
CLUSTERING and CLASSIFICATION
Clustering pertains to unsupervised learning, where the data with class labels are not available. It basically involves enumerating C partitions, optimizing some criterion, over t-iterations, so as to minimize the inter-cluster distance (dissimilarity) or maximize the intra-cluster resemblance (similarity). Majority of the techniques that have been used for pattern discovery from bacteria are clustering and classification methods.
Self Organizing maps (SOM) missing and incomplete data and extensively used for clustering and classification of large datasets, especially in the areas of text mining and bioinformatics. Statistical technique K-means and Neural network based clustering technique SOM-Kmeans is presented in this paper. Both K-Means and SOM-Kmeans clustering algorithms clusters N data points into k disjoint subsets Sj. The
geometric centroid of the data points represents the prototype vector for each subset. SOM is a close cousin of K-Means that embeds the clusters in a low dimensional space right from the beginning and proceeds in a way that places related clusters close together in that space. Experimental results are provided to show performance in terms of intra-cluster and inter-cluster distances for both K-Means and SOM-Kmeans clustering algorithms.
6.
RESULTS AND DISCUSSIONS
[image:3.595.58.278.177.240.2] [image:3.595.56.282.654.748.2]Inter-Cluster and the Intra-Cluster distances. Also used are the internal evaluation functions such as Cluster Compactness (Cmp), Cluster Separation (Sep) and the combined measure of Overall Cluster Quality (Ocq) to evaluate the Intra-Cluster homogeneity and the Inter-Cluster separation of the clustering results. Experimental simulations are performed using MATLab.
Table 1. Sample feature values extracted for clustering
Cluster Compactness is used to evaluate the intra-cluster homogeneity of the clustering result and is defined as:
C
i
i
X v
c v C Cmp
1 ( )
) ( 1
Where C is the number of clusters generated on the data set X, v(ci) is the deviation of the cluster ci, and v(X) is the deviation
of the data set X given by:
) , ( 1
) (
1
2 x x
d N X
v
N
i
i
Where d(xi, xj) is the Euclidean distance(L2 norm), is a
measure between two vectors xi and xj, N is the number of
rembers in X, and x is the mean of X.
Cluster Separation is used to evaluate the intra-cluster separation of the clustering result and is defined as:
C
i
j c i c C
i j j C C
x x d Sep
1
2 2
, 1 ) 1 (
1
2 ) , ( exp
Where C is the number of clusters generated on the data set X, is the standard deviation of the data set X, and d (xci, xcj) is
the Euclidean distance, is a measure between centroid of xci
and xcj. Similar to Cmp, the larger the Sep value, the larger
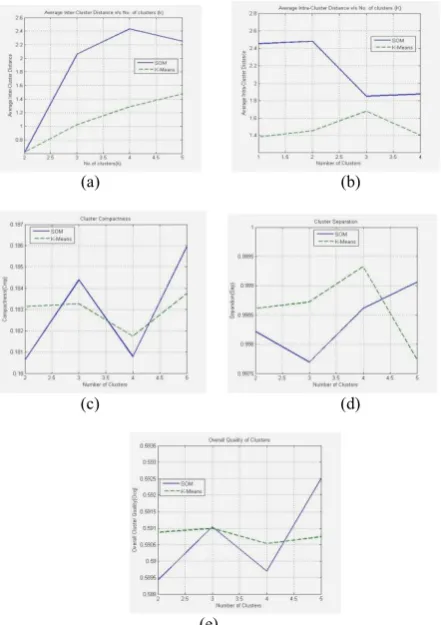
the overall dissimilarity among the output clusters. It is observed from the Fig.9 (d) that Sep value SOM and K-Means algorithms decreases with the increase in number of clusters.
The Overall cluster quality (Ocq) is used to evaluate both intra-cluster homogeneity and inter-cluster separation of the results of clustering algorithms. Ocq is defined as
Ocq
(
)
Cmp
(
1
)
Sep
where [0, 1] is the weight that balances the measures Cmp and Sep. A value of 0.5 is often used to give equal weights to the two measures for overcoming the deficiency of each measure and assess the overall performance of a clustering system. Therefore, the lower the Ocq value, the better the quality of resulting clusters. It is observed from Fig.9 (e ) that, the Ocq value of SOM algorithm is lower compared to K-Means indicating the clusters formed by SOM are with better quality. The time complexity K-Means is quad log time O(n*k*log2n) and SOM is polynomial log time O (n*k*log2n)
with varying number of iterations. Results of clustering algorithms may be used in the applications to evaluate medical report and to identify different types of microorganisms present in the sample, to count the number of microbes present in each cluster for the purpose of effective treatment, to detect the outlier etc.
(a) (b)
(c) (d)
[image:4.595.49.288.166.307.2]
(e)
Fig 9: Performance of K-Means and SOM-Kmeans clustering
algorithms shown for two samples(a)Average Inter-cluster Distance v/s No. of k clusters, (b)Average Intra-cluster distance
v/s No. of clusters, (c) Cluster Compactness, (d)Cluster Separation, (e)Overall quality of clusters
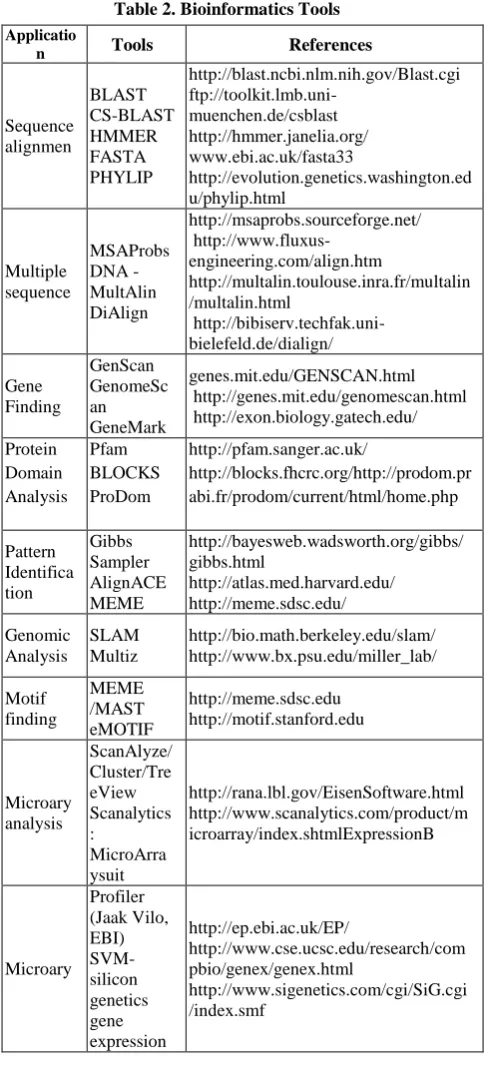
Some of the bioinformatic tools used in Sequence alignment, Multiple sequence, Gene Finding, Protein Domain Analysis, Pattern Identification, Genomic Analysis, Motif finding, Microarry analysis, Microarry is shown Table 2. Clustering is used in computational biology and bioinformatics for transcriptomics, i.e., clustering is used to build groups of genes with related expression patterns (also known as co expressed genes). In sequence analysis, clustering is used to group homologous sequences into gene families. In high-throughput genotyping platforms clustering algorithms are used to automatically assign genotypes. In Medicine, Psychology and Neuroscience also clustering is used. In medical imaging, such as PET scans, cluster analysis can be used to differentiate between different types of tissue and blood in a three dimensional image. In Image segmentation, Clustering can be used to divide a digital image into distinct regions for border detection or object recognition. In medical applications, clustering methods can be used for the purpose of cardiac image segmentation and to track the volume of left ventricle during complete cardiac cycle. It is also used to classify the patients as normal, hyperthyroid, hypothyroid using unsupervised clustering methods etc.
Perimetr Circularity Compact Eccentriciy Tortuosity
95.41247 1.3278449 0.7531 1.8449096 0.3957599
43.88518 1.2612567 0.79286 2.3327423 0.4137444
184.9859 1.3480177 0.74183 1.5951511 0.3814072
35.47754 1.1000011 0.90909 1.6012996 0.3818204
28.38905 1.0909051 0.91667 1.7658737 0.3917105
41.20818 1.1403548 0.87692 1.8218334 0.3946192
68.19114 1.1912278 0.83947 1.7478566 0.3907287
125.1152 1.2603824 0.79341 1.7185649 0.3890829
Table 2. Bioinformatics Tools
Applicatio
n Tools References
Sequence alignmen
BLAST CS-BLAST HMMER FASTA PHYLIP
http://blast.ncbi.nlm.nih.gov/Blast.cgi
ftp://toolkit.lmb.uni-muenchen.de/csblast http://hmmer.janelia.org/ www.ebi.ac.uk/fasta33
http://evolution.genetics.washington.ed u/phylip.html
Multiple sequence
MSAProbs DNA - MultAlin DiAlign
http://msaprobs.sourceforge.net/
http://www.fluxus-engineering.com/align.htm
http://multalin.toulouse.inra.fr/multalin /multalin.html
http://bibiserv.techfak.uni-bielefeld.de/dialign/
Gene Finding
GenScan GenomeSc an GeneMark
genes.mit.edu/GENSCAN.html http://genes.mit.edu/genomescan.html http://exon.biology.gatech.edu/
Protein Domain Analysis
Pfam BLOCKS ProDom
http://pfam.sanger.ac.uk/
http://blocks.fhcrc.org/http://prodom.pr abi.fr/prodom/current/html/home.php
Pattern Identifica tion
Gibbs Sampler AlignACE MEME
http://bayesweb.wadsworth.org/gibbs/ gibbs.html
http://atlas.med.harvard.edu/ http://meme.sdsc.edu/
Genomic Analysis
SLAM Multiz
http://bio.math.berkeley.edu/slam/ http://www.bx.psu.edu/miller_lab/
Motif finding
MEME /MAST eMOTIF
http://meme.sdsc.edu http://motif.stanford.edu
Microary analysis
ScanAlyze/ Cluster/Tre eView Scanalytics :
MicroArra ysuit
http://rana.lbl.gov/EisenSoftware.html http://www.scanalytics.com/product/m icroarray/index.shtmlExpressionB
Microary
Profiler (Jaak Vilo, EBI) SVM-silicon genetics gene expression
http://ep.ebi.ac.uk/EP/
http://www.cse.ucsc.edu/research/com pbio/genex/genex.html
http://www.sigenetics.com/cgi/SiG.cgi /index.smf
7.
CONCLUSIONS
In this paper, we proposed bacterial image classification for all types of bacteria and color segmentation has been done with histogram thresholding. The morphological features like erosion, reconstruction and dilation with binarization and thresholding has been done for the edge detection using freeman contour. SOM and k-means have been used for clustering of bacteria. The results of bacterial clusters may be used in the areas of medical image analysis. This method will assist the doctors in deciding the intensity of the diseases or infection that can save critically ill patients.
8.
REFERENCES
[1] Shillabeer, A. and Roddick J, Establishing a Lineage for medical Knowledge Discovery. ACM International Conference Proceeding Series. 70, 29-37, 2007.
[2] Riccardo Bellazzi, Fulvia Ferrazzi, Lucia Sacchi, Predictive data mining in clinical medicine: a focus on selected methods and applications,wiley Interdisciplinary reviews: Data mining and Knowledge discovery, vol1, 2011
[3] G.T.Raju, Chayadevi M.L, “Data Mining in Bioinformatics and its Applications–a Survey”, ICDECS2011, ISBN 978-93-81583-17-3, dec 2011.
[4] Khalid Raza, Application of Data mining in Bioinformatics,Indian Journal of Computer Science and Engineering Vol 1, No 2, 114-118, 2010.
[5] Massana R,Gasol JM, Measurements of bacterial size via image analysis of spifluorescene preparationscientia Martina 61,397-407,1997.
[6] P.S.Hiremath and Parashuram B, Automatic Identification and classification of Bacilli Bacterial cell growth phases, IJCA RTIPPR, 2010.
[7] Riries Rulaningtya, Adriyan B.Suksmono, Tati , Automatic Classification of Tuberculosis Bacteria using Neural n/w, International Conference on Electrical Engineering and informatics ,2011.
[8] S.Prabhakar, K.Porkumaran, J.Samson Isaac, Development of Image Processing scheme for bacterial Classification based on Optimal discriminant feature, IEEE,978-1-4244-4713, 2010.
[9] Yasuhito Abe, Teiri Sagawa, Ken Sakai and Shigeru Kimura. Enzyme-linked immunosorbent assay (ELISA) for human epidermal growth factor (hEGF). Clinica Chimica Acta, 168: 87-95, 1987.
[10]Nakul Soni, Chirag Gandhi, Application of Data Mining to Health Care, International Journal of Computer Science and its Applications, 2010.
[11]Yuanyuan Shen, Zhe Liu, Jurg Ott, Support vector machines with L1 penalty for detecting gene-gene interactions, International journal of Data Mining and Bioinformatics, 2011.
[12]Woolf P.J., Wang Y. (2000), “A fuzzy logic approach to analyzing gene expression data”, Physiological Genomics, vol3(1), 9-15, 2000.
[13]Chayadevi M.L, G.T.Raju, Extraction of Bacterial Clusters from Digital Microscopic Images through Statistical and Neural Network Approaches”, ICADC 2012, pp 1091-1099.