Design and Implementation of Floating Point
based System for Pellet Size Distribution using
Circular Hough Transform
Dhiraj
Machine Vision Lab, DSG Council of Scientific & Industrial Research-(CSIR-CEERI), Pilani, Rajasthan, IndiaJ.L. Raheja
Machine Vision Lab, DSG Council of Scientific & Industrial Research-(CSIR-CEERI), Pilani, Rajasthan, IndiaVaishali Singh
Dept of ECE Amity School of Engg.
& Tech. Amity University
Noida, U.P.
Sreekanth
Pusapati
Dept of ECE Amity School of
Engg. & Tech. Amity University
Noida, U.P
Ashutosh
Gupta
Faculty Dept of ECE Amity School of
Engg. & Tech. Amity University
Noida, U.P
ABSTRACT
Detection of circular shape from grey scale images is explored in this paper. The algorithm used for detection of circles is Circular Hough Transform which is one of the types of Hough Transform. The algorithm is implemented in VHDL. In this paper IEEE-754 single precision standard floating point number has been discussed and also the arithmetic operations such as addition, subtraction, multiplication and division have also been covered.
General Terms
Hough Transform, Floating point numbers, Detection, Parameter space
Keywords
Gradient, Accumulation array, Circular Hough Transform, Computer vision
1 INTRODUCTION
Identifying basic shapes in an image is one of the challenging and important problems in industrial and other applications of image processing. One of the famous industrial applications is pellet manufacturing. Pellets are small spherical iron ore balls used in steel production. The size of the pellets must be regularly checked when the furnace is loaded, to be able to ensure maximum efficiency. In pellet manufacturing, the usual method involves manual sampling followed by sieving with a square mesh is used for quality control. The estimation of pellet size is done under the assumption that the pellets are spherical. The manual sampling approach is inadequate, time-consuming and inefficient. Ideally fast feedback of pellets sizes is desirable.
1.1
Pellets as Spherical Objects
A more efficient and effective way is to use Image Processing techniques to determine the size distribution from a live camera feed. As the pellets edges are detected, each points on the edge of the pellets defines the set of circles in the accumulated space; these circles defines all possible values of the radii and are centered on the coordinates of the edge point [1,2].
1.2
Hough Transform
For extracting the edges from the image edge detectors can be used. Many edge detectors have been proposed in the literature, such as Canny [3], Robert [4], Prewitt [5] and Driche [6]. Of these,
the canny edge detector has been widely successful in extracting the edge feature from an image. The edge extracted Image is used by many algorithms, such as the Hough Transform and the Linear Square method, to further extract shape information like straight lines, ellipses, circles, etc. The most widely used circle detection algorithm is the Circular Hough Transform because it is tolerant to edge gaps and remain unaffected to noisy backgrounds.
1.3
Floating Point Standard
Digital arithmetic operations are very important in the design of digital processors and application-specific systems. Arithmetic circuits form an important class of circuits in digital systems. With the remarkable progress in the Very Large Scale Integration (VLSI) circuit technology, many complex circuits, unthinkable yesterday have become easily realizable today. Algorithms that seemed impossible to implement now have attractive implementation possibilities for the future [7, 8]. This means that not only the conventional computer arithmetic methods, but also the unconventional ones are worth investigation in new designs.
The notion of real numbers in mathematics is convenient for hand computations and formula manipulations. However, real numbers are not well-suited for general purpose computation, because their numeric representation as a string of digits expressed in, say, base 10 can be very long or even infinitely long. In this paper, the concept of floating point numbers is used because hardware tool does not support real numbers for synthesis.
2 PELLET’S DETECTION SCHEME
2.1 Detection of circles
in an image is the problem that is discussed. The algorithm Hough Transform, have been proposed to detect circles. These algorithms detect circles from the edge detected images. Circular Hough Transform, a type of Hough Transform has
been widely successful in meeting the real time requirements. It is able to detect circular shapes from the images as detecting circular objects is an important task in various industrial applications [10, 11].
2.2 Methodology
Image Acquisition
Preprocessing
Edge Detection
Signature curve formation
Simulation
[image:2.595.188.408.141.399.2]Stop
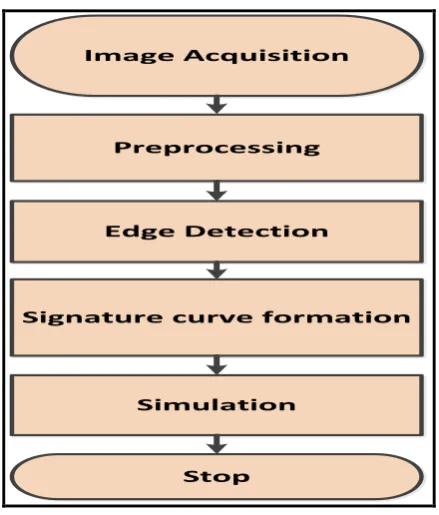
Figure 1: Block Diagram for PSD detection technique
In order to ensure the real time and accurate measurement the size of each pellet in the top layer is measured. When the pellets are accumulated in a pile, the conventional segmentation methods do not give satisfactory results. However, in the proposed method pellet sizes are measured using Circular Hough transform Scheme which is near to its real time implementation.
The figure 1 shows the Block diagram of pellet size detection technique adopted. Firstly, the image is captured through the Color camera which can be stated as an image acquisition process then preprocessing is done in which the grey scale image is smoothened. The next step is edge detection in which the edges are marked for the desired shape and then the signature curve is drawn for the circle. The size analysis is done for the calculation of radius and center of the circle. In the end the calculated output radius and center are displayed.
3 CIRCULAR HOUGH TRANSFORM
An input gray scale image is taken and then Circular Hough Transform is performed over it. The Hough Transform algorithm uses array, called an accumulator. The dimensions of the accumulator are equal to the unknown parameters of the circle such as radius and center. For each pixel and its neighborhood, the Hough transform algorithm determines if there is enough evidence of an edge at that pixel. If so, it will calculate the parameters of that line, and then look for the accumulator's bin that the parameters fall into, and increase the value of that bin [11].
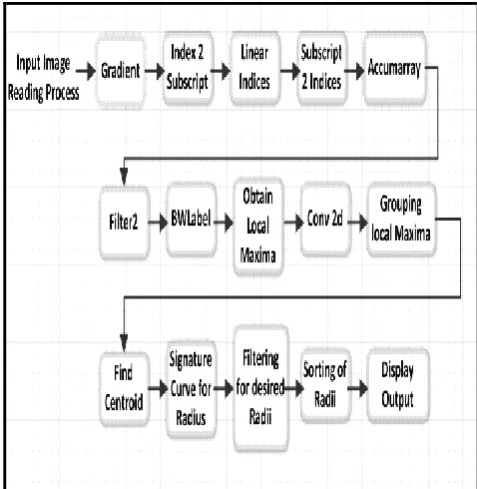
Figure 2 shows the flow chart of CHT. In Circular Hough Transform, voting procedure is carried out in a parameter space. The local maxima in accumulator space are obtained by voting procedure and are used to compute the Hough Transform. Parameter space is defined by the parametric representation used to describe circles in the picture plane, which is given by equation (3.1). An accumulator is a 2D array used to detect the existence of the circle in the Circular Hough Transform [12, 13].
(x - a)2 – (y - b)2 = r2 (3.1)
Figure 2: Flow chart of CHT
To build the accumulation array, the first step is to compute the gradient and the gradient magnitude of the image region. Since edge detection generally involves computing the intensity gradient magnitude, the gradient direction is often found as a side effect. From the segmentation process of the accumulator, the segmented accumulator is smoothened to get better segmented value using averaging filter. To obtain the area of interest, local maxima mapping on the desired image region is generated by locating local maximum on the segmented region [13, 14]. The threshold process is known here by gradient threshold and takes the adaptive threshold method whose threshold value varies across the entire image [15]. It group’s the local maxima candidates by adjacency, compute the centroid position for each group and take that as the center of the detected circle [16]. For each edge point, draw a circle with center in the edge point with radius r and increment all coordinates that the perimeter of the circle passes through in the accumulator. The radius is obtained through the signature curve. Obtain the neighborhood of the circles for building the signature curve.
4 LOGIC IMPLEMENTATION
4.1 Structural Model
Structural level is primarily the graphical representation of the digital system and so it is closer to the actual physical representation of the system. The figure 3 shown below depicts the block diagram of the structural view of the CHT that is implemented in VHDL.
Figure 3: Structural Blocks for the Implemented Logic
5 HARDWARE IMPLEMENTATION
We have implemented the proposed algorithm on FPGA using its structural style of modelling for smaller image sizes. The Logic consumption in terms of combination and sequential elements is shown in Table 1. The problem with the bigger images is the large number of computation required to process the recursive implementation of logic blocks.
The design properties for the logic on FPGA are Family: Virtex6
Device: XC6VLX240T
Package: FF1156
Speed: -1
Table 1: Synthesis results
S.No Block Sequential
elements
Combinational
elements
Timing
Summary
(Period)
1. Ind2Sub 23.32 % 62.11% 2.105 2. Centroid 0.39 96.80 1.054 3. MarkEdge 0.00 95 2.353 4. Detectd_radii 24.43 75.06 1.427 5. Region
Bounds
0.16 21.71 1002
6. Filter2 0.83 99.02 1251
6 SIMULATION RESULTS
[image:3.595.55.293.71.331.2]been taken and (b) shows the simulated result of the calculated radius and center for the first test case.
Number of circles detected = 5 Radius range = [1, 6]
Input Image Matlab output
Figure 4: (a) Input image for test case1(127x103)
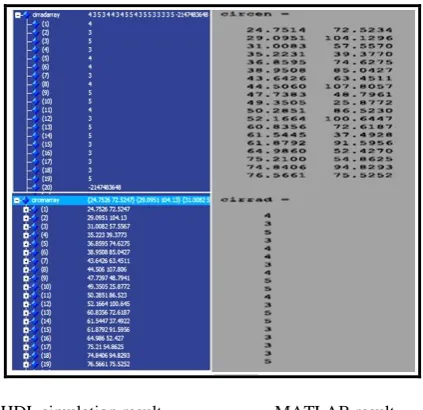
VHDL simulation result MATLAB result
Figure 4: (b) Simulation result and its verification
Figure 5(a) the second test case with 19 circles has been taken and (b) shows the simulated result of the calculated radius and center for the second test case.
Number of circles detected = 19 Radius range = [1, 6]
Figure 5(a): Input image for test case 2(127x103)
VHDL simulation result MATLAB result
Figure 5(b): Simulation result and its verification
Figure 6(a) the third test case with 48 circles has been taken and (b) shows the simulated result of the calculated radius and center for the third test case.
Number of circles detected = 48 Radius range = [5,9]
[image:4.595.322.534.70.275.2] [image:4.595.54.282.107.273.2] [image:4.595.52.285.309.453.2] [image:4.595.316.544.329.481.2] [image:4.595.56.284.576.686.2]
Figure 6(b): Simulation result and its verification
The algorithm has been implemented using ModelSim simulator for VHDL implementation and the synthesis is done using XILINX ISE 13.2 tool.
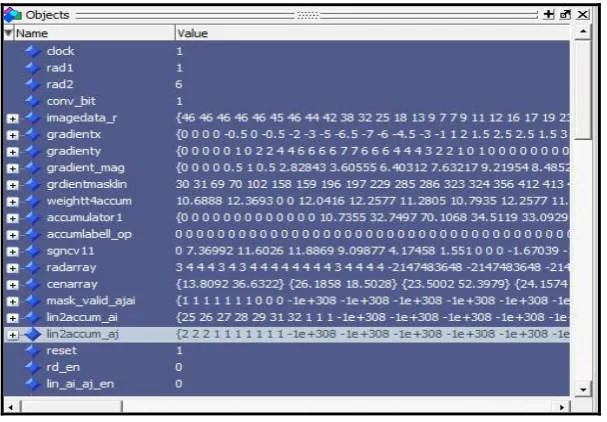
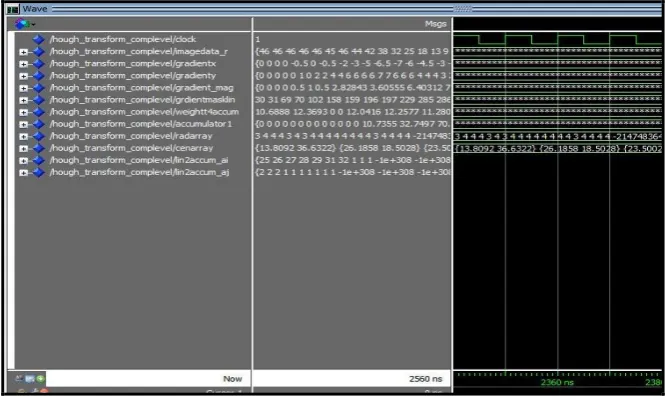
[image:5.595.63.270.73.412.2]The details of the functional verification are shown in the following figures 7(Object windows) & 8(waveform).
[image:5.595.147.451.456.667.2]Figure 8: Modelsim Simulation : Waveform
7 RESULT ANALYSIS
[image:6.595.315.540.294.414.2]The following graphs shows the analysis in terms of detected circles along with their radius for 3 three different test cases considered.
Figure 9: Pellet size analysis for test case 1
In figure 9 the number of circle detected is 5. It can be seen that the peak for the number of circles detected is for the pellet having radius value 4 and then 5. So, it is clear that 4 circles are detected of radius 4 and only 1 circle for radius 5.
Figure 10: Pellet size analysis for test case 2
In figure 10 the number of circle detected is 19. It can be seen that the peak of the number of circles detected is for the pellet having radius value 3 and for value 5. So, it is clear that 8 circles are detected of radius 3, 6 circles are detected for radius 5 and 4 circles are detected for radius 4.
Figure 11: Pellet size analysis for test case 3
[image:6.595.54.279.343.454.2]In figure 11 the number of circle detected is 48. It can be seen that the peak for the number of circles detected for the pellet having radius value 7, 8 and 6. So, it is clear that 33 circles are detected of radius 7, 9 circles of radius 6 and 6 circles of radius 8.
Table 2: Tabular analysis for all the test cases
Test Case Number
Image Type
Dimension No. of
circles detected
Radius range of the circles detected
1 Grey
scale
127 x 103 2 24-27
2 Grey
scale
127 x 103 5 4-5
3 Grey
scale
127 x 103 19 3-5
4 RGB 127 x 103 48 6-8
The table 2 shown above gives the complete analysis for all the test cases we have taken giving all the relevant information such as image type, dimensions, number if circles detected and the radius range.
8 CONCLUSION
[image:6.595.54.277.536.645.2]encoding to enable the parallelization of the system developed. The proposed algorithm is also successfully implemented for smaller image sizes on FPGA Virtex 6 however for larger image sizes as the data to be computed is very large so the logic and time required is quite large and does not accommodate in available resources. The solution to the above problem is to test the blocks with the various window sizes with recursive calls. The effectiveness of the technique will get affected because of low light illumination or due to overlapping of circles with each other.
9 ACKNOWLEDGMENTS
This research is being carried out at Central Electronics Engineering Research Institute (CEERI), Pilani, Rajasthan, India .Authors would like to thank the Director, CEERI for his active encouragement and support.
10 REFERENCES
[1] Sirisak Liangwongsan, Boonraung Marungsri, Ratchadaporn Oonsivilai and Anant Oonsivilai, “Extracted Circle Hough Transform and Circle Defect Detection Algorithm,” World Academy of Science, Engineering and Technology 60 2011, pp. 432-437
[2] Dimitrios Ioannou,Walter Huda and Andrew F. Laine, “Circle recognition through a 2D Hough Transform and radius histogramming, ” Journal of Image and Vision Computing 17 (1999) Esevier, pp. 15–26
[3] J. Canny, “A computational approach to edge detection,” IEEE Trans. Pattern Anal.and Mach. Intell., vol. 8, pp. 679-714, Nov. 1986.
[4] L. S. Davis, "A survey of edge detection techniques," Comput. Graph.and ImageProcess., vol. 4, pp. 248-260, Sept. 1975.
[5] W. Dong and Z. Shisheng, “Color image recognition method based on the Prewittoperator,” Int. Conf. Computer Science and Software Engin., vol. 6, pp. 170-173,Dec. 2008.
[6] S. Lanser and W. Eckstein, “A modification of Deriche's approach to edge detection,”in Proc. Int. Conf. Image, Speech, and Signal Anal., The Hague, Netherlands, 1992,pp. 633-637.
[7] U. Kulisch, “Advanced Arithmeti c for the Digital Computers”, Springer- Verlag, Vienna, 2002.
[8] J. R. Hauser ACM Trans, "Handling Floating-point Exceptions in Numeric Programs", on Prog. Lang. and Syst. vol. 8-2 (Mar. 1996).
[9] Simon Just Kjeldgaard Pedersen, Circular Hough Transform, Aalborg University, Vision, Graphics and Interactive Systems, November 2007. Available at: http://www.cvmt.dk/education/teaching/e07/MED3/IP/Si mon_Pedersen_CircularHoughTransform.pdf
[10] K. Kanatani, Geometric Computation for Machine Vision, Oxford University Press, Oxford, 1993.
[11] D. B. Cooper and N. Yalabik, On the computational cost of approximating and recognizing noise-perturbed straightlines and quadratic arcs in the plane, IEEE Trans. Comp., 25-10 (1976), 1020–1032.
[12] S.A. Sirohey and A. Rosenfeld, “Eye detection in a face image using linear and nonlinear filter”, Pattern Recognition 34 (2001) 1367– 1391.
[13] K.M. Lam and H. Yan, “Locating and extracting the eye in human face images”, Pattern Recognition. 29 (1996) 771–779.
[14] A. Pentland, B. Moghaddam and T. Starner, “View-based and modular eigenspaces for face recognition”, Proceeding. IEEE Conf.on Computer Vision and Pattern Recognition (CVPR’94) , Seattle, WA, 1994
[15] X. Xie, R. Sudhakar and H. Zhuang, “On improving eye feature extraction using deformable templates”, Pattern Recognition. 27 (1994) 791–799