© 2015, IRJET ISO 9001:2008 Certified Journal
Page 441
Method for Arrangement of Heterogeneous D-Matrix
Poonam Madhukar Jagdale
Research Scholar, Dept. of Computer Engineering, JSPM’s ICOER, Pune,Maharashtra, India
---***---Abstract -
To gain the system level fault analyticinformation between the recognizable signs and disappointment modes, the dependency matrix (D-Matrix) for in sufficiency is created. The primary first rule to make d-matrix by using the domain data is outstandingly delayed undertaking. Later, in the wake of discovering the new symptoms and disappointment modes for first time, mining it into the created d-framework is a troublesome task. Subsequently, the text mining framework concentrated around the ontology is delivered by mining number of unstructured dataset i.e. repair verbatim data accumulated while issue of fault diagnosis procedure to create and overhaul the d-matrix. In this strategy, ontology for deficiency conclusion is fabricated first which identifies with the idea and associations display in the determination domain. The text mining estimation is used as a part of next method. In our procedure, we used the strategy to make d-matrix for two datasets. By then, the graph is delivered for every one made matrix. The comparability between two d-matrixes is procured by joining the both graphs for generating the final graph.
Key Words:
D-matrix, fault detection and diagnosis,
ontology, graph comparison algorithm
1 Introduction
:
Finding the issue when a complex automotive structure happen is straightforward, if you have the crucial information. This data is in two areas: understanding of the system in which the issue exists; and the ability to apply a intelligent demonstrative schedule. The system team up with it’s including to execute an arrangement of assignments by keeping up its execution inside a commendable extent of resistances. Any deviation of a structure from its commendable execution is regulated as a fault. The fault detection and diagnosis (FDD) is performed to perceive the deficiencies and diagnose the basic drivers to minimize the downtime of a structure. Fault detection and diagnosis is a key piece of various operations organization mechanization systems. Fault detection sees that an issue has happened, paying little mind to the way that you don't yet know the basic main
cause. Faults may be perceived by a blended bag of quantitative or subjective means. Fault diagnosis is pinpointing one or additionally hidden root of issues, to the point where therapeutic move can be made. This is furthermore suggested as "fault separation", especially when focusing on the refinement from issue location. In like way, accommodating utilization, "fault diagnosis" every now and again fuses deficiency distinguishing proof, so "fault disconnection" underscores the refinement. The unconventionality of automotive structures has developed and the related demonstrative capacities must take after. On account of ceaselessly getting to be mechanical progression that is embedded in the vehicle systems, for case propelled programming inserted frameworks [2], symptomatic sensors, web, thus on the philosophy of FDD gets the opportunity to be a testing movement in the event of portion or structure glitch. Obviously, after every conclusion scene the lessons learnt are kept up in a couple of databases to find and diagnose the faults. This database contains bunches of information needed for the analysis methodology like side symptoms, parts, faults, failure mode, error codes, so forth.
© 2015, IRJET ISO 9001:2008 Certified Journal
Page 442
2.
Literature Survey:
In the existing framework of fault modeling [4], [5], [6], [7], the confined endeavors are seen to assemble a D-matrix by dissecting unstructured repair verbatim information. Simply beginning late [10] the device is suggested that finds the information by conveying material blueprints from the on-board finding and help information by utilizing the logic based data mining. Notwithstanding, the crucial models proposed in are thought to be done and static; however in authentic because of outline and delineating changes and new vehicle basic masterminding dispatches the new appearances and failure modes are seen making such
models old-fashioned. In existing framework
improvement of D-matrix is done by physically or utilizing first standard. Generally, the D-frameworks are produced by utilizing the history information, building information, and considerable information [4], [5], [6], [7], [8] for instance, yet a practically no comprehension is given about the disclosure of new responses and failures modes saw shockingly and their consolidation in the D-matrix models.
To defeat this issue, in [12] the fault data is gotten and formalized in the fault diagnosis ontology, which is extended in light of the new data. The following ontology based substance mining figuring’s that uses this information model supports in-time FD.
To make a D-matrix explanatory model, principled
philosophy is proposed by dismembering the
unstructured repair verbatim data associated with the different structures in parallel through the headway of ontology based substance mining figuring’s. It overcomes the repression went up against in the veritable business of expecting to assemble the D-matrix investigative models physically or using first principles. Further, in our philosophy we have the limit get the cross-system conditions, which had any kind of effect to in a general sense improve the execution of FDD. The relations from the fault diagnosis cosmology are used to discover the conditions between the manifestations and the failure modes contrasting with differing systems. It upgraded the execution of our system when dissected with the Latent-Dirichlet Allocation (LDA) technique.
The D-matrix are produced by utilizing the history information, building data, and considerable information [6], [7], [8], [9], for example, yet a practically no comprehension is given about the revelation of new symptoms and failure modes saw shockingly and their thought in the D-matrix models.
In the current [12], the d-matrix is produced from the single dataset. In this way, it can't be helpful when there is
a need of making d-matrix from different datasets. This gets to be exceptionally tedious task when the new dataset given for producing d-matrix is identified with the past created d-matrix.
3.
Proposed System:
This structure exemplifies the headways of D-matrix from the repair verbatim data. After the making of the D-matrices from the unmistakable information sets, we deliver the graph for each d-matrix. By then, the graphs are joined such that just consistent illustrations are consolidated from the made different D-matrix to add to a lone, bland D-matrix.
To build up the D-matrix [12], the need is first the fault diagnosis ontology must be made by using the dataset which contains the repair verbatim data. After that, ontology-based text mining is completed .This step depicts three stages, for instance, Document Annotation, Term Extraction and Phrase Merging. The proposed system makes two d-matrix for two dataset independently. By then, the undirected graph is made depending upon the d-matrix. From the begin, the repair verbatim data focuses are accumulated by recovering them from the OEM's database, which are recorded amid FD strategy. In the first step, the terms, for case, part, symptom, and failure mode, significant for the D-matrix are clarified from each one repair verbatim by making the record annotation estimation. A repair verbatim incorporates several parts, symptoms, disappointment modes and exercises and the right affiliations must be made between the imperative terms concentrated around their district with one another. Here, a repair verbatim is first part in various sentences by utilizing as far as sentence limit location standards and the terms showing up in the same sentence are co-related with one another. At long last, Naive Bayes probability model is delivered to detail the consolidated terms by considering the relationship in which they are characterized.
From each one commented repair verbatim, the tuples, for example, the parts Pq ∈ {P1, P2,….Pa}, side effects Sr ∈ {S1, S2….Sb}, and the failure modes- fm ∈ {f1, f2,….fk}, and (Sr
Pq-fm) ∈ {S(1 ),P(1 )-f1, S2,P(2 )-f2,… .., Sb,P(a ) fa,Sb,Pb-fb} are produced by utilizing the term extraction reckoning to populate a D-matrix. Around the end of this step, a few tuples are produced yet every one of them is not dividing to diagnose the issues saw in relationship with a particular structure. The gathered institutionalized rehash of the tuples is found out and the tuples with their rehash over a particular utmost are kept as the substantial tuples.
© 2015, IRJET ISO 9001:2008 Certified Journal
Page 443
mode imparts that are made by utilizing a conflictingvocabulary. The wise data co-happening with the statements, i.e., parts, symptoms, disappointment mode, and exercises is used to gauge the unexpected probabilities and the elucidations with their likelihood score over the particular edge are joined. At long last, the starting late fabricated D-matrix is examined by the subject matter experts (SMEs) to recognize the divulgence of new symptoms and disappointment modes.
3.1. Algorithm:
In our framework, we used the graph comparison algorithm which takes the created d-matrix as data to process. The same system [12] for building the D-matrix is done in our proposed structure i.e. FUSION OF HETEROHENEOUS D-MATRIX, for two times for two repair verbatim data. In no time, the chart is created by using the matrix. The columns and row from the matrix are managed as the vertex for the graphs. As the d-matrix shows the conditions in the paired design, the edges for the graph is picked by using this binary data i.e. if 1 is the yield in d-framework for specific row and column, then, the edge is organized between that row and column. Along these lines, the graph is surrounded from the made d-matrix. Next, our structure takes a gander at two graphs and consolidated the ordinary purposes of interest appears in both graph. For this, the diagram used the graph combining algorithm.
The working of graph comparison algorithm joins: First, the graph relationship is completed. To complexity two diagrams it is crucial and distinguishes comparing vertices. By then a rundown of correspondence between the vertices are organized as an orchestrated of virtual edges that join the vertices over the two different diagrams under thought .In our framework, the summary of vertex is the once-over of row and columns from the two d-matrix. A schematic representation of the graph connection is to recognize the related neighborhood likenesses in two diagrams, given a summary of correspondence between vertices from the two graphs. At initially, every one arrangement of correspondence vertices is a substitute social occasion. Plus, regular get-togethers are consolidated reliably by single linkage with a given measure of resemblance. After this joining, the data which is regular from two graphs is collected. By using this resultant data, we make as of late graph (i.e. equivalence between two graphs).This as of late chart is used to fabricate the last d-matrix. This d-matrix is the last yield for our undertaking which is ascended out of the heterogeneous D-matrices.
3.2. System Architecture:
Dnyanesh G. Rajpathak [12] makes the d-matrix depicts in fig.1. The exact d-matrix is produced from [12] for single dataset yet graph is not made from the structure. Because of this, the new d-matrix is made for the dataset. Despite the way that the various datasets contains some similar data, the new d-matrix is made for each dataset.
The current framework that is fig.1. from [12] is actualized in our framework with new procedures for making d-matrix from diverse dataset individually portrays in fig. 2.
Fig.1. Text-Driven D-matrix development methodology from unstructured text data .
Fig.2. Fusion of Heterogeneous D-matrix.
3.3. Mathematical Model:
System P is represented as P = {D, M, G, C, H}
3.3.1Dataset:
© 2015, IRJET ISO 9001:2008 Certified Journal
Page 444
Where, D is the set of datasets which contains the repairverbatim data and are the number of
dataset.
3.3.2.
D-Matrices:
M= { }
Where, M is the set of d-matrices generated from the
datasets D and represents the number
of d-matrix.
3.3.3.
Graph Generation:
G= {V, E}
Where, G is the set of graphs generated from the d-matrices.
V= { }
Where, V represents the list of corresponding vertices
from the d-matrices and is the number of
vertices.
E= { }
Where, E represents the set of edges depending on the
data in the d-matrix and represents the
number of edges.
3.3.4.
Graph with common patterns:
C = {X, Y}
Where, C represents the graph of common patterns by merging the graphs.
X= { }
Where, X represents the set of common vertices from the
d-matrices and represents the number of
common vertices.
Y= { }
Where, Y is the set of common edges from the generated
graphs and represents the number of
common edges.
3.3.5.
Final D-matrix:
H={C}
Where, H represents the final d-matrix generated from merging the graphs.
4. Experimental Work and Results:
The base paper [12] creates the d-matrix for stand out for only one dataset which can't work for various datasets. In
our proposed framework i.e. combination of
heterogeneous D-matrix, d-matrix are created for two
datasets individually. Because of stand out d-matrix in [12], no correlation and merging methodology is finished. Nonetheless, in our framework, we are consolidating the d-matrix on the similitude premise. In this way, this can be valuable for reuse process. No framework is accessible for consolidating d-matrix already. In any case, our framework takes solves this issue. The last yield of our framework is again content driven d-matrix. From [12], we can express that our proposed framework's yield is superior to the historical data-driven d-matrix.
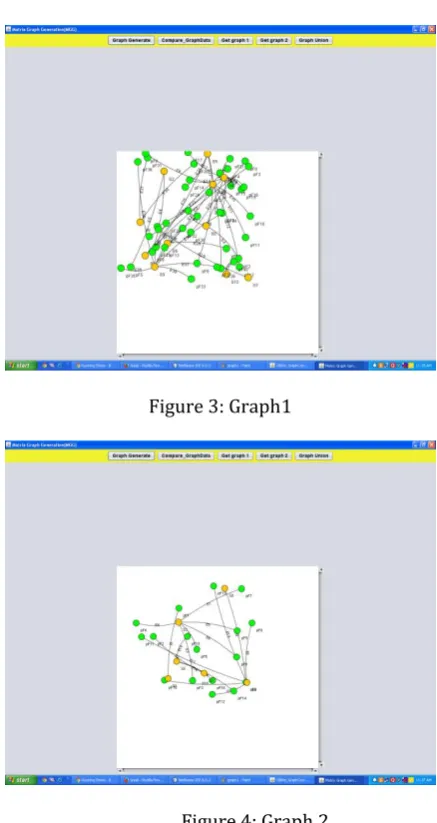
The following graph shows the graph generated for the dataset 1.
[image:4.595.306.525.239.651.2]Figure 3: Graph1
Figure 4: Graph 2
[image:4.595.309.525.253.434.2]© 2015, IRJET ISO 9001:2008 Certified Journal
Page 445
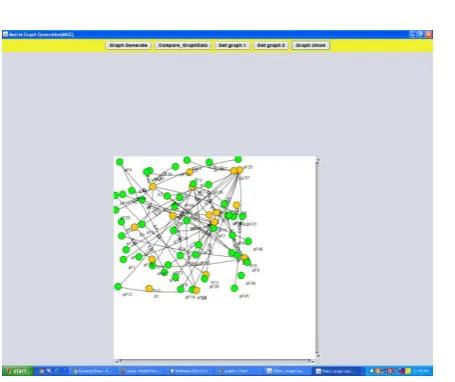
Figure 5: Fusion of GraphThe above graph shows the union graph generated from the graph1 and graph2.
5. Conclusion:
In this paper, we consider the appropriateness of making basic matrix from diverse matrix. We make the d-matrix from every unstructured repair verbatim data like way in [12] by using text mining algorithm. In our proposed structure, the undirected graphs are created for each d-matrix which is made from the unstructured repair verbatim data. The graph correlation figuring is used to make d-network such that the typical illustrations ascending out of the heterogeneous d-matrices which can be used to create single, broad D-matrix. In future, our point is to reuse the d-matrix produced in our framework for the dataset which contains normal data in it to diagnose the faults
ACKNOWLEDGEMENT
This is a great pleasure & immense satisfaction to express my deepest sense of gratitude & thanks to everyone who has directly or indirectly helped me in research paper. I express my gratitude towards project guide Prof. D.P. Gadekar , PG Coordinator Prof. R. N. Phursule and Prof. S.R. Todmal (Head, Department of Computer Engineering, Wagholi, Pune )who guided & encouraged me the research work. I also thank all friends for being a constant source of my support.
REFERENCES
[1] J. W. SHEPPARD AND S. G. W. BUTCHER, “A Formal
Analysis of Fault Diagnosis with D-matrices”, The Johns Hopkins University, Baltimore, MD 21218, USA [2] O. Benedittini, T. S. Baines, H. W. Lightfoot, and R. M.
Greenough, “State-of-the-art in integrated vehicle health management,” J. Aer. Eng., vol. 223, no. 2, pp. 157–170, 2009.
[3] V. Venkatasubramanian, R. Rengaswamy, K. Yin, and S. Kavuri, “A review of process fault detection and diagnosis Part III: Process history based methods,” Comput. Chem. Eng., vol. 27, no. 3, pp. 327–346, 2003. [4] E. Miguelanez, K. E. Brown, R.Lewis, C. Roberts, and D.
M. Lane, “Fault diagnosis of a train door system based on semantic knowledge representation railway condition monitoring,” in Proc. 4th IET Int. Conf ., 2008, pp. 1–6.
[5]
J. Sheppard, M. Kaufman, and T. Wilmering, “Model
based standard for diagnostic and maintenance information integration,” in Proc. IEEE[6] M. Schuh, J. Sheppard, S. Strasser, R. Angryk, and C. Izurieta, “Ontology-guided knowledge discovery of event sequences in maintenance data,” in Proc. IEEE AUTOTESTCON Conf ., 2011, pp. 279–285.
[7] S. Strasser, J. Sheppard, M. Schuh, R. Angryk, and C. Izurieta, “Graph based ontology-guided data mining for d-matrix model maturation,” in Proc. IEEE Aerosp. Conf., 2011, pp. 1–12.
[8] S. Deb, S. K. Pattipati, V. Raghavan, M. Shakeri, and R. Shrestha, “Multi-signal flow graphs: A novel approach for system testability analysis and fault diagnosis,” IEEE Aerosp. Electron. Syst.., vol. 10, no. 5, pp. 14–25, May 1995.
[9] R. Studer, V. R. Benjamins, and D. Fensel, “Knowledge engineering: Principles and methods,” J. Data Knowl. Eng.., vol. 25, nos. 1–2, pp. 161–197, 1998.
[10] M. Schuh, J. W. Sheppard, S. Strasser, R. Angryk, and C. Izurieta, “A Visualization tool for knowledge discovery in maintenance event sequences,” IEEE Aerosp. Electron. Syst. Mag., vol. 28, no. 7, pp. 30–39, Jul. 2013.
[11] S. Singh, H. S. Subramania, and C. Pinion, “Data-driven framework for detecting anomalies in field failure Data,” in Proc. IEEE Aerosp. Conf., 2011, pp. 1– 14.