Perspectives on Synoptic Climate Classification and its Role in Interdisciplinary Research
1
2
Authors: P. Grady Dixon1, Michael Allen2, Simon N. Gosling3, David M. Hondula4,5, Vijendra Ingole6,7, Rebekah
3
Lucas8, Jennifer Vanos9
4
1
Department of Geosciences, Fort Hays State University, Hays, Kansas, USA
5
2
Department of Political Science and Geography, Old Dominion University, Norfolk, Virginia, USA
6
3
School of Geography, University of Nottingham, Nottingham, United Kingdom
7
4 Center for Policy Informatics, Arizona State University, Phoenix, Arizona, USA
8
5
School of Geographical Sciences and Urban Planning, Arizona State University, Tempe, Arizona, USA
9
6
Umeå Centre for Global Health Research, Umeå University, Umeå, Sweden
10
7Vadu Rural Health Program, KEM Hospital Research Centre, Pune, India
11
8
School of Sport, Exercise, and Rehabilitation Sciences, University of Birmingham, Birmingham, United Kingdom
12
9 Department of Geosciences, Texas Tech University, Lubbock, Texas, USA
13
14
15
16
17
18
19
20
21
22
23
24
25
26
Abstract
28
Synoptic climatology has a long history of research where weather data are aggregated and composited to gain a
29
better understanding of atmospheric effects on non-atmospheric variables. This has resulted in an applied
30
scientific discipline that yields methods and tools designed for applications across disciplinary boundaries. The
31
spatial synoptic classification (SSC) is an example of such a tool that helps researcher bridge methodological gaps
32
between disciplines, especially those studying weather effects on human health. The SSC has been applied in
33
several multi-discipline projects, and it appears that there is ample opportunity for growth into new topical areas.
34
Likewise, there is opportunity for the SSC network to be expanded across the globe, especially into mid-latitude
35
locations in the southern hemisphere. There is some question of the utility of the SSC in tropical locations, but such
36
decisions must be based on the actual weather data from individual locations. Despite all of the strengths and
37
potential uses of the SSC, there are some research problems, some locations, and some datasets for which it is not
38
suitable. Nevertheless, the success of the SSC as a cross-disciplinary method is noteworthy because it has become
39
a catalyst for collaboration.
40
41
42
43
44
45
46
47
48
49
50
51
52
53
1. Introduction
55
One of the most comprehensive methods of air-mass categorization is the spatial synoptic classification
56
(SSC) system (Sheridan, 2002, Sheridan and Dolney, 2003). The current SSC was developed by Sheridan (2002) and
57
was referred to as “SSC2” because it stemmed from an extensive line of research initiated by Muller, Kalkstein, and
58
others in the late 1970s (Kalkstein et al., 1996, Lamb, 1972, Muller, 1977) that eventually led to an initial version
59
that is sometimes referred to as “SSC1” (see Hondula et al., 2014 for an in-depth history). A combination of
60
weather variables (air temperature, dew-point depression, wind speed, mean cloud cover, mean sea-level
61
pressure, diurnal temperature range, and diurnal dew-point range), is used to numerically characterize the state of
62
the atmosphere; these quantities are subsequently differentiated into weather-type categories, encompassing
63
variables that synergistically affect human health (Greene et al., 2011, Davis et al., 2003) and various ecological
64
systems (e.g., Frank et al., 2008a, Frank et al., 2008b).
65
The relative nature of the SSC daily weather-type classification scheme (i.e., weather-type definitions vary
66
across space and time) is a strength cited in many studies. The SSC has become one of the key analytical tools
67
implemented in a diverse range of climate and health research investigations that are location- and time-specific
68
(Hondula et al., 2014). Other areas of study that have benefited from analyses of SSC data include air-quality
69
variability (Davis et al., 2010, Pope and Kalkstein, 1996, Power et al., 2006, Rainham et al., 2005, Vanos et al.,
70
2014b), human health (Hajat et al., 2010, Vanos et al., 2014b, Vanos et al., 2015), the urban heat island (Dixon and
71
Mote, 2003), and climatological trend analyses (Hondula and Davis, 2011, Knight et al., 2008, Vanos and Cakmak,
72
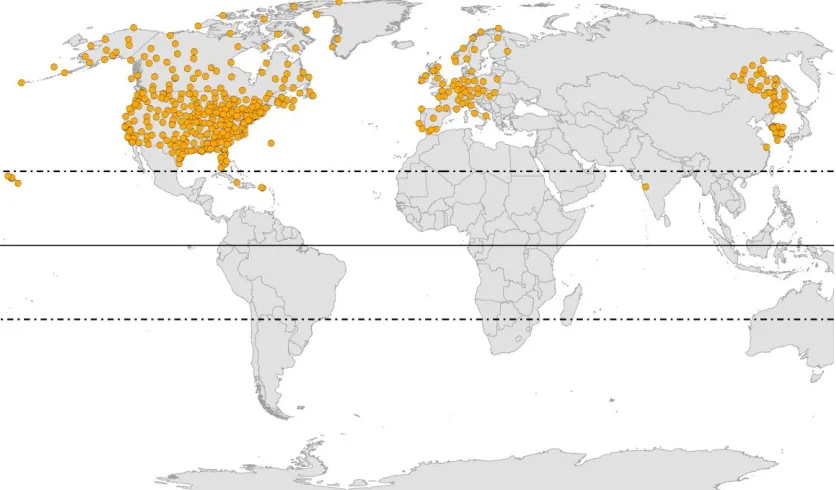
2014). Through these studies, we see the SSC is applicable to various topics in cross-cutting disciplines and has a
73
large geographical range, which includes approximately 400 stations (Figure 1) spanning the United States, Canada,
74
and Europe, and select cities in Asia with data covering several decades (Bower et al., 2007, Hondula et al., 2014,
75
Sheridan, 2002, Tan et al., 2004).
76
There are numerous opportunities to expand the application of synoptic-scale impact analyses to new
77
locations, contexts, and disciplines. In this article, we discuss the identified gaps in both the spatial nature of the
78
system and the disciplinary applications, providing critical information to researchers outside of the area of
79
climatology on where and how the SSC can be successfully applied. This review highlights synoptic climatology as a
80
82
2. Synoptic Climatology
83
a. Discipline Review
84
A goal of synoptic climatology is to understand the relationships between the surface environment and
85
overlying atmospheric circulation (Yarnal, 1993). With a horizontal scale of ~1,000 km and a lifespan of ~5–7 days,
86
cyclones and anticyclones, which are the main synoptic-scale features of the atmosphere, influence a wide range
87
of environmental processes including water resources, severe-weather outbreaks, and health. Accordingly,
local-88
scale analysis of weather often begins with a characterization of the synoptic-scale forcing processes. Such
89
atmospheric “snapshots” provide simple, useful descriptions that are designed to aid understanding of our physical
90
world.
91
In synoptic climatology, the classification scheme has been a primary focus of research efforts for many
92
decades. Multiple variables have been used to classify atmospheric patterns including temperature, pressure,
93
airflow, and derived properties such as vorticity (Barry, 2005, LeDrew, 1984). Additionally, these features are
94
classified at multiple spatial (e.g. global or regional) and temporal (e.g. annual or daily) scales. Discrete
95
classification of synoptic patterns allow synoptic climatologists to communicate with other disciplines so that
96
environmental relationships may be analyzed (Carleton, 1999). Only during the last two decades has the use of
97
synoptic climatology accelerated significantly as a tool for applications rather than pure classification (Sheridan
98
and Lee, 2013, Yarnal et al., 2001).
99
Synoptic climatological classifications often involve one of two approaches. The
circulation-to-100
environment approach emphasizes the atmospheric patterns. In this case, the overlying atmospheric scenario is
101
classified a priori and then related to the surface variable of interest (e.g., air temperature). In contrast, the
102
environment-to-circulation approach initially determines the environmental variable of study and then compares
103
its condition to the circulation pattern(s) (Yarnal, 1993).
104
Within the field of synoptic climatology, multiple classification approaches exist and may be subjective
105
(manual), objective/computer-automated, or hybrid. Manual map comparisons began very early (Abercromby,
106
1883, Lamb, 1950, van Bebber and Köppen, 1895), yet this method was subjective and labor-intensive (Frakes and
107
While the majority of subjective catalogs (Baur et al., 1944, Lamb, 1972) focus on regional analysis, some have
109
been developed for larger-scale considerations (Girs, 1948).
Recently, automated and hybrid classification
110
methods have been developed, and the discipline continues to evolve with the increased availability of weather
111
data and more complex climate models. There is no standard classification scheme, but rather, synoptic
112
climatology highlights the importance of interpreting map patterns and evaluating surface relationships. Huth et al.
113
(2008) provide further discussion on synoptic climatological approaches.
114
Along with increased computing ability, more sophisticated, statistically robust techniques for
115
classification have become increasingly common in synoptic climatology (Yarnal et al., 2001). In addition to
116
understanding basic circulation controls, statistical and dynamic modeling techniques are used to uncover the
117
patterns and near-surface processes related to a variety of environmental issues. Techniques such as cluster
118
analysis (e.g., Esteban et al., 2005) and self-organizing maps (Hewitson and Crane, 2002, Kohonen et al., 2001)
119
have helped re-shape the discipline. Globally-gridded reanalysis datasets (e.g., Dee et al., 2011, Ebita et al., 2011,
120
Kalnay et al., 1996) have led to the inclusion of more complex, derived variables such as vorticity and moisture
121
characteristics. Regional and global climate modeling now offer new approaches to examine the physical
122
mechanisms linking surface conditions with atmospheric circulation (Giorgi and Mearns, 1999).
123
124
b. Spatial Synoptic Classification
125
The Spatial Synoptic Classification (SSC) is a weather type classification based solely on surface
126
observations. To determine the SSC weather types for a given time and place, a hybrid system is employed using
127
both manual and automated processes. First, ‘typical’ meteorological conditions are chosen for each of the
128
weather types (Dry Polar [DP], Dry Moderate [DM], Dry Tropical [DT], Moist Polar [MP], Moist Moderate [MM],
129
Moist Tropical [MT], or Transition [TR]) at each weather station based on climatological knowledge. There is also
130
the MT+ subset of the MT weather type, which is common in the summer across the mid-latitudes, to differentiate
131
the days with the greatest potential for heat stress. The MT+ conditions occur when both morning and afternoon
132
apparent temperatures are above the MT weather-type means for the location (Sheridan and Kalkstein, 2004).
133
Sliding “seed days” representing each of the weather types are created for four two-week windows during each
134
and autumn for the given location (Sheridan, 2002). The sliding seed-day method permits an improved temporal
136
continuity across various climate types and throughout the entire year, encapsulating the temporally relative
137
nature of the SSC.
138
Actual conditions are then compared to the seed days and each day is classified as the weather type it
139
most closely resembles (lowest error score based on equal-weighted z-scoring). The groups of days identified as
140
certain SSC types are not completely homogeneous, as the synoptic-scale circulation is a complex process not
141
perfectly described by seven distinct groups. Meteorological variability is also identified within an SSC weather
142
type at various scales of interest dependent on the research (e.g., division of MT and DT days into categories of
143
higher or lower severity for heat stress (Sheridan and Kalkstein, 2004), division of TR days into categories
144
representing various frontal types (Hondula and Davis, 2011)). Complete details of the classification procedure can
145
be found in Sheridan (2002). SSC data are freely available online at http://sheridan.geog.kent.edu/ssc.html.
146
147
3. Spatial Synoptic Classification Uses
148
a. Temperature and Human Health
149
Among the wide range of potential applications for synoptic classification schemes, the SSC has gained
150
greatest traction in studies of the relationships between heat and human-health outcomes. SSC-based studies of
151
heat impacts on morbidity and mortality focus largely on the DT and MT+ weather types, often referred to as the
152
‘oppressive’ types (e.g., Isaksen et al., 2015, Saha et al., 2015). These oppressive days have been applied in the
153
development of several of the initial outcomes-based heat-health watch-warning systems deployed in the USA as
154
well as in Toronto (Canada), South Korea, Shanghai (China), and select Italian cities (Kalkstein et al., 2011, Kalkstein
155
et al., 2008, Kirchmayer et al., 2004, Sheridan and Kalkstein, 2004, Tan et al., 2004). More recently, the SSC and
156
related techniques have been applied to the study of additional health outcomes including respiratory-related
157
hospital admissions (Hondula et al., 2013, Lee et al., 2012), influenza and pneumonia mortality (Davis et al., 2012),
158
and cold-season cardiovascular deaths (Lee, 2015).
159
160
b. Air Pollution
161
research studies set in Canada, Korea, and the United States. To date, the main pollutants addressed have been
163
nitrogen dioxide (NO2), sulfur dioxide (SO2), carbon monoxide (CO), ozone (O3), and particulate matter < 2.5 μm
164
(PM2.5). Standard analyses segregate each day into a select weather type, and the individual mean air-pollution
165
levels are then calculated and statistically compared by weather type. Prior to the current SSC, Cheng et al. (1992)
166
completed the first SSC air pollution study using the SSC1 to assess concentrations of O3 and PM in the city of
167
Philadelphia. Following this, Pope & Kalkstein (1996) used the SSC1 to confirm associations between respirable
168
particles and mortality in the Utah Valley, and Smoyer et al. (2000) described relationships between weather, air
169
pollution, and mortality in Birmingham and Philadelphia (USA), also using the SSC1. Over the last 15 years, ambient
170
air pollution has been shown in over a dozen studies to be closely related to the SSC weather type (e.g., Davis et
171
al., 2010, Greene et al., 1999, Hanna et al., 2011, Kim et al., 2014, Rainham et al., 2005, Vanos et al., 2014a, Vanos
172
et al., 2013, Vanos et al., 2014b). The most commonly cited findings show a close association between higher
173
concentrations of O3 on DT days, specifically in the summer season (e.g., Davis et al., 2010, Hanna et al., 2011, Kim
174
et al., 2014, Rainham et al., 2005, Rainham et al., 2001, Smoyer et al., 2000, Vanos et al., 2013). Further, Vanos et
175
al. (2014b) found that when DT air is present in Canada, other pollutants, such as NO2 and SO2, are significantly
176
higher than the mean for all weather types. The stagnant, dry, sunny, and hot conditions found within the DT
177
weather type result in the greatest pollution build up for many pollutants and aid in the photochemical creation of
178
ozone (Davis and Kalkstein, 1990, Smoyer et al., 2000). Low concentrations of pollutants have been generally
179
found in moist, cool weather types (e.g., Greene et al., 1999), as well as the TR weather type (e.g., Rainham et al.,
180
2005, Vanos et al., 2013). TR days are indicated by shifts in synoptic conditions and are commonly associated with
181
frontal activity (increased wind and precipitation chances), thus resulting in lower air-pollution levels. Newer
182
research also links higher aeroallergen levels to the presence of MT and DT weather types in 10 Canadian cities
183
(Hebbern and Cakmak, 2015).
184
185
c. Climate Change
186
The potential impacts of climate change on human health have been assessed by applying
weather-type-187
mortality relationships derived from the present climate to SSC types projected by global climate models (GCMs).
188
USA, with subsequent analysis of each city’s mortality risks (Kalkstein and Greene, 1997). This analysis was later
190
updated by Greene et al. (2011) to estimate mortality during excessive heat events (EHEs) for the 2020s, 2050s,
191
and 2090s across 40 cities in the USA. An application of the SSC by Hayhoe et al. (2010) showed that a 2003
192
European Heatwave-type event could occur in Chicago by 2050, with a high likelihood of 10 times the city’s current
193
annual average number of heat-related deaths occurring in only a few weeks. In a rare application of
synoptic-194
weather typing to assess climate-change impacts outside of the US, Cheng et al. (2008) showed that heat-related
195
mortality could more than double by the 2050s and triple by the 2080s in south-central Canada. The most recent
196
application of the SSC in climate-change impacts assessmentprojected future weather types for California for the
197
2090s and estimated that heat-related mortality among those over 65 could increase by tenfold in major urban
198
centers (Sheridan et al., 2012a, Sheridan et al., 2012b).
199
200
d. Other SSC Uses
201
The utility of the SSC has not been limited to topics related to human health and the associated impacts of
202
climate change. Researchers have applied the SSC types to discriminate days that are hot vs cold, arid vs humid, or
203
synoptically active vs inactive. Almost immediately following Sheridan’s (2002) release of the updated SSC, a few
204
researchers employed the system as an efficient proxy for air-mass types, which were not historically easy to
205
quantify for most locations (Dixon and Mote, 2003, Grundstein, 2003, Kalkstein and Balling, 2004, Leathers et al.,
206
2004, Leathers et al., 2002). While some of these projects were focused on how SSC types affect snow cover and
207
characteristics (Grundstein, 2003, Leathers et al., 2004, Leathers et al., 2002), one paper showed that SSC types
208
could be used to understand summer thunderstorms initiated by the urban heat island (Dixon and Mote, 2003).
209
Kalkstein and Balling (2004) then used the SSC to analyze diurnal temperature range following the attack on the
210
World Trade Center in New York on 11 September 2001. Hence, very early in the life of the SSC, it was becoming
211
apparent that the system would have widespread applicability in weather and climate research.
212
Following the initial burst of authors using SSC for applied climatology research, subsequent papers were
213
largely related to weather and health, with further studies addressing urban effects on weather (Brazel et al., 2007,
214
Chow and Svoma, 2011, Ellis et al., 2015) and diurnal temperature ranges (Scheitlin, 2013, Scheitlin and Dixon,
215
“benign” days, which is important when studying convection, lightning, and other meteorological phenomena that
217
are driven by thermal instability rather than dynamic forcing (Ashley et al., 2012, Bentley et al., 2010, Bentley et
218
al., 2012, Owen and Dixon, 2015, Stallins et al., 2013, Haberlie et al., 2015, Mote et al., 2007, Shem and Shepherd,
219
2009). Similarly, some researchers have discovered the utility of the SSC to efficiently analyze weather conditions
220
as they relate to tree growth (Huang et al., 2010, Senkbeil et al., 2007) and wildlife behavior (Esslinger et al., 2015,
221
Palumbo et al., 2015). Our discussion of articles using the SSC is not exhaustive, but it is clear that SSC is continuing
222
to grow in popularity among researchers studying weather-health interactions as well as several other
223
applications, mostly within applied climatology.
224
225
4. Limitations of SSC Methods
226
The previous sections demonstrate many opportunities to apply the SSC, and it appears that such
227
opportunities will continue to grow. Therefore, we propose a goal for the SSC of being accessible and applicable for
228
all possible uses where it has been shown to function well. This could mean establishing an SSC for all regions of
229
the world, but that is not currently feasible due to a lack of reliable weather data (Hondula et al., 2014). There are
230
many locations with reliable weather data but no SSC, and there is also a question of whether all climate types are
231
conducive to daily classification by the SSC. Likewise, not all research topics involving synoptic weather variables
232
can benefit from the SSC or synoptic classification systems in general. Here, we address some known limitations
233
and challenges so that researchers from various disciplines can better understand and effectively apply the SSC to
234
benefit their research goals.
235
236
a. Limitations in Temperature-Health Research
237
With its synoptic-scale resolution, the SSC is not designed to describe human exposure to thermal stress
238
at microscale levels. This is a limitation from the physiological perspective as behavioral factors, metabolic rate,
239
and clothing properties are not currently considered. In this sense, it could be argued that the SSC system is not
240
yet applicable as a heat-stress index for estimating thermal strain in individuals (NIOSH, 1986, Parsons, 2003).
241
There are, however, many pre-existing heat-stress indices that have been designed for the workplace to establish
242
With respect to environmental epidemiology, the SSC offers a considerable shift from many of the
244
traditional and emerging techniques applied to investigate the association between temperature and mortality, in
245
which continuous variables (e.g., temperature, heat index, Universal Thermal Comfort Index (UTCI)) tend to be
246
used in statistical models (e.g., McMichael et al., 2008, Anderson and Bell, 2009, Urban and Kyselý, 2014, Petitti et
247
al., 2015). The association between exposure variables and health outcomes in these models has been shown in
248
many places to be a smooth, non-linear function. Mapping discrete variables like the SSC weather types into this
249
continuous exposure-response space would seem to be a challenge (Barnett et al., 2010, Huang et al., 2011).
250
Operational heat-health warning systems designed around the SSC, however, include linear regression functions
251
within the subset of days associated with each weather type that allow for continuous prediction of anomalous
252
mortality (Sheridan and Kalkstein, 2004). Whether the current algorithmic approach utilized by these warning
253
systems most effectively accounts for within SSC-type variability is an outstanding research question that we
254
recommend investigating in the years ahead.
255
Evaluation of trigger indicators for heat-health early warning systems is recommended by the World
256
Health Organization and World Meteorological Organization and should take into account system complexity, error
257
in weather forecast data, and acceptability among user groups (Åström et al., 2014, McGregor et al., 2010). In an
258
evaluation of the predictive capacity of four different triggering criteria for heat warning systems (including an
SSC-259
based approach) in four different cities worldwide, Hajat et al. (2010) found that no system was recommended to
260
be universally preferable. Other studies from Detroit and New York City in the USA suggest that relatively simple
261
metrics like minimum temperature and maximum heat index perform comparably to more complex models,
262
including the SSC, therefore, the simpler triggering criteria were deemed preferable for their locations (Metzger et
263
al. 2010, Zhang et al. 2012). Urban and Kyselý (2015) also encouraged continued comparison of the current SSC
264
framework to other approaches for triggering operational heat warning systems, including different methods
265
based on sequences of SSC types.
266
These comparative studies are of interest because they represent the incorporation of different
267
perspectives into the design of heat-health warning systems. For example, Hajat et al. (2010) connected research
268
groups from academic institutions and government research offices across five different countries. The SSC and its
269
included in the design of effective triggering criteria. Whether or not the SSC is ultimately used as the basis for
271
triggering a public health alert is, for us, less interesting than the idea that its consideration, along with alternatives
272
ranging from simple environmental variables (e.g., temperature) to complex, biophysical indices (e.g., UTCI), can
273
expand how researchers and practitioners think about designs of heat-health warning systems.
274
275
b. Limitations in Air-Pollution Studies
276
Air-pollution and health studies conducted in the 20th century supported the development of public
277
warning systems when potentially harmful pollution was likely due to synoptic conditions (e.g., Smoyer et al.,
278
2000). Yet, even with technological advancements and numerous studies showing connections between SSC
279
weather types and air pollution, few studies have attempted to produce such SSC-based forecast models.
280
Investigations of spatiotemporal connections between air pollution and synoptic weather generally stop short of
281
providing a physical explanation. Rather, most research yields mean levels of air pollution for each SSC weather
282
type before proceeding with health-outcomes-based approaches.
283
A potential reason for difficulty in using the SSC for air pollution forecasting is the complexity in
284
determining the origin of air pollution. Weather types alone cannot be used to identify source regions of pollutants
285
(Hondula et al., 2010); different circulation regimes can result in the same SSC designation at a given location.
286
Certain DM days, for example, could advect pollutants from a problematic source region or be more conducive
287
(e.g., warmer, sunnier) to the formation of secondary pollutants than other days, but such variability would be lost
288
by simply examining overall differences between SSC types. Indeed using the SSC to supplement back-trajectory
289
analysis has revealed interactive relationships that are not evident from using only the back-trajectory or synoptic
290
analytical method (Davis et al., 2010, Hondula et al., 2010).
291
Changing concentrations of ground-level pollution is driven by the variables often used to characterize air
292
masses and weather types (e.g., temperature, pressure, wind, sunlight), which provides the physical underpinning
293
to explain why studies examining SSC-air pollution linkages often report strong associations. These results are
294
quite intuitive, yet highly generalized as they differ by pollutant of interest, location, and time of season. Further,
295
high concentrations and variability of air pollution (Smoyer et al., 2000). Hence, careful consideration and analysis
297
is still required when using SSC to assess and/or predict air pollution.
298
299
c. The Challenges of SSC outside the Mid-Latitudes
300
A map of SSC locations (Figure 1) highlights the absence of SSC locations in tropical, desert, and
301
developing locations, with a distinct lack of stations in the southern hemisphere. Access to reliable weather data is
302
challenging in many developing countries, so there is little that can be done to remedy that in the near term. There
303
is still a question of whether the SSC provides as much value in tropical and/or desert locations that are less likely
304
to experience synoptic-scale frontal passages and the associated sudden air-mass changes. Such locations often
305
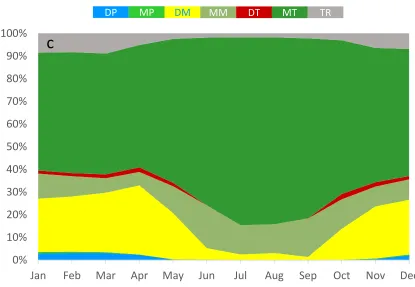
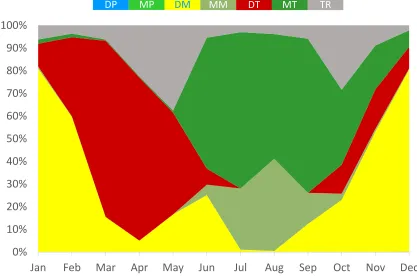
experience the same synoptic weather types for months at a time. For example, Miami, Florida (USA) experiences
306
the MT weather type on 65% of days annually and 80% of summer days (Figure 2). It is certainly feasible to break
307
down those climates into SSC types that are relative to specific locations, but it may not be very useful if the air
308
temperature differences between DT and MM SSC types are only a few degrees. Further, some current SSC
309
locations along the southern tier of the USA never experience as many as three of the seven possible categories
310
during long periods. Frequency distributions of SSC types throughout the year for select SSC locations (Figure 2)
311
illustrate that mid-latitude locations tend to experience all SSC categories in every season while sub-tropical
312
locations are unable to fully take advantage of the seven SSC categories. We encourage continued investigation of
313
the relationship between SSC weather types and synoptic-scale circulation regimes in these locations to determine
314
if there is within-SSC-type heterogeneity that may be valuable to capture in new tools that aid the fields of
315
climatology and applied climatology.
316
A noteworthy example of a tropical SSC location that is also in a developing country is Pune, India (the
317
only location in India; Figure 1). Previous research has shown associations between temperature and human health
318
in rural parts of Pune District (Ingole et al., 2012), therefore, the authors of this manuscript collaborated (along
319
with the help of others, including Scott Sheridan) to develop the SSC for the city of Pune to work toward improved
320
weather-health research in India and an expanded network of SSC stations. One concern among developers was a
321
lack of the usual four seasons as Pune is dominated by the Asian monsoon, resulting in just three discernible
322
diurnal temperature ranges can often exceed 20 °C during summer and winter. However, interseasonal differences
324
are much less dramatic with mean monthly temperatures all within 10 °C of each other, and it is debatable
325
whether Pune ever experiences weather types that are truly Polar (e.g., Pune has never officially recorded a
326
temperature below freezing). There is the possibility that the SSC can ultimately prove useful in a location even if
327
some of the categories are never experienced, but only if it helps to understand and/or predict weather-related
328
effects on non-atmospheric variables, such as health and ecology. Researchers are currently working to test
329
associations between SSC and health outcomes in locations like Pune.
330
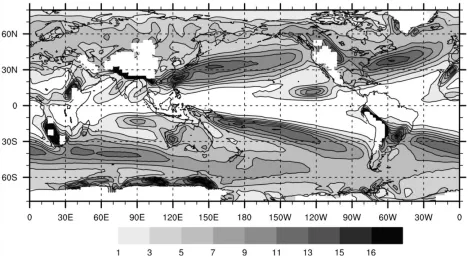
While confirming the lack of synoptic frontal activity across much of the land located within the tropics,
331
Berry et al. (2011) show that some tropical regions do regularly experience fronts (Figure 4). It is probably not
332
prudent to describe large regions of the planet as being “good” or “bad” candidates for SSC stations without a
333
thorough review of the climatology of the locations in question, but it does appear that some locations would fail
334
to make enough use of the SSC categories to justify creating them.
335
336
5. Advantages and Opportunities
337
The SSC has been relatively under-utilized in the assessment of climate-change impacts, both in terms of
338
the region of application (most studies have been focused on the USA) and with respect to impacts being assessed
339
(most focus on human health). Thus a unique opportunity exists to explore numerous climate-change impacts
340
around the world using the SSC. GCMs output climate variables required to develop SSCs on a grid covering the
341
globe at resolutions as fine as 25 km (Roberts et al., 2014), so there is potential for applying the SSC to assess
342
impacts in many regions of the globe. There is also potential to use the SSC to assess impacts such as (but not
343
limited to): water stress, food security, energy demand, wildfires, and crop yields. These impacts typically occur
344
across spatial domains similar to that of the SSC. These vital outcomes are similar to human health as their statuses
345
also depend on multiple, often simultaneous, weather variables in addition to human decisions. Given the success
346
of using SSC to study human-health outcomes, the issues listed above are likely to benefit from SSC analyses as
347
well. In any case, comparison and evaluation between techniques should provide a framework for new
348
Human-weather interactions are dynamic and complex because an individual’s response, both
350
physiological and behavioral, can alter the level of exposure, which determines their well-being, health, or even
351
survival. This interaction and any resulting physiological strain can be defined by six factors or agents (Fanger,
352
1970):
353
1) ambient air temperature
354
2) air motion or wind velocity
355
3) relative humidity
356
4) mean radiant temperature
357
5) metabolic heat production of the body
358
6) the clothing worn and its insulation and moisture permeability
359
The first four of these agents are environmental and they should all be considered when assessing the thermal
360
influence of the environment on the human body (Höppe, 1999), while the remaining two are behavioral. There is
361
much debate and research surrounding which human thermal index is superior at predicting the human
362
experience in a given environment. Difficulties arise when accounting for the complexity and interactions of all six
363
factors. It has even been suggested that there cannot be a universal system for rating thermal stress (Belding,
364
1970, Epstein and Moran, 2006). In this sense, there may be an advantage to using a system, such as the SSC, that
365
describes well the four climate variables and does not attempt to assume how humans may behave. Future work
366
on the SSC system might advantageously consider behavioral factors (particularly varying levels of metabolic heat
367
production) with respect to heat-health warning systems to determine how a weather type impacts humans
368
performing varying levels of physical activity.
369
Air temperature alone is frequently used to assess the impact of the climatic environment on human
370
health (Hondula et al., 2014, Parsons, 2003) even though air temperature is seldom the lone cause of heat stress
371
(Goldman, 2001). Such a reductionist approach can limit our understanding of human-weather interactions. High
372
humidity significantly increases heat stress by lowering the efficacy of evaporative heat loss (achieved via
373
sweating), which is the primary human mechanism for heat loss under warm–hot conditions (Havenith, 1999,
374
Parsons, 2003). Similarly, increased air velocity (wind) enhances both convective and evaporative heat loss
375
environment and the human body, and can significantly contribute to heat stress, matching the heating effect of
377
air temperature when air velocity is minimal (Höppe, 1999). Thus, consideration of all four environmental factors
378
and their interactions is essential in accurately describing the relationship between human health and the climatic
379
environment. In this respect, the SSC and its comprehensive integration of meteorological parameters (air
380
temperature, dew point, wind velocity, pressure, and cloud cover as a proxy for radiation) provides a meaningful
381
and insightful description of climatic variables while combining them into one index, which is more manageable for
382
subsequent epidemiological analyses.
383
A likely advantage of using the SSC for epidemiological and physiological research is its location and time
384
specificity because weather-health interactions vary seasonally and geographically due to thermal acclimatization
385
and adaptation strategies. For example, at the end of winter, a population may be more vulnerable to a sudden
386
hot day. Further, populations in extreme climates are more resilient to weather variability than those in temperate
387
regions due to adaptation strategies (behavioral responses, clothing, housing, technology, etc.). The spatial
388
resolution of the SSC is suitable to characterize the climate sensitivity or vulnerability of different socioeconomic
389
groups (Kalkstein and Davis, 1989). Such characterization is important in understanding key modifiers that affect
390
the interaction between human health and climate.
391
392
6. Conclusions
393
Ultimately, there are three closely related goals in this area of research: increase cross-discipline
394
research, increase knowledge and awareness of SSC, and increase geographical locations with available SSC data.
395
The success of any of these three goals seems to depend heavily on the progress of the other two, so working
396
toward one is indirectly equivalent to working on all of them. There will be challenges in expanding the SSC
397
network and the demand for SSC data in many parts of the world that have been underserved thus far. However,
398
history suggests that there will be “tipping points” where it becomes quite efficient to increase the number of SSC
399
stations in a country after the first few are established, and these bursts of new data will likely be accompanied by
400
newfound interest in those data by regional researchers. It also seems quite likely that the SSC is simply not
401
this is an area of potential future research that could lead to improved synoptic classification methods and/or
403
weather-health assessment tools.
404
Application of the SSC, or any synoptic weather analysis tool, in other disciplines often involves the
405
introduction of an analytical approach (i.e., synoptic classification) that will be unfamiliar to subject experts. This
406
situation can potentially create confusion, disagreement, and competition among researchers who ultimately have
407
shared questions and goals. We suggest, however, that such blending of ideas can lead to a productive scientific
408
advancement. The application of the SSC to temperature-related mortality is a fertile ground for such
cross-409
perspective discussions that has only recently begun to appear in the scientific literature. There have been several
410
conference sessions, workshops, and collaborative research projects available in recent years for researchers to
411
learn more about the SSC and its potential applications. Such opportunities should be less about learning a specific
412
tool (i.e., the SSC) and more about learning to embrace the methods, perspectives, and goals of other disciplines.
413
The simplicity of the SSC categories makes it a great catalyst for crossing disciplinary boundaries and making
414
meaningful progress toward solving real environmental problems, but it cannot be applied in all scenarios. It would
415
be a great compliment to those who developed the SSC over the years if cross-discipline researchers beyond
416
climatology find common ground in their past use of the SSC. In the past several years, the SSC has been applied to
417
numerous research topics including human health, urban heat islands, tree growth, wildlife behavior, and climate
418
change, and there are some obvious areas of overlap between these study topics that might lead to future
419
collaborations. It is conceivable that the SSC could become a potential gateway to interdisciplinary efforts
420
connecting weather, climate, human health and ecology.
421
422
423
424
425
426
427
428
References