Urban Sprawl Analysis using GIS - A Case Study
of Srinagar City
Mir Mohd Burhan Hassan
Department of Civil Engineering, Vellore Institute of Technology
Abstract: Srinagar city – the summer capital of Jammu and Kashmir, is one of the largest and fastest growing urban centers in the Himalayan region in India. The city falls in Zone V [Indian Standard 1893 (Part 1) 2002], the highest-risk earthquake zone, leading to restrictions on the vertical expansion of the city. This has in turn further catalyzed the encroachment of land for agriculture, commercial and residential purposes. With the population growing 12 times and the area 23 times from 1901 to 2011, there is an immediate need to manage the growth of the city to prevent the overburdening of resources and amenities in the city. This study attempts to visualize and analyze the growth pattern or sprawl of the built-up area of the city from 1992 to 2017 and forecast the scenario of 2020. Shannon’s entropy approach is used to assess whether the built-up area is dispersed or concentrated. The study reveals that the built-up area increased from 35 km2 in 1992 to 80 km2 in 2017. Hence, over a period of two decades, the urban settlement has meteorically increased in size. This rapid development also raises concern over justifiable use of resources and sustainable development. The Shannon’s entropy value for 1992 was 1.9 and that for 2017 was 2.27. According to the Shannon’s entropy value for built-up area, the built-up area in Srinagar has become more scattered and sporadic. By 2020, the city population is expected to increase to 1,448,896 while the built-up area is expected to cross 90 km2. The city is expanding at a rate that is not commensurate with the development of basic amenities and infrastructure. The study highlights the unplanned growth that Srinagar has witnessed due to the rapid pace of development that might prove to be unsustainable if apposite steps are not taken.
Keywords: Urban sprawl, built-up area, Shannon entropy, GIS, Remote sensing
I. INTRODUCTION
India is one of the most populous countries in the world. The rapid urbanization and growth in India are evident from growth of its urban populous from 79 million in 1961 to 285 million in 2001, inhabiting over 5000 urban settlements [1, 2]. The urban population is estimated to grow to from 377 million in 2011 to 533 million in 2021 [3]. However, uncontrolled growth and unplanned expansion lead to emergence of cities that often lack basic infrastructure and amenities. The growth of cities along the peripheries, often referred to as urban sprawl, can be along rivers, roads, around markets and so on. Urban sprawl is a complex phenomenon guided by social, economic, geographic, demographic and political factors. Leading to the conversion of non-up area to built-up area, urban sprawl causes loss of agricultural land, wetlands, water resources, increased stress on ground water resources and other environmental issues. The subsequent increase in the non-permeable area also leads to greater of run-off from precipitation, which in turn hinders the regeneration of ground water levels [4]. Since urbanization is an unavoidable process, it is very crucial to study the growth pattern of settlements in order to suggest likely future directions of growth and hence help plan for sustainable development of cities. The study of urban sprawl can be done effectively using Remote Sensing and GIS.
Remote Sensing refers to collection data about something without making physical contact. Remotely captured images from sensors onboard aircrafts and satellites find use in diverse fields such as military, planning, commercial, hydrology, meteorology and so on. Remote sensing can either be active or passive. In active remote sensing, sensors emit light of certain wavelength that interacts with the target, gets reflected back and captured by the sensor again. Whereas, in passive remote sensing, the sensors only capture reflected radiation form the target, reflected sunlight being the most commonly captured. These remotely captured images are analyzed and visualized using GIS.
Geographical Information System (GIS) is a framework that helps to capture, manipulate, store, analyze and visualize spatial data. GIS, augmented with remote sensing, can provide deeper insight into spatial data. With the burgeoning of remote sensing technologies, GIS is increasingly being used in planning, decision-making, location-based services, agriculture, business, surveillance and many more fields.
different time series. Nevertheless, due to the dependence of sprawl on an amalgam of social, economic, demographic, political and other factors, there is no specific way to analyze urban sprawl. The ambiguity of the very definition of urban sprawl has led to various approaches to the analyses and consequences of urban sprawl. In recent times, the Shannon’s entropy approach has been used to analyze the growth of urban centers. The Shannon’s entropy approach asserts an increase in landscape disorganization with sprawl. This disorganization is marked by the existence of urban land is rural settings, making the rural landscape non-homogeneous. The Shannon’s entropy values help to assess the sprawl as concentrated or dispersed. The change in the entropy value over a period of time helps to understand the growth pattern of the city. This study aims to evaluate the growth pattern of Srinagar city from 1992 to 2017 using Shannon’s entropy approach.
II. STUDYAREA
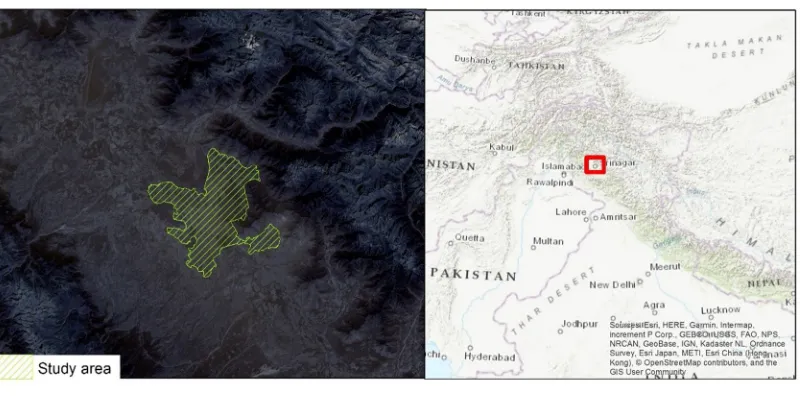
[image:2.612.113.513.262.460.2]The study was conducted on Srinagar city, which is the summer capital of the state of Jammu and Kashmir. It is one of the largest and rapidly growing urban centers in Himalayan region. The study area extends from 74°43’ to 74°52’ E and 34° to 34°14’ N. The city lies on the either sides of the river Jhelum. The city falls in Zone V [Indian Standard 1893 (Part 1) 2002], the highest-risk earthquake zone.
Fig. 1. Study area
There are numerous wetlands and lakes around the city, which have faced severe encroachment over the years. The city experiences an average annual temperature of 13.6°C and receives an annual precipitation of 693 mm. According to the 2011 census, the city has a population of 12.2 lacs with a male to female ratio of 1:0.85 and an average literacy rate of around 70%. Considering the fact that the population of the city has grown 12 times and the area 23 times from 1901 to 2011, the study of urban sprawl is quite significant.
III.DATACOLLECTED
Remotely sensed Landsat images of Srinagar (path 149, row 36) for both 1992 and 2017 are used in the study. The image used for 1992 is a Landsat 5 orthorectified TM image, captured on 15 October 1992, while the image used for 2017 is a Landsat 8 OLI/TIRS image, captured on 4 October 2017. Both the images are free from cloud cover and have excellent quality. The study area was further extracted from the images using the Srinagar city boundary shapefile. Furthermore, the population of the city from 1901 to 2011 is obtained from the Census of India 1901-2011 to cross-examine the rates of growth of population and built-up area, and forecast the population and built-up area for 2020.
IV.METHODOLOGY
The remotely captured Landsat images are analyzed using ArcGIS. The study area is extracted from the Landsat images using the Srinagar city boundary shapefile. The normalized distribution built-up index (NDBI) is used to classify the study area into built-up and non-built-up area, which is given by the following raster algebra:
Further, to analyze pattern of distribution of the built-up area, the Shannon’s entropy approach is used. Multiple buffer zones (1 km) are formed to cover the whole study area. The built-up area falling within each zone is extracted and their area is computed [5]. The Shannon’s entropy value for the built-up area is then calculated for both images according to the following formula:
= −∑ (2)
Here Pi is the probability of the built-up in the ith zone and n is the total number of zones. The probability Pi for the ith zone is the
ratio of the area of built-up in the ith zone and the total area of the ith zone. The entropy values range from 0 to ln(n). If the entropy value is close to 0, then the built-up distribution is compact and if it is close to ln(n), then the built-up distribution is dispersed. The population data from the census is analyzed and used to forecast the future population of the city in 2017 and 2020. The population forecast is done using appropriate trendline. To forecast the built up in 2020, the built-up area per lac (built-up area per 100,000 people) people is used as a metric. The built-up area per lac people for 1992 and 2017 is calculated and assuming a linear trend in the metric, the value for 2020 is also calculated. Then, using the forecasted population of 2020 and the built-up per lac for 2020, the total built-up for the year 2020 is predicted.
V. RESULTSANDDISCUSSION
The results show that the built-up area has increased from 35.9 km2 in 1992 to 83.1 km2 in 2017. This increase in the built-up area has occurred at a rate of 5.26% annually. The Shannon’s entropy value increased from 1.9 to 2.27 in the same duration. The entropy value in 2017 is closer to ln(n) value as compared to the entropy value in 1992. Given that the Shannon’s entropy value has increased and is closer to upper limit value, i.e. ln(15), it can be concluded that the built-up area has become more scattered over time. The city has expanded in the North and South directions considerably. The suburban areas have witnessed the most sprawl.
TABLEI
BUILT-UP AREA AND SHANNON’S ENTROPY VALUE IN1992 AND 2017
Year Built-up area (km2) Entropy Value ln(n) ln(n) - Entropy
1992 35.98 1.9 2.56 0.66
2017 83.15 2.27 2.7 0.43
Fig. 3. Buffer zones for built-up area in 1992 and 2017
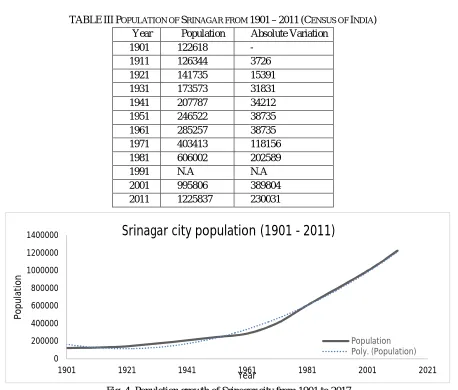
TABLEIIIPOPULATION OF SRINAGAR FROM 1901–2011(CENSUS OF INDIA)
Fig. 4. Population growth of Srinagar city from 1901 to 2017
The trendline equation for the population data, with x as the year, is as follows:
= 133.74 −513690 + 4.9339∗10 (3)
Thus, the predicted population for 1992 is found out to be 808,400. In addition, the forecasted population for 2017 is 1,370,240 and
0 200000 400000 600000 800000 1000000 1200000 1400000
1901 1921 1941 1961 1981 2001 2021
P
o
p
u
la
ti
o
n
Year
Srinagar city population (1901 - 2011)
Population Poly. (Population)
Year Population Absolute Variation 1901 122618 -
[image:4.612.83.541.266.656.2]Using the built-up area and population for 1992 and 2017, the built-up area per lac people is calculated. The built-up area per lac people increases from 1992 to 2017. Assuming that this metric further increases in a linear fashion, the built-up per lac people for the year 2020 is found out to be 6.26. With a forecasted population of 1,448,896 and built-up per lac people as 6.26, the estimated total built-up area for Srinagar in the year 2020 is 90.7 km2.
TABLEIIIII.BUILT-UP PER LAC PEOPLE (KM2/LAC)
Year 1992 2017 2020
Built-up per lac people (km2/lac) 4.45 6.07 6.26
The migration of people from rural areas in search of better opportunities has resulted in the rapid increase in population of the city. In addition, suburban areas have seen significant development because of their proximity to both the urban and rural areas [6]. The suburbs have been preferred for residential purpose as they, while being away from the hustle and bustle, are still at a motorable distance from the city. The sprawl, through encroachment of agricultural and horticultural land, has led to sporadic emergence of built-up area in non-urban areas. The wetlands of the city are also facing huge crisis due to encroachment coupled with siltation. Due to the shrinking of the wetlands, the city is at greater risk of flooding as well. Expansion of residential, industrial and commercial areas has put greater stress on the environment, as is evident from the increasing levels of pollution of the world-famous Dal Lake and the Jhelum river that are at the heart of the city. Due to the sprawl, the intrusion into the wildlife regions like Dachigam and other areas of Zabarwan, has led to increasing cases of human-wildlife conflicts [7]. If the sprawl continues to increase at such a pace without planning, monitoring and management, the development of the city would prove to be unsustainable.
VI.CONCLUSION
Rapid and unplanned urbanization in cities is a cause for concern due to numerous adverse impacts on the surroundings and the dwellers. Urban sprawl, a complex phenomenon, leads to the intrusion of built-up area into rural and sub-urban areas. In order to avert the harm from uncontrolled urban sprawl, there is an emerging need to analyze, predict and manage the pattern of urban sprawl. Remote sensing and GIS have proven to be extremely useful in assessing and visualizing the growth of cities and have the potential to help manage the growth of cities. Shannon’s entropy is one of the recent approaches to analyze the pattern of sprawl exhibited by a city. The Shannon’s entropy value brings to light the haphazard, scattered and unplanned development of Srinagar city. The Shannon’s entropy values assert that the built-up in Srinagar has become more scattered over the time since 1992 as the entropy value in 2017 is greater than in 1992. The built-up area has increased from 35.9 km2 in 1992 to 83.1 km2 in 2017, at a rate of 5.26% annually. By the year 2020, the population is expected to reach 1,400,000 and the built-up to be over 90 km2.
With the city expanding at such uncontrolled rate, the development would prove to be evanescent and unsustainable. It is therefore essential to ensure development while keeping the harm to the ecosystem at the bare minimum to achieve sustainable development. This can be achieved by monitoring, analyzing and predicting the behavior of sprawl of the city using reliable data. There is also a necessity of pertinent policies that regulate the growth of urban areas and stifle the encroachment of critical environmental resources. The effective integration of all the stakeholders is vital to facilitate sustainable growth of the city.
VII. ACKNOWLEDGEMENT
The author would like to express gratitude to the Department of Geography and Regional Development, Kashmir University for providing the required data and imagery and allowing the use of the resources available in the Remote Sensing and GIS laboratory. The author also thanks Prof Hakim Farooq Ahmad for his timely advice and inputs.
REFERENCES [1] Census of India, "Primary Census abstract," New Delhi, 2001.
[2] Census of India, "Provisional population totals," New Delhi, 2011.
[3] A. Rahman, S. P. Aggarwal, M. Netzban and S. Fazal, "Monitoring urban sprawl using remote sensing and GIS techniques of a fast growing urban center, India," IEEE Journal of selected topics in applied earth observations and remote sensing, 2011.
[4] S. Patra, S. Sahoo, P. Mishra and S. C. Mahapatra, "Impacts of urbanization on land use /cover changes and its probable implications on local climate and groundwater level," Journal of Urban Management, 2018.
[5] J. Deka, O. P. Tripathi and M. L. Khan, "Urban growth trend analysis using Shannon Entropy apporach - A case study in North-East India," International Journal of Geomatics and Geosciences, 2012.