Munich Personal RePEc Archive
Mind the Gap: Analyzing the impact of
data gap in Millennium Development
Goals’ (MDGs) indicators on the
progress towards MDGs
Jacob, Arun
10 June 2016
Online at
https://mpra.ub.uni-muenchen.de/73357/
Mind the Gap: Analyzing the impact of data gap in
Millennium Development Goals’ (MDGs) indicators on the
progress towards MDGs
∗Arun Jacob†
This version: June 2016
PLEASE DO NOT CITE WITHOUT AUTHOR’S PERMISSION
Abstract
This paper analyses the impact of data gap in Millennium Development Goals (MDGs)
performance indicators on actual performance success of MDGs. Performance success, within
the MDG framework, is quantified using six different ways proposed in the existing literature,
including both absolute and relative performance and deviation from historical transition
paths of MDG indicators. The empirical analysis clearly shows that the data gap in
perfor-mance measurement is a significant predictor of poor MDG perforperfor-mance in terms of any of
the six progress measures. Larger the data gap or weaker the performance measurement
sys-tem, lesser is the probability of MDG performance success. The empirical methodology used
in the paper combines a Heckman correction and instrumental variable estimation strategies
to simultaneously account for potential endogeneity of the key data gap variable and bias
due to sample selection. This result holds true even after controlling for overall national
statistical capacity and a variety of socioeconomic factors. The paper underlines the need to
strengthen the performance measurement system attached to the 2030 Agenda for
Sustain-able Development and the associated SustainSustain-able Development Goals (SDGs). This paper is
the first attempt at empirically evaluating the value of data in the context of international
development goals and gives empirical evidence for the need to harness the ‘data revolution’
for sustainable development.
Keywords: Millennium Development Goals (MDGs); the 2030 Agenda for Sustainable
De-velopment; Sustainable Development Goals; performance indicators; performance
measure-ment; value of data; International Linkages to Developmeasure-ment; Role of International
Organiza-tions ; Government Expenditures and Welfare Programs ; Project Evaluation; Public Policy;
∗Thanks Jean-Louis Arcand, Thilo Klein, Steve MacFeely, Maria Ann Mathew, Ugo Panizza, Leslie Rae, Julia
Seier-mann, Jean-Pierre Tranchant, Jan Vandemoortele, Richard Varghese, the OECD PARIS21 secretariat, and participants at research seminars for helpful suggestions and comments. All errors are mine. The views expressed in this publi-cation are personal and need not reflect the views of the United Nations or its member states.
†United Nations Conference on Trade and Development (UNCTAD) & Department of Economics, The
Monitoring methodology
1
Introduction
‘You can’t manage what you don’t measure’
W. Edwards Deming & Peter Drucker
The Millennium declaration1, signed by 189 countries, including 147 Heads of States, marked a watershed moment in the course of international development. The momentum generated by the declaration resulted in the formulation of Millennium Development Goals (MDGs). Eight MDGs, 21 targets and 60 associated indicators, became ensconced as the yardstick of develop-ment within the policy parlance 2. Weiss et al. [2009] states that the MDGs were among the most important UN ideas that changed the world. The MDGs expire in 2015 and the world has already adopted an ambitious 2030 sustainable development agenda. The Sustainable Develop-ment Goals (SDGs), a central component of this new agenda, comprise of larger number of goals (17) and targets (169) and a much larger set of indicators to measure progress towards these goals and targets3. Discussions are currently underway on the elements of its implementation
and monitoring framework and the nature of indicators that would accompany the SDGs. At this juncture, it is important to derive relevant lessons from the MDG implementation experience that would help in the implementation of the 2030 agenda for sustainable develop-ment. This chapter focuses on one specific aspect of the MDG implementation: the data avail-ability of the performance indicator framework of MDGs. Most countries invested in developing mechanisms to diligently report annual progress made under the MDG indicators. However, as explained later in this chapter, considerable data gap exist within the MDG performance indica-tors. Hence, the chapter poses the following question: how closely is the quality of performance measurement system (proxied through data gap) of MDGs linked to actual performance ? While there has been previous analyses highlighting the extent and nature of the data gap of MDG indicators, to our knowledge this is the first attempt at linking the quality of MDG performance measurement system to the actual MDG performance itself.
The chapter quantifies performance success using six different approaches to measure progress
1 A/RES/55/2
2 In 2001, originally the MDG framework contained 18 targets and 48 indicators, new targets and indicators were
added in 2007 following the discussions at the World Summit in 2005. See UN General Assembly documents A/RES/60/1 and A/61/1 for details.
3 During the United Nations Sustainable Development Summit 2015 (25 - 27 September 2015), in New York,
towards MDGs proposed in the existing literature. Using the MDG official database4, the data gap that exist for most of the quantifiable MDG indicators5 within each country for the period 2000 to 2012 are identified. We use this data gap measure as a proxy for the quality of the MDG performance measurement system. Combining an instrumental variable estimation and heckman correction procedure, we find that controlling for other relevant parameters, the qual-ity of the performance measurement system emerges as a significant predictor of performance success in terms of MDGs. Higher the data gap problem or weaker the performance measure-ment system, lesser is the probability of performance success. This provides evidence for the age-old management principle - ‘you can’t manage what you can’t measure’. Countries were able to tackle the goals better when they were able to measure and quantify those goals prop-erly. Taylor [2009] notes that there are relatively limited number of empirical studies that exist on performance measurement. Hence, this chapter also contributes to the growing empirical literature on implications of performance measurement to actual performance.
A data revolution is currently underway, characterised by an explosion of data available from a variety of new sources (including big data, open data initiatives, satellite imagery and so forth), a commensurate demand for data and emergence of new applications of data. At the request of the UN Secretary General, an Independent Expert Advisory Group (IEAG) on a Data Revolution for Sustainable Development, submitted recommendations in a report titled ‘The World That Counts’ [IEAG, 2014]. The report proposes ways to mobilise the data revolution for sustainable development as we proceed to the new 2030 agenda for sustainable development. Providing further granularity, the PARIS21’s 6 report on ‘Road Map for a Country-led Data Revolution’
[PARIS21, 2015] sets out a step-by-step action plan across four areas, namely, capacity building; principles and standards; technology, innovation and analysis; and governance and leadership. The results of the chapter highlight the fact that implementing the proposals of these reports and strengthening the performance measurement system of SDGs would be a prerequisite for the achievement of SDGs.
The next section provides a general introduction to the MDG indicator framework. Section 2 introduces the MDG framework and discusses issues associated with data availability within the
4 Available at : http://mdgs.un.org/unsd/mdg/default.aspx 5 We use 22 MDG indicators that are are quantifiable.
6 The Partnership in Statistics for Development in the 21st Century (PARIS21) promotes the better use and
MDG framework. A short theoretical framework connecting the need to measure performance with actual performance is provided in section 3. Section 4 describes the data set and the key variables used in our analysis. Section 5 outlines the methodology used in the chapter. Section 6 discusses the main results and associated robustness checks. Section 7 provides the policy implications of the results, especially in the context of the 2030 agenda for sustainable development and section 8 concludes.
2
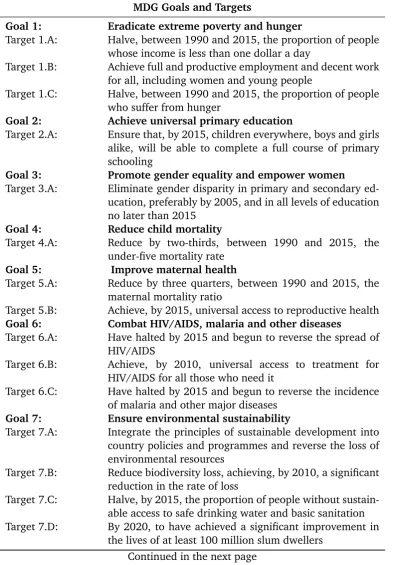
MDG Framework
Tables 1 and 2 in the appendix list the eight MDGs and 21 targets. The goals capture the multidimensional aspect of development and hence integrate themes such as poverty, inequality, education, health, environment under its framework. These targets and goals were motivated by various summits and big developmental conferences that took place in 1990’s [Melamed and Sumner, 2011]7. This is one of the reasons behind the differences between the numerical targets
and the very nature of some of the indicators.
Some of the architects of the MDGs reveal that some of these targets were set based on the existing trends of each of these targets before 1990 [Vandemoortele, 2005]. This helped to bring the targets closer to reality rather than becoming overly ambitious. In any case, the MDG framework had a profound impact on national development data collection process. Demand for MDG monitoring has resulted in more available data, parallel data collection mechanisms, while bringing both challenges and opportunities to national statistical capacity [Chen et al., 2013]. The MDGs galvanized the international statistical community around a fixed set of goals and indicators, resulting in a marked improvement in indicator availability, and a similar effort is needed in the lead up to 2015 to ensure continued improvement in data collection, reporting, and dissemination [Cassidy, 2014].
Aryeetey et al. [2012] finds the ‘quantified’ approach of MDG to be a major advantage of this framework. He argues that this in turn forced an unrelenting spotlight on the need for better data and that the crisp numerical targets underpinning most of the MDGs allow them to be tractable at every policy level. Partly, it is this quantified approach of the MDG framework
7 This includes the World Summit for Children (1990); UN Conference on Environment and Development (1992);
that motivates this chapter.
Interestingly the MDGs were set as global goals and they were not conceptualised to be national level goals. Hence, they were divorced from any strong understanding of potential country-level rates of progress based on historical experience [Karver et al., 2012]. However, during the course of implementation of MDGs, they were taken as national level targets and performance at country level for each indicator was expected to be recorded, reported, evaluated and discussed. Translating global targets to national level sometimes drastically altered the level of ambitiousness of these targets. As a result, many have criticized this approach, particularly because this generated significant pessimism and bias against developing countries, especially in Africa, and resulted in labelling of success stories as failures [Easterly, 2009]. Even at the country level, it has remained unclear if the MDGs were intended as average targets for each country or a minimal target that each country was under pressure to achieve [Gauri, 2012].
Albeit this criticism, the MDGs were integrated into the national development plans and strategies of many countries. It helped focus attention to many social development issues and emphasized the importance of tackling multi-dimensional poverty. An UNDP survey found that out of 118 countries, 86 per cent had adopted one or more of the goals, targets or indicators as part of their national level objective setting. While a subset of countries had integrated the MDGs into their policy making to a quite considerable extent, including by adapting or adding to the goals to make them more relevant to national level issues and priorities [UNDP, 2010].
This by no means suggests that MDG framework is devoid of criticisms. Right from its inception phase many criticized it for the opaque manner in which it was drafted, the method of implementation and most of all in terms of its contents. Some of the main criticisms are that it omits some key dimensions of development such as human rights [Manning, 2010], it adopts a one-size-fits-all approach [Vandemoortele, 2009], they are unrealistically ambitious for many countries [Easterly, 2009, Clemens et al., 2007], inadequate focus on growth or on improving productive capacity [Chang, 2008], diversion from important issues such as global inequality and the fact that the inter-connectedness between the goals are not recognized [Lomazzi et al., 2014].
2.1 Problem of Data Availability in MDG framework
framework has been one very significant stimulus for this [Manning, 2009]. However, despite 15 years of MDG implementation, there are huge data gap and data quality issues across several indicators in many countries.
Poku and Whitman [2011] points out that the following data issues directly pertinent to the comprehensiveness and reliability of MDG indicators were identified, shortly after its inception: the 1990 baseline statistics were not available; the indicators were not being compiled by gov-ernment agencies within national statistical systems; indicators may not be comparable across countries because of differences in compilation methodologies and/or definitions; some indica-tors may not be consistent across years because of differences in data sources; and most of the indicators are not compiled at sub-national level. More recently, Chen et al. [2013] finds that nearly a third of MDG indicators lack data for more than half of the countries. It is this data gap in indicators that we explore further in the chapter.
Finally, [Chen et al., 2013] also highlights the fact that a good proportion of data points in MDG performance has been estimated or modelled by international agencies. We take note of this fact, specifically identify such data points and account for the same in our analysis.
2.2 Problem of Measuring MDG Performance
There have been long debates within the policy and academic circles about how to measure the MDG performance progress. The fact that MDGs were supposed to be global goals and were not meant to be national level goals still remains [Vandemoortele, 2014]. But we don’t enter this strand of debate for the time being, as MDGs were and are continuously used to report progress at the national level. Many governments diligently compiled MDG progress reports at the national level.
Two approaches are used dominantly to measure the progress towards MDGs. The first ap-proach is to measure performance success in terms of achieving the MDG targets. This involves measuring if each country has achieved the targets outlined in the MDGs or are in course of achieving these targets. This has been the approach taken by most MDG performance reports released by national governments, the UN, the World Bank, and the ADB, perhaps due to the simplicity and due to relatively better data availability. This approach conceptualizes MDGs as planning targets at national, regional and global level.
by Fukuda-Parr et al. [2013] and it perceives MDGs as performance benchmarks. Based on this approach, in 13 of the 24 indicators, 50 per cent or more of countries experienced accelerated improvement in the post-2000 period, for 19 of the 25 indicators, half or more of the LDCs showed overall improvement [Fukuda-Parr et al., 2013]. The main merit of this approach is that it would help us recognize the achievements of LDCs and help avoid the criticism raised by Easterly [2009] and Clemens et al. [2007]. It is difficult to conduct the post-MDG rate of progress with pre-1990 trend as there are very few indicators for which pre-1990 data points are available and those data points are significantly affected by standardisation issues and data quality. For limited number of indicators, it is possible to obtain comparable data for 1960-1990 period. So, following Klasen and Lange [2011] we also conduct a comparison with historical transition paths of these indicators and then analyse if MDG implementation led to deviation from the same.
Further, some opinioned that it is important to measure both absolute and relative progress on MDG indicators. The list of top-performers for both relative and absolute progress differed. Countries those who made the highest absolute progress are the low-income countries, espe-cially in Africa. The reason being that they could easily make progress in MDG targets as there were lot of low-hanging fruits to be picked, in terms of relatively easy and inexpensive interven-tions, that enabled to make higher absolute progress [Vandemoortele, 2009]. But most of them fared not too well on the relative scale, as they still have substantial gaps to fill in terms of their targets set by MDG framework. It is the middle-income countries who were able to close their gaps to their targets faster [ODI, 2010].
In order to appropriately address these aforementioned concerns we use a variety of depen-dent variables in our analyses. We incorporate both the above approaches in our analysis along with few other existing methods to measure progress towards MDGs. Overall we use six differ-ent methods to quantify MDG progress in this chapter. More details related to this may be found in section 4.
3
Theoretical Framework
perfor-mance ? This is the question we are interested to answer from a theoretical point of view in this section. We start by exploring this linkage in a management theory perspective and then specifically from the public policy literature, which is more relevant for the MDG context.
The core purpose of performance measurement is to enable use of information generated in decision making purposes and eventually to better performance [Taylor, 2009, Cavalluzzo and Ittner, 2004]. Hatry [2007] identifies program improvements to be the fundamental pur-pose of performance measurement. Sanger [2013] argues that collecting performance data is expected to create a virtuous circle, so that performance measurement will bolster and promote efficient performance management, by improving how an organization accomplishes its tasks and strives to achieve its goals. There are different routes through which performance measure-ment influences the actual performance. For instance, Wang [2000] describes how performance measurement could be effectively used in budgeting through analytical competency and polit-ical support and subsequently lead to more efficient, effective, and accountable government. Behn [2003] states that the leaders of public agencies can use performance measurement to (1) evaluate; (2) control; (3) budget; (4) motivate; (5) promote; (6) celebrate; (7) learn; and (8) improve.
The relevance of data and performance measurement for public policy making has also been widely researched within the literature on evidenced-based policy making and on new public-management. Head [2008] traces the origins of evidence based policy making and finds that demands for efficient and effective government have fostered the need for performance infor-mation. Schildkamp et al. [2012] explores the value of data in the educational sector in the US and concludes (with some caveats) that data use can be effective in improving education in terms of improving student achievement.
But the linkage need not be as smooth as it is postulated nor there is any guarantee that performance measurement is used later for improving the actual performance. Halachmi [1999] argues that although performance measurements can motivate and encourage managers and employees to do a better job, when there is too much emphasis on it, it can backfire, replacing genuine productivity gains with bookkeeping trickery. Taylor [2009] argues that some agencies may use performance measures or indicators more for meeting external reporting requirements than for achieving internal improvements. Arcand [2014] builds a theoretical model to explain the lack of translation of performance information from impact evaluation of public policies to evidenced based policy actions. Some empirical studies also find support for failure of theoretical linkages. For instance Sanger [2013] hypothesized that having a more mature measurement system might lead to efforts to manage for performance. They studied a sample of cities from USA and tested this hypothesis and found that the empirical data did not support the hypothesis. Several challenges exist in the effective use of performance measurement, one of the leading challenges cited is the political and cultural factor [Newcomer, 1997, Julnes and Holzer, 2001]. The performance measurement needs to be integrated within the decision making system in-order for it to create any real impact on performance. This requires commitment and support of the politicians and decision makers.
In the case of MDGs, there are evidence to suggest that MDG indicators (the performance measures) were actually integrated to a large extent within national plans, budgets and strate-gies [UNDP, 2010]. MDGs predominantly targeted social developmental issues such as poverty, hunger, education, health, sanitation, which are common concerns of the median voters in most constituencies. Hence, MDG performance measurement is at least useful, a priori, in decision making process at the national level. In the particular context of Africa, Sanga [2011] reports that, the MDG indicators are used by a broad array of stakeholders: governments to assess pol-icy and program options aimed at improving the well-being of the population, monitor progress in economic management and other sectoral policies and programs; civil society (NGOs, media) to assess opportunities, plan and take decisions and prepare reports; analysts and researchers, especially for policy-related analysis; general citizenry to be able to hold governments account-able; and international agencies to track progress and evaluate achievements of development programs arising from international summits. Further, even if country governments do not give adequate attention to these indicators, these indicators can be decisive in governing the aid flow from donors, which in turn can affect the rate of progress in MDGs [AbouZahr et al., 2007].
H1: Efficient (inefficient) performance measurement system improves (reduces) the
probability of performance success
In other words, the extent of data gap in performance indicators will be a good predictor of poor performance in terms of those indicators. In the following section, we proceed to test this hypothesis using the MDG performance measurement data set.
4
Data and Key Variables
4.1 Data
We use the official MDG indicators data8published by the UN Statistics Division to develop our
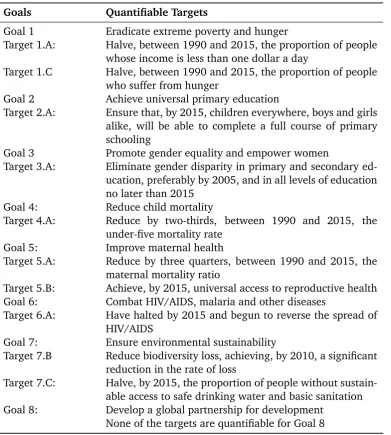
key dependent and independent variables for all countries over the period of 1990 to 2012. Within the MDG framework, some of the targets and indicators are more specific and quan-tified than others. For instance under the goal one, i.e., ‘Eradicate Extreme Hunger and Poverty reducing poverty’, the target of ‘halve, between 1990 and 2015, the proportion of people whose income is less than $1 a day’ is very specific and enables us to clearly monitor the progress of this target. On the contrary, under the goal 7 of ‘Ensure Environmental Sustainability’, the tar-get of ‘Integrate the principles of sustainable development into country policies and programs and reverse the loss of environmental resources’ is rather vague. This problem of lack of speci-ficity is particularly a problem for Goal 8 on ‘Develop a Global Partnership for Development’, as none of its targets or indicators allows us to generate standardized quantifiable measures of performance. The table 3 in appendix lists the goals and targets for which there are quantifiable indicators and a clear timeline within the MDG framework. The table 4 in the appendix provides the list of 22 indicators associated with these quantifiable targets that are used in our analysis.
The following sub-sections describes the key variables used in our analyses.
4.2 Dependent Variables
As discussed earlier, within the existing literature various methods have been proposed to mea-sure the MDG progress and impact of MDG. Based on these varying approaches we use six different performance success indicators of MDG, there are discussed below.
Relative Performance Gap : We take the gap between the level of performance indicator in 2012 and the required level of the indicator in 2015. We take the difference between these two levels to create a performance gap variable. We then normalize this performance gap across all countries within a specific indicator. Hence, this variable measures if the performance gap for a certain country for a specific indicator is how many standard deviations above or below the average performance gap.
For each indicatorXi , this performance measure will be :
[Xi,c,2015−Xi,c,2012]−Xi
SDXi
(1)
whre Xi is the mean performance gap for the indicator andSDXi the standard deviation.
As expected, for most indicators, the performance gaps are highest for countries in west and central Africa due to MDGs being overly ambitious for these countries.
Absolute Rate of Performance: We take into account the actual rate of performance achieved by country at each indicator level as an additional dependent variable. As argued by Easterly [2009] and others, MDGs were doomed to fail in countries in Africa as they imposed over ambitious targets to these countries. Hence these countries were faced with enormous ‘required rate of progress’ and most likely their actual attained rates of progress was lower than this required rate. At the same time, these countries could potentially attain high absolute rates of performance due to several low hanging fruits. It will be interesting to map the impact of data gap on this measure of absolute rates of progress. The top performers on this list includes many countries in Africa and Asia, many of whom though may not achieve some of the MDGs, nevertheless recorded remarkable progress in terms of absolute rates. However, not all countries who faced with overly ambitious targets set out by MDG framework managed to make such high absolute rates of progress. Usage of this variable in our regressions will allow to see how the quality of performance measurement system (proxied through data gap) was a determining factor of differences in rates of performance.
For each indicatorXi , the absolute rate of performance during 2000 to 2012 will be :
Xi,c,2012−Xi,c,2000
13 (2)
of the examined MDG indicators. For example, let us say, in order to achieve the MDG target to halve extreme poverty between 1990 and 2015, each country would need to achieve annualized reduction rates of 2 percent (50 percent divided by 25 years) in poverty rates. We then calculate the achieved annual rate of progress for this indicator till 2012. If the achieved rate of progress is greater than or equal to the required rate of progress, the performance dummy will record 1, and zero otherwise for each indicator. This approach to measuring progress of MDG is in line with the approach used in UN Annual Millennium Development Goals Report and the World Bank’s ‘Global Monitoring Reports’. Hence, in this chapter, we will use this variable as the key benchmark dependent variable for which we will discuss detailed estimation results for each of the covariate.
Dummy = 1[∆Xi
∆Ti1990−2012
> ∆Xi
∆Ti required
] (3)
Difference of Rate of Progress (between post and pre MDG Adoption): We calculate difference rate of annual progress of each MDG indicator for the period 2000-2012 (post-adoption phase) and 1990-2000 (pre-MDG adoption phase). If this difference is positive, a dummy variable will take the value 1. This variable helps us to measure the specific contribution of MDG approach towards the rate of progress of each indicator. This is the method of measuring progress recom-mended by Fukuda-Parr et al. [2013] and uses MDGs as performance benchmarks. This measure helps us determine whether countries achieved faster pace of progress since the MDGs?
M DG_perf ormance= ∆Xi
∆Ti post−
∆Xi
∆Ti pre (4)
Dummy= 1[M DG_perf ormance≥0] (5)
where,∆Xi =X2012−X2000for post MDG phase and∆Xi=X2000−X1990for pre- MDG phase. Difference in Average Annual Rate of Reduction (AARR) between post and pre MDG: Most of the earlier measures makes the implicit assumption the efforts needed to attain the progress is independent of the level of achievement of indicators. This need not be true and sometimes acceleration of improvement becomes more difficult as levels of achievement increase [Fukuda-Parr et al., 2013]. For instance, as the child mortality rates reach a lower point, the same or greater absolute reduction becomes increasingly difficult. UNICEF therefore uses average annual rate of reduction of these indicators, which helps to account for this fact. LetXi,t+τ be
indicator at the baseline year.r will be the AARR. We calculate the AARR for pre and post MDG phase and use a dummy to indicate if the post MDG (2000 to 2012) AARR is greater than (or equal to) the pre-MDG (1990-2000 time frame) rates. We calculate this performance measure for all indicators for which the reduction in absolute measure indicates progress.
Xi,t+τ =Xi,t(1−r)τ (6)
Dummy= 1(AARRpost−2000 ≥AARR1990−2000) (7)
Deviation from historical transition path: Klasen and Lange [2011] suggests to compare the ac-tual MDG performance with the expected MDG performance that is extrapolated using the trend in indicators since 1960. Klasen and Lange [2011] shows that for three MDG indicators, namely, under-5 mortality rates, gender parity in secondary education and primary school completion rates9, for which comparable historical data exists, the historical transition paths of countries follow an s-shaped (logistic) curve, which indicates that it is more difficult to bring about a given absolute change both at high and low levels of achievement. These historical transition paths are depicted in figures 3, 4 and 5 in the appendix. We use the historical rate of progress
β calculated by Klasen and Lange [2011] and then compare the expected level of achievement (mrc\t+τ) with the actual level of achievement in 2012 (mrct+τ). The expected level of
achieve-ment is forecasted using the following relation, where,βis the rate of historical progress of each indicator andmrcrepresents the historical maximum values of these indicators,
\
mrct+τ =mrc[1 +
mrc−mrct
mrcteβτ
]−1
(8)
Subsequently, a peformance index pi is then calculated based on the following formula,
which is used as a dependent variable to indicate progress towards MDGs.
pi =
mrci,t+τ −mrci,t \
mrct+τ −mrci,t
(9)
4.3 Explanatory Variables
data gap in MDG Performance Measurement: As described earlier, the quality of performance measurement is quantified using the data gap within each of the 22 MDG indicators at the
9 Klasen and Lange [2011] uses the ratio of gross enrollment rates to monitor progress towards gender equality,
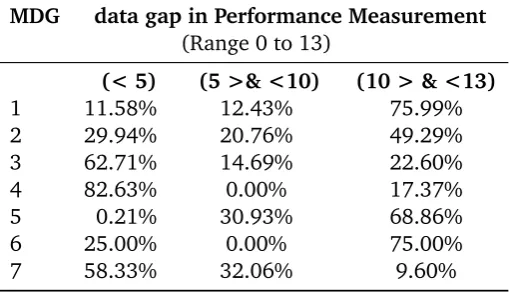
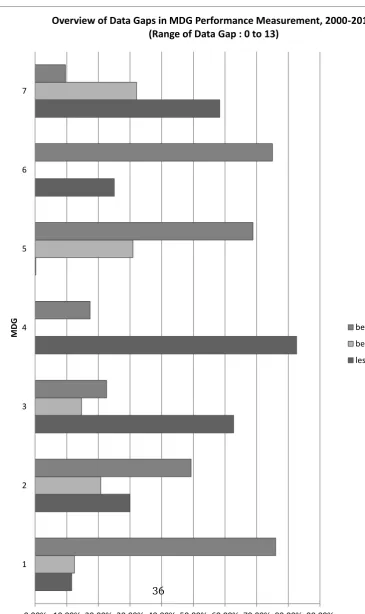
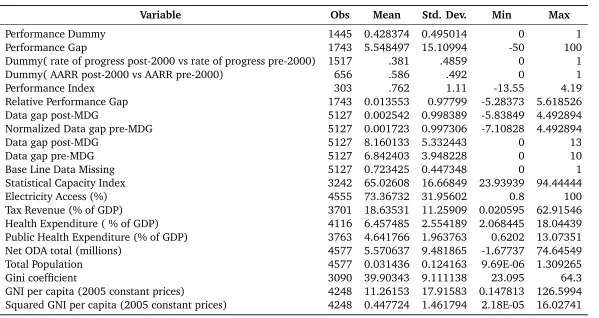
country level (listed in Table 4 in the appendix). We count the number of data points missing between 2000 and 2012 for each of the 22 indicators for each country. Larger the data gap is lower the quality of the MDG performance measurement system. Hence, this variable ranges from 0 to 13. A value of 0 indicates there is no data gap and a value of 13 indicates there is no data point available for the indicator for that country between 2000 and 2012. Appendix table 5 provides an overview of this data gap measure. As shown by table 5 and figure 1, for MDG 1, in 11.5 % of country-indicator pairs, less than 5 data points are missing. In 75.9 % of cases the data gap is between 10 and 13. This suggests that, between 2000 and 2012, for quantifiable indicators under MDG 1, almost 76 % of countries have less than 3 data points available. In order to test for lag effects, we also calculate this measure of data gap for the period 1990-1999. Within our regression analysis, we use the normalized measure of this variable, within each indicator category.
Proportion of Estimated or Modeled Data: As discussed earlier, some datapoints in the MDG indicators were estimated or modelled by the inter-agency group, especially when data points were not available at the national level. To control for this effect we use the proportion of available data points that are estimated or modelled for each indicator. This variable varies over country and indicator. Graph 2 plots the proportion of estimated and modelled data per MDG. We see that MDGs 4, 6 and 7 involves a very high proportion of Estimated or modeled data points. We use this indicator explicitly as a covariate in the estimations and also to conduct robustness checks of results to ensure that the estimated or modelled data points are not driving the estimation results.
The other key control variables included in our regression analyses are sourced from the World Bank’s World Development Indicators database. For each of these control variables, we use average values for the period 2000-2012. The reason for using the average value for period is that , the millennium declaration was signed in 2000 and concerted efforts to tackle these MDG targets only after 2000 and hence we look at the average values of control variables during this time span. These variables are included in the analyses to control for the mix of factors that affect the likelihood of MDG performance success.
variable 10. We expect this statistical capacity indicator to positively impact the likelihood of MDG performance success.
Electricity Access : Electricity access as a percentage of total population is used as a proxy of infrastructure in the economy. We expect a positive link between this variable and MDG performance.
Public spending on Education and Health : MDGs called for targeted public spending and investment in many public goods. The public spending in education and health as percentage of GDP are included to capture the willingness and the ability of the government to divert funds towards MDG targets. A positive link is expected between the public spending on these crucial sectors and the MDG performance.
Domestic Resource Availability : Tax revenue as percentage of GDP is used to measure the resource mobilisation potential of the government.
We include other covariates such as Foreign Aid (net ODA, in billions), GNI per capita (US $ constant 2005, in thousands), squared GNI per capita (US $ constant 2005, in billions), and GNI growth rate, population (in billions) and the gini coefficient to measure inequality. These variables help to control for country level socio-economic factors that affect the progress towards MDGs.
5
Empirical Strategy
5.1 Empirical Model
We estimate the following empirical model to test hypothesis 1 proposed in our theoretical section, which predicts that weaker performance measurement system (proxied through higher data gap) reduces the probability of performance success.
M DG_perf ormancec,i =β1Data_gapc,i+β2xc,i+β3xc+ǫc,i (10)
As explained earlier, we use six different dependent variables in our analyses. Hence,
M DG_perf ormancec,i can take the form of any of the six dependent variables described in
10 The Statistical Capacity Indicator is a composite score assessing the capacity of a country’s statistical system. It is
the previous section. Data_gapc,i is the crucial explanatory variable. Based on the hypothesis
1 discussed in the theoretical section, β1 is expected to be negative and significant when the
dependent variable is the rate of actual performance or a dummy that indicates performance success. β1is expected to be positive and significant when the dependent variable measure gaps
in performance.
In order to correct for the potential endogeneity bias created by the measurement error as well as presence of omitted variables inǫc,i that are potentially correlated with theData_gapc,i
we adopt an instrumental variable strategy, using a set of instrumental variables (z).
Data_gapc,i=βzz+ +vc,i (11)
The country-indicator pairs that have high data gap have a higher probability of being ex-cluded from our sample. To correct for this selection bias the chapter uses Heckman’s two-stage approach [Heckman, 1976] using an exogenous variable (δ) that determines selection.
Selection= 1(βδδ+ +wc,i) (12)
We combine the Heckman correction procedure with IV 2sls in the following manner. In the case of continuous dependent variable (such as absolute and relative MDG performance gap) we adopt the strategy explained in Woolridge [2010]. As the first stage, we estimate the selection equation using all available exogenous variables (z, δ , xc and xc,i ) and then
obtain the inverse mills ratio (IMR). In the second stage the entire set of exogenous variables are used as instruments, including the IMR, in the IV 2sls estimation. A t- test is conducted on the significance of t-statistics of IMR in the second stage, if the t-statistic is found to be statistically significant then appropriate standard error correction is employed for correcting for the generated regressor problem using bootstrapped standard errors (see Woolridge [2010] for more details).
standard error correction [Murphy and Topel., 2002, Muro et al., 2010]. 11
Further details on the exact instrumental variables and exclusion restrictions used are pro-vided in section 6.2
6
Empirical Estimation
6.1 Preliminary Results
Firstly, we need to choose between the panel data specification and a pooled cross-section model. We can treat each country as the panel unit and each MDG indicator as the second panel dimen-sion. In order to test between fixed effects and random effects. The hausman test rejected the fixed effects model in favour of the random effects model. The likelihood ratio test subsequently supported the use of pooled model over random effects model. In all specifications the data gap variable negatively impacts the likelihood of MDG performance success. However, the like-lihood ratio test rejects the panel data random effects model and shows that it suffices to run a pooled cross-section models. Hence, we proceed with the rest of the analysis using a pooled cross-section data set up12.
Table 7 in the appendix gives the estimation results for all six measures of MDG progress for the pooled model. As postulated by H1, we find that data gap in performance measurement reduces the probability of MDG performance success and is statistically significant in almost all specifications. The preliminary estimations show that data gap increases the performance gap, reduces the absolute rate of progress in the post 2000 period, reduces the probability of the rate of performance to be greater than pre-MDG period and reduces the performance index based on deviations from historical transition paths.
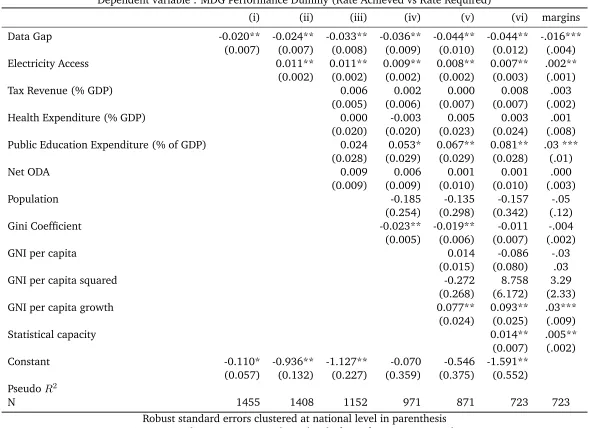
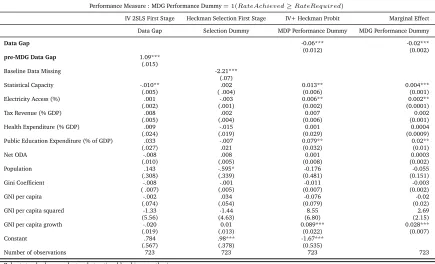
Table 8 gives the detailed estimation results for the specification using performance dummy which compares the achieved rate of performance to the required rate of performance needed to achieve MDGs, including the coefficients of all covariates. As discussed earlier, in the existing literature this has been the most prominent dependent variable and hence we will use this variable as the benchmark dependent variable in our analysis. The marginal effect of the final specification (vi) implies that one point increase in data gap reduces the probability of MDG performance success by .016 percentage points. Better infrastructure (measured by electricity
access) increases the probability of MDG performance success. Higher public spending in social sectors, higher GNI per capita growth rates also becomes statistically significant determining factors of MDG performance success.
6.2 Correcting Endogeneity and Selection Bias
The regression model could potentially be affected by selection bias. The country-indicator pairs that have high data gap have a higher probability of being excluded from our sample. For instance, out of the total 5149, country-indicator pairs in our sample, 1846 pairs have full data gap, that means they do not have any observations for the period of 2000 to 2012. Hence, this could lead to the problem of selection bias in our estimation as countries with very high data gap problem will drop out of the estimated sample. In other words, countries with less data gap have a higher probability for being selected into the sample. This could potentially bias the coefficient of data gap measure upwards or it will be less negative compared to the true parameter value (in cases when we hypothesize the coefficient to be negative).
We correct for this selection bias using a Heckman procedure [Heckman, 1976]. Those indicators for which baseline data is unavailable has a higher probability of being excluded from the sample. For MDG indicators the baseline data was set for the year 1990. We use this measure of baseline data availability to define the exclusion restriction for the first stage of the Heckman procedure.13
The second source of bias in our estimations can arise from the potential endogeneity of the Data gap variable. It can be potentially be endogenous due to omitted variables present in the error term or due to measurement error. For instance, there could be unobserved heterogeneity of institutional factors of each country that might affect MDG performance as well as the decision of countries to measure and report MDG performance (captured by the data gap variable). Also, measurement error of the data gap measure could be a potential source of bias. A suitable instrumental variable (IV) and an IV 2-stage least squares (2sls) estimation can correct for this potential endogeneity bias.
The data gap in MDG indicators for the period 1990-2000 provides a suitable instrumental variable for the post-2000 data gap. We expect this IV to be positively related to the post-2000
13 In the case of limited dependent variables, these estimations can be implemented using the heckprob package
data gap variable as a high data gap in the pre-2000 period is a good indicator of post-2000 data gap. Since these data gap were formed before the MDGs were adopted, the unobserved attitudes of each country toward MDGs will not be related with this IV. However, there could be doubts if country- specific factors such as institutions might affect this proposed IV and the outcome variable simultaneously, whereby defying the validity of the instrument. To account for this, an instrumental variable fixed effects model is estimated in the appendix table 13. The country fixed effects estimation will remove any bias created by country-specific omitted variables in the error term. The results of the fixed effects estimation are broadly in line with the pooled estimation results, except for one of the outcome variables.
Another potential instrumental variable for the data gap measure is the world average of data gap for each indicator for 2000-2012. Some indicators might be more difficult to measure than others and this could be a problem faced by all countries. Hence, the world average of data gap of each indicator will be correlated with country specific data gap for each indicator. But country specific socio-economic factors that might affect MDG performance do not affect this world average directly. This variable provides additional robustness check of our results. The results of the IV 2sls estimation using this IV is presented in the appendix table 14. The results are in line with the main results discussed below.
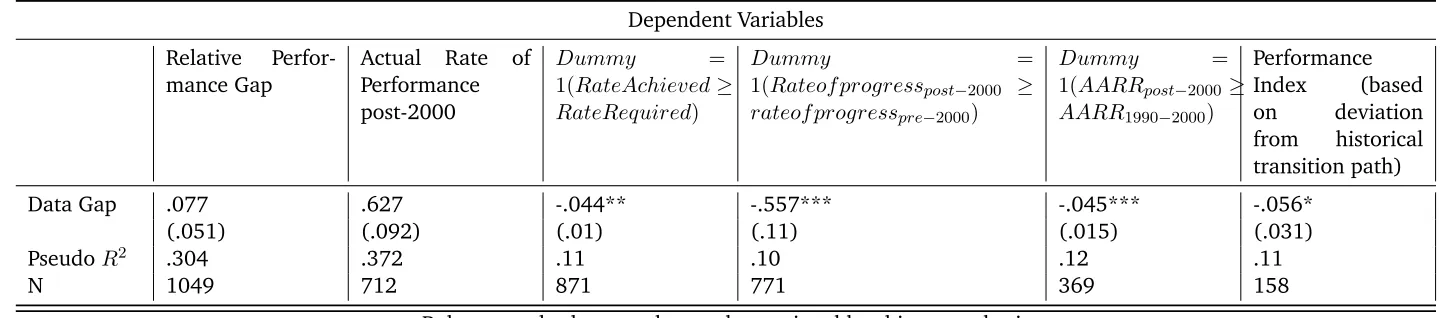
Table 9 provides the instrumental variable estimation results for all six dependent variables. We find that once corrected for endogeneity bias, data gap remains a strong determining factor that reduces the probability of performance success and increases the performance gap in terms of MDG indicators. Hence, those countries who were able to efficiently monitor the performance of MDG indicators (less data gap) have a higher absolute rate of progress in terms of MDG indicators, higher probability that their rate of progress of indicators exceed the rate required to achieve the MDGs, higher probability that their post-2000 rates of progress exceed their pre-2000 rates of progress and finally, that they record a higher rate of progress than that dictated by historical transition paths in indicators.
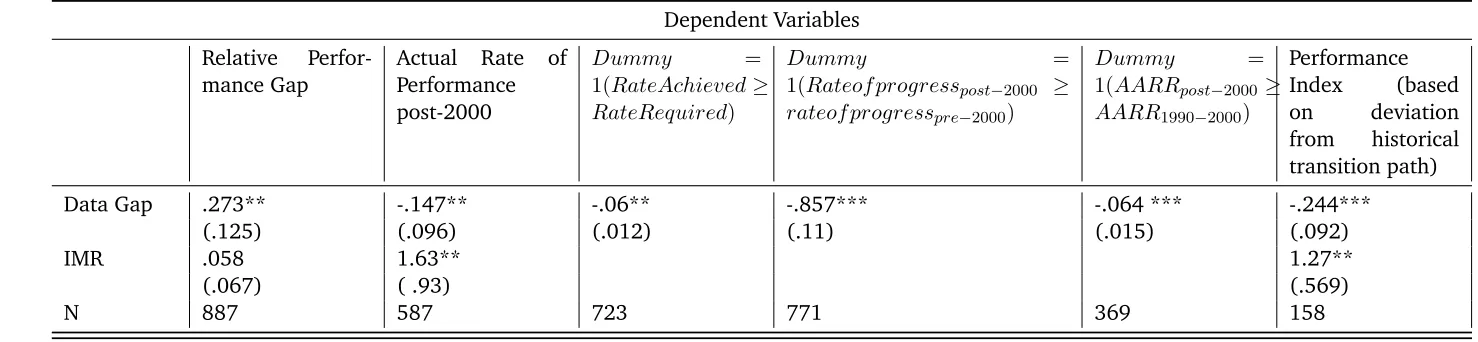
Table 10 provides the summary of the results for the estimations that combines the heck-man correction procedure with IV 2sls, as explained earlier in the empirical model section. As predicted by the theoretical section, we find that, after simultaneously correcting for the selec-tion bias and endogeneity bias, the coefficient of the Data gap variable is significant and the magnitude has increased in all models compared to preliminary results.
perfor-mance success dummy14. We find that after correcting for selection bias and endogeneity the data gap in performance measurement remain a statistically significant predictor of performance failures. Higher is the data gap lower is the probability of MDG performance success and higher is the relative performance gap. The marginal effect of Heckman probit estimation implies that one point increase in data gap reduces the probability of MDG performance success (measured by the fact if rate of achieved progress of indicator is higher than or equal to the rate of progress required to achieve MDGs) by 2 percentage points. The significance levels of some other co-variates have differed in Heckman-probit estimation, compared to the ordinary estimation. But broadly the results remain same and are discussed below.
The Statistical Capacity of the country seems to positively impact the likelihood of MDG per-formance success. The national statistical capacity is crucial for evidence based policy making. However, it is also interesting note that even after controlling for the overall statistical capac-ity explicitly, the data gap variable remains statistically significant and negatively impacts the likelihood of MDG success. The implication of this result underscores the relevance of targeted performance measurement system oriented at specific development agendas. It doesn’t suffice to make data available in the form of national level census or household survey but this data need to regularly feed into specific performance measurement systems such as the MDG indicator framework, which later is used for performance improvement through policy actions.
Infrastructure (measured by access to electricity) variable remains a significant positive de-terminant of MDG performance success. [IFPRI, 2006] attributes Infrastructure to be one of the key inputs entering into the ‘production function’ of the MDGs and the achievement of many of the MDG targets, from poverty reduction to environmental sustainability targets. Our results provide evidence to this fact.
Interestingly, the GNI per capita variable shows a non-linear relationship (albeit not signif-icant statistically). This can be explained as follows, the upper low-income and lower-middle income countries have MDG targets which are quite ambitious and it is difficult to be in track to achieve these targets. However, for sufficiently higher income countries their higher income per capita allows them to make progress with respect to MDGs. Hence, we observe a U-curve re-lationship between income per capita and the MDG performance. The national income growth rates remain a strong predictor of MDG success. This lends support the need for economic
14 Here the dependent variable is the performance success dummy, which takes the value one if the achieved rate
growth and economic structural transformation in achievement of broader social goals.
DESA [2013] provides evidence and highlights the corrosive effects of inequality on eco-nomic growth, poverty reduction, social and ecoeco-nomic stability and socially-sustainable devel-opment. The results of the estimations reveal that high income inequality reduces the likelihood of success of MDGs. The marginal effects show that unit increase in income inequality reduces the probability of MDG performance success by .3 percentage points.
The financial resources are key in the success of MDGs. Our results show that public expendi-ture on social development issues (such as health and education) are positively related to MDG performance success. The public education expenditure as percentage of GDP is statistically sig-nificant predictor of MDG success. In addition, the domestic resource mobilisation potential (as measured by tax revenue as percentage of GDP) and the foreign aid positively impact the MDG performance success. This highlights the importance of financial resources in the achievement of development frameworks such as MDGs and SDGs.
Table 12 provides similar detailed results for the case when the outcome variable is the relative peformance gap.
6.3 Robustness Checks and Sensitivity Analysis
Robustness checks for suitability and validity of instruments were conducted. The Sargan-Hansen test of overidentifying restrictions, did not reject the null of null hypothesis the in-struments are valid inin-struments, i.e., uncorrelated with the error term, and that the excluded instruments are correctly excluded from the estimated equation.15 The results are robust to test for weak instruments and that of heteroskedasticity. A heteroskedasticity robust underidentifi-cation test (Kleibergen-Paap rk LM statistic) rejects the the null hypothesis that the equation is underidentified (in all specifications with a p-value of less than .01). The test of weak identifica-tion (using Angrist-Pischke first-stage F statistics test and Cragg-Donald Wald F statistic) rejects the null hypothesis of weak instruments. Durbin Wu-Hausmann and Wu-Hausman tests rejected the exogeneity of the Data gap variable.
One of the crucial assumptions of the probit estimations (involved with three of the depen-dent variables used ) is that of the normality of distribution of the error terms. We test the normality assumption using the Lagrange Multiplier Test for the normality of the residuals of
15 For the case of dependent variable being relative performance gap, the Hansen J statistic is 0.591, with a p-value
the Probit model and find that the errors are normally distributed. The results are robust to clustering of standard errors at country level and at indicator level. Some of the indicators in-cluded in our analysis were added to the MDG framework after 2007, we omit such indicators from our analysis and our key results holds.
As shown in figure 2 in some of the indicators the data points available were not collected by national statistical agencies and were estimated or modelled by international agencies. Ro-bustness checks in the context of estimated or modelled data were done in two ways. Firstly, the indicator and country pairs for which the proportion of available data were over 50% were omitted and repeated our analyses. The results are found to be robust to such omissions. Sec-ondly, we explicitly included the proportion of estimated or modelled data as a covariate in our analysis and this did not impact the level of significance or the magnitude of impact of the data gap variable.
Policy formulation is time consuming. Once the performance data indicates and identifies a problem, it will take time to design new policy interventions to tackle the problem and to find resources for the same. Hence, it is possible that the impact of present data gap is only felt in few year from now. In order to respond to this lag effect, we take the data gap for the period 2000-2006 (instead of data gap for the period 2000 to 2012) and repeat our analyses (the results are provided in table 15 in appendix. We find that our results holds and, in fact, the magnitude of the impact of data gap has increased considerably, more than 100 percent in some cases. This supports our assumption that available performance data takes time to have impact on the actual performance depending on the time taken to respond to formulate appropriate policy actions.
6.4 Limitations and Areas for Future Research
frame-work to identify more disaggregated impacts at the indicator level. This research can be further extended in terms of identifying what other factors influence this relationship between perfor-mance measurement and actual perforperfor-mance.
We used a pooled cross-section data set in most of our analysis, this was because our ini-tal analyses rejected fixed effect or random effect specifications (See discussions in section 6). However, this initial panel data setup did not account for endogeneity and sample selection bias. Simultaneously accounting for endogeneity bias and sample selection bias within a panel data set up is not easy. An attempt was made to apply the parametric methodology proposed by Wooldridge and Semykina [2010]. However, for several of the indicators the data points available were inadequate for the model to achieve convergence, as a selection equation had to be run for each indicator separately. Therefore, once more data points becomes available the analysis may be conducted using the full panel data structure and the merits of panel structure over pooled data structure may be explored in detail.
The exact mechanism through which these data gap in MDG performance measurement affect the MDG attainment need to be researched further. This aspect is under-studyed in the wider policy- literature as well. For instance, Spillane [2012] states that the relations between data and local decision making are not elaborated or worked out in policy text. Therefore, future research could be conducted to identify the exact channel of impact of performance measurement to actual performance. These issues need to be addressed in future elaborations of this research.
7
Implications for the 2030 Agenda for Sustainable Development
with data gap as explained in earlier sections of this chapter. Our analysis further reveals that these data gap in turn affected the attainment of MDGs in many countries. In order to avoid the same plight for SDGs, attention needs to be given to create an efficient and effective perfor-mance monitoring system for SDGs. In March 2016, the UN Statistical Commission endorsed a global framework of 230 indicators for monitoring progress of SDGs. While these indicators are being finalised, it is important to simultaneously start deliberations on creating mechanisms to regularly collect data for these indicators at national and sub-national levels.
Secondly, one of the challenges that we face with MDG performance measurement is that the base line data of 1990 is missing for many countries. For SDGs 2015 may form the baseline year and it is important to ensure that mechanisms are put in place to collect baseline data for all SDG indicators, at the earliest.
measurement data gap regularly. 16
Fifthly, new data sources need to be exploited to continuously provide progress reports on performance and to fill data gap in a expedited manner. Alkire and Samman [2014] reviews and evaluates some of the new data sources such as opinion polls ‘big data’, satellite data, call records, and other digital breadcrumbs. Prydz [2014] provides an overview of technological in-novation in data collection in developing countries, with a particular focus on those technologies that enable high-frequency data collection. These studies underscores the need for exploiting the potential of these new data sources and technology tools to complement traditional data collection mechanisms, such as household surveys, in fulfilling the data requirement of the post-2015 development agenda. There is a need to integrate further these new data collection tools and sources within the national statistical systems.
Sixthly, all this would require resources and earmarked financial resources.SDSN [2015] gives a broad indication of the scale of resources required to strengthen the statistical capacity to cater to the needs of the sustainable development goals. The third International Financing for Development Conference (FFD3), in Addis Ababa in July 2015, looked into the financing aspects of the post-2015 development agenda, including resources required to create an effec-tive monitoring and follow-up framework. The outcome document of FFD3 assures financial resources and technical assistance towards this end. The results of this chapter underlines the need to identify and earmark financial resources to develop an effective monitoring mechanism of SDGs by strengthening the NSS and to make the best use of the ‘data revolution’. This will pay off in the long run as it will enable more impact evaluation, facilitate evidence based policy making and ultimately lead to performance success in terms of development goals.
Finally, one of the main messages of this chapter is that while it is important to strengthen national statistical capacities, it is equally important to simultaneously create dedicated systems that collect, extract, compile and manage data from all available sources for specific develop-ment programs (such as the MDG or SDG frameworks). The fact that the data gap variable remains significant in most of our specifications despite inclusion of the measure of overall sta-tistical capacity provides evidence for this conclusion.
16 This includes, inter alia, creation of a ‘Network of Data Innovation Networks’ to use innovative ways to address
8
Conclusion
This chapter looked into how data gap in performance measurement affected the MDG per-formance. Using MDG indicators database, the data gap associated with 22 quantifiable MDG indicators were identified. Performance progress based on these indicators was measured us-ing six different approaches. The analysis shows that data gap in MDG performance reduces the probability of MDG performance success and increases the performance gaps (both absolute and relative). This chapter further provided empirical evidence to the fact that inefficient per-formance measurement can result in perper-formance failures. This holds true even after controlling for national level statistical capacity. The chapter derived some key policy implications for the 2030 Sustainable Development Agenda. The key message is that it is important to seriously start thinking about the performance measurement system associated with SDGs at the initial stages itself, to lay foundations for effective and evidence-based policy making. This chapter is the first attempt at empirically evaluating the value of data in the context of international development goals.
References
C. AbouZahr, S. Adjei, and C. Kanchanachitra. From data to policy: good practices and caution-ary tales. Lancet, 369(9566):1039–1046, March 2007.
Sabina Alkire and Emma Samman. Mobilising the household data required to progress toward the sdgs. OPHI WORKING PAPER, (72), September 2014. URL http://www.ophi.org.
uk/wp-content/uploads/OPHIWP072.pdf.
Jean-Louis Arcand. The (lack of) impact of impact: Why impact evaluations seldom lead to evidence-based policymaking. Revue dŠéconomie du développement, 22:289–311, 2014.
Ernest Aryeetey, Daniel Esty, Edwin Feulner, Thierry Geiger, Daniel Kaufmann, Andreas Kraemer, Marc Levy, John W. McArthur, Robert Steele, Anand Sudarshan, and others. Getting to Zero: finishing the job the MDGs started. In Global Agenda Council, World Economic Forum, April, 2012. URLhttp://www.brookings.edu/~/media/research/files/papers/ 2012/4/17%20millennium%20dev%20goals%20mcarthur/0417%20millennium%
Robert D. Behn. Why Measure Performance? Different Purposes Require Different Measures.
Public Administration Review, 63(5):586–606, September 2003. ISSN 1540-6210. doi: 10.1111/1540-6210.00322. URLhttp://onlinelibrary.wiley.com/doi/10.1111/
1540-6210.00322/abstract.
Megan Cassidy. Assessing gaps in indicator availability and coverage. Sdsn report, SDSN, June 2014. URL http://unsdsn.org/wp-content/uploads/2014/07/
Assessing-Gaps-in-Indicator-Availability-and-Coverage.pdf.
Ken S. Cavalluzzo and Christopher D. Ittner. Implementing performance measurement in-novations: evidence from government. Accounting, Organizations and Society, 29(3â˘A¸S4): 243–267, April 2004. ISSN 0361-3682. doi: 10.1016/S0361-3682(03)00013-8. URL
http://www.sciencedirect.com/science/article/pii/S0361368203000138.
Ha-Joon Chang. Comments on jeffrey sachsŠ proposals for a bretton woods 2. The Guardian, October 2008. URLhttp://www.theguardian.com/commentisfree/2008/oct/22/ economy-economics.
Shuang Chen, Fonteneau Francois, Jutting Johannes, and Stephan Klasen. Towards a post-2015 framework that counts: Development national statistical capacity. Paris21 Discussion Paper, (1), November 2013. URLhttp://mortenjerven.com/wp-content/uploads/2013/
04/Panel-8-Jutting.pdf.
Michael A. Clemens, Charles J. Kenny, and Todd J. Moss. The Trouble with the MDGs: Con-fronting Expectations of Aid and Development Success. World Development, 35(5):735– 751, May 2007. ISSN 0305-750X. doi: 10.1016/j.worlddev.2006.08.003. URL http:
//www.sciencedirect.com/science/article/pii/S0305750X07000095.
UN DESA. Inequality matters. Report of the World Social Situation 2013 ST/ESA/345, United Nations Department of Economic and Social Affairs, 2013. URLhttp://www.un.org/esa/
socdev/documents/reports/InequalityMatters.pdf.
William Easterly. How the millennium development goals are unfair to Africa. World Develop-ment, 37(1):26–35, 2009. URLhttp://www.sciencedirect.com/science/article/
pii/S0305750X08001022.
be judged: Faster progress or achieving the targets? World Development, 41:19–30, January 2013. URLhttp://www.econstor.eu/handle/10419/71808.
Varun Gauri. MDGs that Nudge: The Millennium Development Goals, Popular Mobilization, and the Post-2015 Development Framework. SSRN Scholarly Paper ID 2183583, Social Sci-ence Research Network, Rochester, NY, November 2012. URLhttp://papers.ssrn.com/
abstract=2183583.
Arie Halachmi. Mandated performance measurement: A help or a hindrance? Na-tional Productivity Review, 18(2):59–67, March 1999. ISSN 1520-6734. doi: 10. 1002/npr.4040180211. URL http://onlinelibrary.wiley.com/doi/10.1002/
npr.4040180211/abstract.
Harry P. Hatry. Performance Measurement: Getting Results. Urban Institute, Washington, D.C, 2007.
Brian W. Head. Three lenses of evidence-based policy. The Australian Journal of Public Adminis-tration, 67(1):1–11, March 2008.
James J. Heckman. The common structure of statistical models of truncation, sample selection and limited dependent variables and a simple estimator for such models. Annals of Economic and Social Measurement, 4(5):475–92, 1976.
IEAG. The world that counts. Technical report, The United Nations Secretary-GeneralŠs Inde-pendent Expert Advisory Group on a Data Revolution for Sustainable Development, November 2014. URLhttp://www.undatarevolution.org/wp-content/uploads/2014/11/
A-World-That-Counts.pdf.
IFPRI. Agriculture and achieving the millennium development goals. Technical Report 32729-GLB, International Food Policy Research Institute (IFPRI), 2006. URL http://ebrary.
ifpri.org/cdm/ref/collection/p15738coll2/id/125143.
Patria de Lancer Julnes and Marc Holzer. Promoting the Utilization of Performance Measures in Public Organizations: An Empirical Study of Factors Affecting Adoption and Implementa-tion. Public Administration Review, 61(6):693–708, November 2001. ISSN 1540-6210. doi: 10.1111/0033-3352.00140. URLhttp://onlinelibrary.wiley.com/doi/10.1111/
Jonathan Karver, Charles Kenny, and Andy Sumner. MDGS 2.0: What Goals, Targets, and Timeframe? IDS Working Papers, 2012(398):1–57, July 2012. ISSN 2040-0209. doi: 10.1111/j.2040-0209.2012.00398.x. URL http://onlinelibrary.wiley.com/doi/
10.1111/j.2040-0209.2012.00398.x/abstract.
Stephan Klasen and Simon Lange. Getting progress right: Measuring progress towards the mdgs against historical trends. Courant Research Centre, (87), August 2011. URL http:
//www2.vwl.wiso.uni-goettingen.de/courant-papers/CRC-PEG_DP_87.pdf.
K. Lahiri and P. Schmidt. On the estimation of triangular structural systems. Econometrica, 46: 1217˝U1221, 1978.
Benjamin Leo. Who are the MDG trailblazers? A new MDG progress index.Center for Global De-velopment Working Paper, (222), 2010. URLhttp://papers.ssrn.com/sol3/papers.
cfm?abstract_id=1694138.
Marta Lomazzi, Bettina Borisch, and Ulrich Laaser. The Millennium Development Goals: ex-periences, achievements and what’s next. Global Health Action, 7, February 2014. ISSN 1654-9716. doi: 10.3402/gha.v7.23695. URL http://www.ncbi.nlm.nih.gov/pmc/
articles/PMC3926985/.
Richard Manning. Using indicators to encourgae development: Lessons from the millennium de-velopment goals. Technical Report 2009:01, DIIS Reports / Danish Institute for International Studies, 2009. URLhttp://www.econstor.eu/handle/10419/59842.
Richard Manning. The Impact and Design of the MDGs: Some Reflections. IDS Bulletin, 41(1):7–14, January 2010. ISSN 1759-5436. doi: 10.1111/j.1759-5436.2010.00098.
x. URL http://onlinelibrary.wiley.com/doi/10.1111/j.1759-5436.2010.
00098.x/abstract.
Claire Melamed and Andy Sumner. A Post-2015 Global Development Agreement: why, what, who? Cairo, October 2011. ODI. URL http://www.odi.org/sites/odi.org.uk/
files/odi-assets/publications-opinion-files/7369.pdf.
Juan Muro, Cristina Suarez, and Maria del Mar Zamora. Computing murphy˝Utopel-corrected variances in a heckprobit model with endogeneity. The Stata Journal, 10(2):252˝U258, 2010.
K. M. Murphy and R. H. Topel. Estimation and inference in two-step econometric models.
Journal of Business and Economic Statistics, 20:88–97, 2002.
Kathryn E. Newcomer. Using performance measurement to improve programs. New Directions for Evaluation, 1997(75):5–14, September 1997. ISSN 1534-875X. doi: 10.1002/ev.1076.
URLhttp://onlinelibrary.wiley.com/doi/10.1002/ev.1076/abstract.
ODI. Millennium Development Goals Report Card: Measuring Progress Across Countries. Technical report, Overseas Development Institute, London, 2010. URL http://www.odi. org/sites/odi.org.uk/files/odi-assets/publications-opinion-files/
6172.pdf.
PARIS21. The road map for a country-led data revolution. Technical report, Secre-tariat of the Partnership in Statistics for Development in the 21st Century (PARIS21), 2015. URLhttp://datarevolution.paris21.org/sites/default/files/Road_
map_for_a_Country_led_Data_Revolution_web.pdf.
Nana K. Poku and Jim Whitman. The Millennium Development Goals and Development after 2015. Third World Quarterly, 32(1):181–198, February 2011. ISSN 0143-6597. doi: 10. 1080/01436597.2011.543823. URL http://dx.doi.org/10.1080/01436597.2011. 543823.
Espen Beer Prydz. Knowing in time : How technology innovations in statisti-cal data collection can make a difference in development. PARIS21 Discussion Pa-per, (2), January 2014. URL http://www.paris21.org/sites/default/files/
PARIS21-DiscussionPaper2-Knowing.pdf.
Dimitri Sanga. The challenges of monitoring and reporting on the millennium development goals in africa by 2015 and beyond. Journal statistique africain, (12), May 2011.
Mary Bryna Sanger. Does Measuring Performance Lead to Better Performance? Journal of Policy Analysis and Management, 32(1):185–203, January 2013. ISSN 1520-6688. doi: 10.1002/pam.21657. URL http://onlinelibrary.wiley.com/doi/10.1002/pam. 21657/abstract.
SDSN. Data for development: A needs assessment for sdg monitoring and statistical capacity development. Technical report, Sustainable Development Solutions Network (SDSN), April 2015. URL http://unsdsn.org/wp-content/uploads/2015/04/
Data-for-Development-Full-Report.pdf.
James P. Spillane. Data in practice: Conceptualizing the data-based decision-making phenom-ena. American Journal of Education, 118(2):113–141, 2012.
Elizabeth Stuart, Emma Samman, William Avis, and Tom Berliner. The data revolution : Finding the missing millions. ODI Research Report 3, Overseas Development Institute (ODI), 203 Blackfriars Road London SE1 8NJ, April 2015.
Jeannette Taylor. Strengthening the Link Between Performance Measurement and Decision Making. Public Administration, 87(4):853–871, December 2009. ISSN 1467-9299. doi: 10.1111/j.1467-9299.2009.01788.x. URL http://onlinelibrary.wiley.com/doi/
10.1111/j.1467-9299.2009.01788.x/abstract.
UNDP. Beyond the Midpoint: Achieving the Millennium Development Goals. Technical re-port, UNDP, 2010. URL http://content.undp.org/go/newsroom/publications/
poverty-reduction/poverty-website/mdgs/beyond-the-midpoint.en.
Jan Vandemoortele. Ambition is golden: Meeting the mdgs. Developmen, 48:5–11, 2005. doi: 10.1057/palgrave.development.1100100. URLhttp://www.palgrave-journals.com/
development/journal/v48/n1/full/1100100a.html.
Jan Vandemoortele. The MDG Conundrum: Meeting the Targets Without Missing the Point.
Development Policy Review, 27(4):355–371, July 2009. ISSN 09506764. doi: 10.1111/ j.1467-7679.2009.00451.x. URL http://doi.wiley.com/10.1111/j.1467-7679. 2009.00451.x.
Jan Vandemoortele. Post-2015 agenda: mission impossible? Development Studies Research, 1 (1):223˝U232, 2014. doi: 10.1080/21665095.2014.943415. URL http://dx.doi.org/
10.1080/21665095.2014.943415.
Xiaohu Wang. Performance Measurement in Budgeting: A Study of County Governments.
Public Budgeting & Finance, 20(3):102–118, January 2000. ISSN 1540-5850. doi: 10.1111/0275-1100.00022. URLhttp://onlinelibrary.wiley.com/doi/10.1111/
Thomas Weiss, Jolly Richard, and Louis Emmerij. UN Ideas that Changed the World. Indiana University Press., Bloomington, 2009.
Jeffrey M. Wooldridge and Anastasia Semykina. Estimating panel data models in the presence of endogeneity and selection. Journal of Econometrics, (157):375–380, August 2010.
Jeffrey M. Woolridge. Econometric Analysis of Cross Section and Panel Data. The MIT Press, Cambridge, Massachusetts, second edition, 2010.
Table 1: MDG Goals and Targets
MDG Goals and Targets
Goal 1: Eradicate extreme poverty and hunger
Target 1.A: Halve, between 1990 and 2015, the proportion of people whose income is less than one dollar a day
Target 1.B: Achieve full and productive employment and decent work for all, including women and young people
Target 1.C: Halve, between 1990 and 2015, the proportion of people who suffer from hunger
Goal 2: Achieve universal primary education
Target 2.A: Ensure that, by 2015, children everywhere, boys and girls alike, will be able to complete a full course of primary schooling
Goal 3: Promote gender equality and empower women
Target 3.A: Eliminate gender disparity in primary and secondary ed-ucation, preferably by 2005, and in all levels of education no later than 2015
Goal 4: Reduce child mortality
Target 4.A: Reduce by two-thirds, between 1990 and 2015, the under-five mortality rate
Goal 5: Improve maternal health
Target 5.A: Reduce by three quarters, between 1990 and 2015, the maternal mortality ratio
Target 5.B: Achieve, by 2015, universal access to reproductive health
Goal 6: Combat HIV/AIDS, malaria and other diseases
Target 6.A: Have halted by 2015 and begun to reverse the spread of HIV/AIDS
Target 6.B: Achieve, by 2010, universal access to treatment for HIV/AIDS for all those who need it
Target 6.C: Have halted by 2015 and begun to reverse the incidence of malaria and other major diseases
Goal 7: Ensure environmental sustainability
Target 7.A: Integrate the principles of sustainable development into country policies and programmes and reverse the loss of environmental resources
Target 7.B: Reduce biodiversity loss, achieving, by 2010, a significant reduction in the rate of loss
Target 7.C: Halve, by 2015, the proportion of people without sustain-able access to safe drinking water and basic sanitation Target 7.D: By 2020, to have achieved a significant improvement in