warwick.ac.uk/lib-publications
Manuscript version: Published Version
The version presented in WRAP is the published version (Version of Record).
Persistent WRAP URL:
http://wrap.warwick.ac.uk/129828
How to cite:
The repository item page linked to above, will contain details on accessing citation guidance
from the publisher.
Copyright and reuse:
The Warwick Research Archive Portal (WRAP) makes this work by researchers of the
University of Warwick available open access under the following conditions.
Copyright © and all moral rights to the version of the paper presented here belong to the
individual author(s) and/or other copyright owners. To the extent reasonable and
practicable the material made available in WRAP has been checked for eligibility before
being made available.
Copies of full items can be used for personal research or study, educational, or not-for-profit
purposes without prior permission or charge. Provided that the authors, title and full
bibliographic details are credited, a hyperlink and/or URL is given for the original metadata
page and the content is not changed in any way.
Publisher’s statement:
Please refer to the repository item page, publisher’s statement section, for further
information.
MNRAS490,5218–5227 (2019) doi:10.1093/mnras/stz2888 Advance Access publication 2019 October 21
An unusually large gaseous transit in a debris disc
Daniela P. Iglesias ,
1,2‹Johan Olofsson,
1,2‹Amelia Bayo ,
1,2‹Sebastian Zieba,
3Mat´ıas Montesinos,
1,2,4Jonathan Smoker,
5Grant M. Kennedy ,
6Nicol´as Godoy,
1,2Blake Pantoja,
7Geert Jan Talens ,
8Zahed Wahhaj
5and Catalina Zamora
1,21Instituto de F´ısica y Astronom´ıa, Facultad de Ciencias, Universidad de Valpara´ıso, Av. Gran Breta˜na 1111, 5030 Casilla, Valpara´ıso, Chile 2N´ucleo Milenio de Formaci´on Planetaria – NPF, Universidad de Valpara´ıso, Av. Gran Breta˜na 1111, Valpara´ıso, Chile
3Institut f¨ur Astro- und Teilchenphysik, Universit¨at Innsbruck, Technikerstraße 25, 6020 Innsbruck, Austria
4Chinese Academy of Sciences South America Center for Astronomy, National Astronomical Observatories, CAS, Beijing 100012, China 5European Southern Observatory, Alonso de C´ordova 3107, Vitacura, Santiago, Chile
6Department of Physics, University of Warwick, Gibbet Hill Road, Coventry CV4 7AL, UK
7Departamento de Astronom´ıa, Universidad de Chile, Camino el Observatorio, Casilla 36-D, 1515 Las Condes, Santiago, Chile 8Institut de Recherche sur les Exoplan`etes, D´epartement de Physique, Universit´e de Montr´eal, Montr´eal, QC H3C 3J7, Canada
Accepted 2019 October 10. Received 2019 September 18; in original form 2019 August 17
A B S T R A C T
We present the detection of an unusually large transient gas absorption in several ionized species in the debris disc star HD 37306 using high-resolution optical spectra. We have been analysing a large sample of debris discs searching for circumstellar gas absorptions aiming to determine the frequency of gas in debris discs. HD 37306 stood out showing remarkably broad absorptions superimposed on to several photospheric CaII, FeII, and TiIIlines. The observed absorptions, unlike typical exocometary transits, lasted for at least eight days. Here, we analyse simultaneous spectroscopic and photometric data of the event and evaluate different scenarios that might explain the observed features. We conclude that the most likely scenario might be an exocometary break-up releasing a significant amount of gas close to the star, producing an occulting ‘ring’/‘torus’ shape.
Key words: comets: general – circumstellar matter – stars: individual: HD 37306 – planetary systems.
1 I N T R O D U C T I O N
Debris discs were long thought to be second generation dusty discs completely devoid of gas. However, this paradigm has changed in the last few years with the detection of gas in a growing number of young debris discs (e.g. K´osp´al et al.2013; Mo´or et al.2015; Rebollido et al.2018,and the references in Kral et al. 2017). In our ongoing survey to robustly estimate the fraction of debris discs harbouring circumstellar gas (described in Iglesias et al.2018), we have followed the methodology described in Kiefer et al. (2014b). In short, we searched for narrow absorption features superimposed on to the photospheric absorption lines in the CaIIdoublet H & K. These absorption features, when variable, can be interpreted as arising from comets falling towards the star (hence the term Falling Evaporating Bodies, FEBs).
Our survey sample consists of ∼300 objects selected with a methodology that is unbiased in terms of disc inclination. We have gathered several epochs of observations for∼91 per cent of them, compiling a rich data base of thousands of spectra. The full
E-mail:[email protected](DPI);[email protected](JO);amelia.bayo@ uv.cl(AB)
ity analysis will be presented in Iglesias et al. (in preparation), but in this work, we focus on a particularly intriguing object: HD 37306.
HD 37306, a bright A1V-type star, was previously studied by our team in Iglesias et al. (2018). With the data available at the time, we concluded that the two stable ‘extra’ components in the CaIIlines that the object presented, were of interstellar origin. In that study, we analysed 26 high-resolution observations from 2006 February to 2016 March where no variability was detected. Recently, we updated our data base collecting new publicly available observations of our sample from the ESO (European Southern Observatory) archive. We found eight new observations of HD 37306 taken in 2017 where remarkable additional absorption features in several metallic lines (also reported in Rebollido et al. in preparation) were detected, particularly large in the CaIIlines. In this study, we complement this data with additional spectroscopy and time-series photometry and present different scenarios to explain the origin of these transient features.
2 H D 3 7 3 0 6 : S T E L L A R PA R A M E T E R S A N D S P E C T R A L E N E R G Y D I S T R I B U T I O N
In Iglesias et al. (2018), we estimated some of the stellar properties by fitting Kurucz models (Castelli, Gratton & Kurucz1997) to the
C
2019 The Author(s) Published by Oxford University Press on behalf of the Royal Astronomical Society
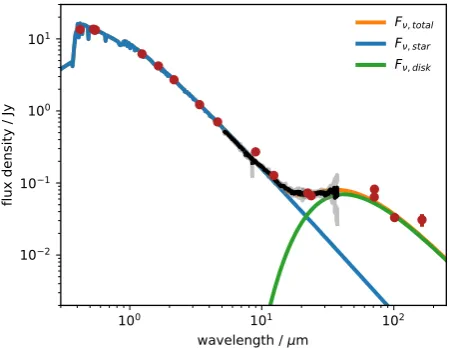
Figure 1. Flux distribution for HD 37306. Dots show photometry and the black and grey lines show theSpitzerIRS spectroscopy and uncertainty. The blue line shows the best-fitting stellar photosphere, and the green line the best-fitting modified blackbody for the disc.
CaII(at 3933.66 and 3968.47 Å) and NaI(at 5889.95 and 5895.92 Å) doublets. We estimated avsiniof 140±5 km s−1(consistent
with previous estimates), a Teff of 8800 ± 50 K (in agreement
withGaiaDR2 estimate of 9138±297
386K, Gaia Collaboration2018),
loggof 4.15± 0.38 dex and [Fe/H] of−0.12± 0.22. We also estimated a heliocentric radial velocity of 23.49 ± 1.28 km s−1,
consistent with the previous measurement found in the literature of 23.00±0.70 km s−1(Gontcharov2006). HD 37306 is located at a
distance of 70.46±0.39 pc (Gaia Collaboration2018) and it has been reported to be a member of the Columba Association (Zuck-erman & Song2012). We assessed the probability of belonging to the Columba Association with theBANYAN1(Bayesian Analysis
for Nearby Young AssociatioNs) tool (Gagn´e et al.2018) and confirmed its membership with a 99.3 per cent probability. Inciden-tally, an isochronal age of 28.53±307.72
28.52 Myr was estimated for the
object using VOSA2(Bayo et al.2008) based on the spectral energy
distribution (SED) fitted parameters and different sets of isochrones (Baraffe et al.1998; Siess, Dufour & Forestini2000). Thus we adopt the age of 30 Myr of the Columba Association (Torres et al.2006). Ages from the literature range between 10 (e.g. Ballering et al.
2013; De Rosa et al.2014; David & Hillenbrand2015) and 453 Myr (Gontcharov2012).
Regarding its known local properties, HD 37306 is surrounded by a debris disc (Zuckerman & Song2012), confirmed by the excess emission in the SED (see Fig.1). We have fit model grids for the star and disc to the data. We used synthetic photometry of the models to fit the photometry, and resampled model spectra to fit the IRS (Infrared Spectrograph) spectrum. The model is composed of a PHOENIX model atmosphere (Husser et al.2013) at a given temperature, which is normalized to the optical photometry by solid angle, and a model for the thermal emission depending on the temperature of the dust, where thePlanckfunction is normalized to the mid-/far-infrared emission by, basically, the dust mass in the disc. The best-fitting model parameters are found with the
MULTINESTcode (Feroz, Hobson & Bridges2009), with both the
1http://www.exoplanetes.umontreal.ca/banyan/banyansigma.php 2http://svo2.cab.inta-csic.es/theory/vosa/
Table 1. Spectroscopic data used in this work. Instrument, number of spectra per night, and UT dates of each observation.
Instrument NSpectra Dates
HARPS 4, 2, 2, 2, 2 2006-02-[08, 09, 10, 11, 13] HARPS 2, 2 2006-03-12, 2006-11-18 HARPS 2, 2, 2 2007-12-[05, 06, 10]
FEROS 2 2015-10-23
FEROS 1, 1 2016-03-[28, 29]
FEROS 2, 1, 2, 1, 1, 1 2017-09-[23, 24, 25, 26, 27, 30]
MIKE 1 2019-03-18
stellar and disc parameters found simultaneously. The best-fitting model has a stellar Teff = 9100 K, consistent with the previous
estimates. The dust component has a temperature of 120 K and fractional luminosityLdisc/L =(7±0.2)×10−5. Based on this
temperature and the stellar luminosity of 17L, the blackbody radius for the dust is 21 au. A weak silicate feature is visible in the IRS spectrum when the best-fitting model is subtracted, indicating that at least some small (∼μm sized) dust is present, and therefore that the dust is not entirely comprised of grains large enough to behave as blackbodies. Thus, the true distance of the dust from the star is likely larger than 21 au, probably of the order of 50 au.
3 O B S E RVAT I O N S A N D DATA A N A LY S I S
3.1 Spectroscopic data
We have collected a total of 35 high-resolution (R = 48 000– 115 000) optical spectra from different instruments with wavelength coverages within a rangeλ∼3350–9500 Å, combining our own observations and others from the ESO archive. Our data set includes spectra taken with HARPS (High Accuracy Radial velocity Planet Searcher; Mayor et al.2003) mounted on the ESO 3.6-m telescope and FEROS (Fiber-fed Extended Range Optical Spectrograph; Kaufer et al.1999) on the MPG/ESO 2.2-m telescope, both at La Silla Observatory in Chile, and MIKE (Magellan Inamori Kyocera Echelle; Bernstein et al. 2003) mounted on the Magellan-Clay telescope at Las Campanas Observatory, Chile. The dates of the observations, the instruments used and the number of spectra per night are summarized in Table1.
All the observations were reduced using the standard pipelines of each instrument. The ESO spectra were downloaded from the Phase 3 portal, and the MIKE spectra were reduced with the CarPy pipeline (Kelson et al. 2000; Kelson 2003). Barycentric radial velocity corrections were applied to the MIKE spectra as these corrections are not included in its pipeline. Telluric line contamination was removed usingMOLECFIT3(Smette et al.2015; Kausch et al.2015) in the same way as in Iglesias et al. (2018).
In order to quantify the extra absorption features detected in 2017 September, we normalized each spectral line and computed a median from all the observations without the absorption along with another median from all the observations where the additional absorption was detected. An example for the CaIIK line can be seen in Fig.2. Then, we divided the median containing the absorption by the median with no detection to analyse the properties of the feature isolated from the photospheric line and additional interstellar features.
3http://www.eso.org/sci/software/pipelines/skytools/molecfit
[image:3.595.309.550.83.177.2]5220
D. P. Iglesias et al.
[image:4.595.47.280.57.270.2]Figure 2. All the CaIIK line observations of HD 37306 normalized and overplotted for comparison. The median spectra of all the epochs before and during the event are shown in red and blue, respectively. The spectrum taken in 2019 March 18 is highlighted in green. The stellar radial velocity is marked with a dashed line.
Table 2. Parameters of the observed absorption lines. Element, observed wavelength of the transition in air, heliocentric radial velocity of the absorption, logarithm of the apparent column densityN, equivalent width, and Doppler broadening parameterb. Errors inVare in the order of 2–3
km s−1and for log10N, EW, andbare in the order of 10–15 per cent.
Element Wavelength V log10N EW b
(Å) (km s−1) (cm−2) (mÅ) (km s−1)
TiII 3759.30 26.11 12.16 35.21 26.58 TiII 3761.33 25.49 11.88 23.62 26.47 CaII 3933.66 22.00 12.57 276.11 31.95 CaII 3968.47 26.54 12.87 273.05 29.92 FeII 4233.16 25.12 13.75 22.71 30.98 FeII 4549.47 26.85 13.82 27.63 34.75 FeII 4555.89 18.90 14.12 17.05 46.76 FeII 4583.83 25.08 13.90 26.51 32.72 FeII 4629.33 28.17 14.04 11.50 35.16 FeII 4923.92 22.43 13.13 30.10 35.41 FeII 5018.44 25.59 13.40 41.39 33.95 FeII 5169.03 24.14 12.98 50.60 33.88 FeII 5197.57 25.27 13.50 11.20 28.23 FeII 5234.62 25.96 13.89 14.17 30.51 FeII 5275.99 24.76 13.62 13.20 28.24 FeII 5316.61 28.40 13.89 26.69 30.87 FeII 6247.56 24.39 13.68 9.86 36.40 FeII 6456.38 24.43 13.67 13.64 31.25 CaII 8498.02 22.49 13.17 99.65 36.37 CaII 8542.09 22.32 13.00 379.12 34.51 CaII 8662.14 24.72 12.90 264.05 33.64
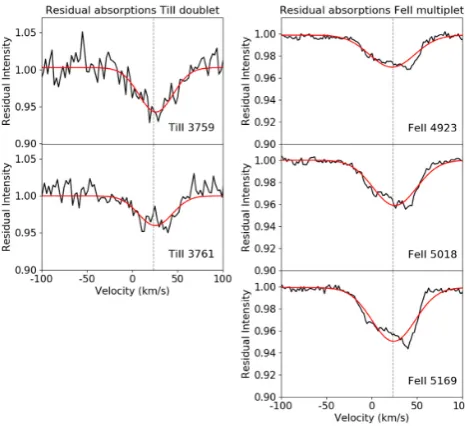
[image:4.595.308.541.334.547.2]We consider as a ‘detection’ those absorptions in the residual spectrum (resulting from the division of the medians) that exceed 3σ. As these residual features are unusually wide, and thus, seem to be dominated by Doppler broadening we fit Gaussian profiles to these absorptions in order to estimate their parameters (see Table2). Examples of these residual absorptions and their Gaussian fits are shown in Fig.3for the CaIIlines and Fig.4for TiIIand FeII.
Figure 3. Median of the residuals of the CaII doublet and triplet of HD 37306. Gaussian fits in red. The CaIIline at 8542 Å is truncated due to an instrumental gap. Again, the radial velocity of the star is marked with a grey dashed line.
Figure 4. Median of the residuals of the TiIIdoublet and FeIImultiplet of HD 37306.
The observed wavelength of each transition in air values were taken from the NIST Atomic Spectra Database.4The heliocentric
radial velocities of the absorptions were estimated from the centre of the Gaussian fits. The apparent column densitiesNwere computed following Savage & Sembach (1991) using oscillator strength values from Morton (1991) in the case of CaIIand from the NIST Atomic Spectra Database for TiIIand FeII. Equivalent width and Doppler broadening parameter b were also derived from the Gaussian fit, with b=FWHM/2√ln 2. The instrumental effects on bare negligible in this case.
4https://www.nist.gov/pml/atomic-spectra-database
MNRAS490,5218–5227 (2019)
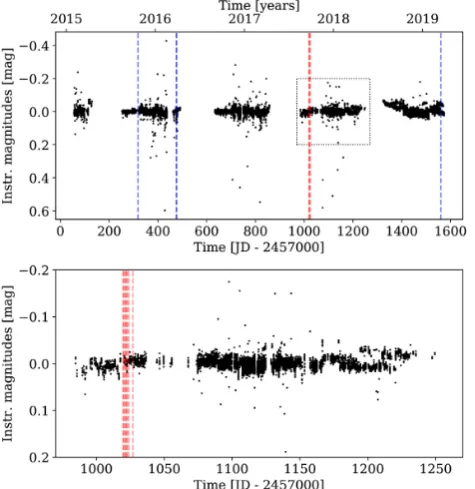
[image:4.595.43.284.398.645.2]Figure 5. Upper panel: the full MASCARA light curve of HD 37306. The blue and red vertical dashed lines indicate the times of spectroscopic observations as seen in Table 1. The marks in red correspond to the spectroscopic observations presenting the event. No variations were detected in spectroscopic observations of the epochs marked in blue. Lower panel: zoom into the black dotted box seen in the upper panel.
3.2 Photometric data
In order to complement our spectroscopic observations, we mined photometric data bases for simultaneous observations. In particular, we collected photometric measurements from MASCARA North (Multi-site All-Sky CAmeRA; Talens et al.2017, 2018), ASAS-SN (All-Sky Automated Survey for Supernovae, Shappee et al.2014; Kochanek et al. 2017), and TESS (Transiting Exoplanet Survey Satellite, Ricker et al.2015).
3.2.1 Multisite All-Sky CAmeRA
MASCARA North (Talens et al. 2017, 2018), located at the Observatorio del Roque de los Muchachos on La Palma, observed HD 37306 between 2015 February and 2019 April for several hours each night the star was visible. Photometry was extracted from the 6.4 s cadence observations and processed using the primary calibration procedure outlined in Talens et al. (2018), which uses groups of stars to correct for systematics common to many light curves. This primary calibration corrects for the effects of the variable atmosphere, the camera transmission and intrapixel variations before binning the data to a cadence of 320 s. After binning, a secondary calibration step is used to remove residual systematics in the light curves of individual stars. The fully calibrated light curve is shown in Fig.5 (upper panel).
[image:5.595.313.545.58.199.2]Part of the observations were taken simultaneously with the 2017 spectroscopic campaign, as can be seen in Fig. 5 (zoom-in the lower panel). These observations started 2017 mid-September. No significant change in flux was observed during or after this time.
Figure 6. The fullTESSlight curve of the star HD 37306. The gap of about one day in the light curve is caused by a pause in observations due toTESS downlinking the data to Earth.
3.2.2 ASAS-SN
The ‘ASAS-SN’project (Shappee et al.2014; Kochanek et al.2017) consists of 24 telescopes in different locations around the globe. This survey has taken multiple observations of HD 37306 from 2013 September 19 up to date. In this case, we took into account the fact that the observations were taken with several different instruments and normalized each light curve per instrument by its median value for better comparison. However, similar to the observations taken with MASCARA, no significant changes were detected in the light curves.
3.2.3 TESS
The TESS (Ricker et al. 2015) observed HD 37306 in its sixth sector from 2018 December 12 to 2019 January 06 (unfortu-nately not within the spectroscopic transient event). HD 37306 (TIC 287842651,T =6.08 mag) is one of the pre-selected targets for which short cadence (i.e. 2-min) data are provided. We use the 2-min Presearch Data Conditioning (Smith et al.2012; Stumpe et al. 2012) light curve from the Science Processing Operations Center (SPOC) pipeline (Jenkins et al.2016; Jenkins2017), which was originally developed for the Kepler mission (Jenkins et al.
2010). These light curves are corrected for systematics by the SPOC pipeline. We also remove every measurement with a non-zero ‘quality’ flag (see section 9 in the TESS Science Data Products Description Document5) which mark anomalies like cosmic ray
events or instrumental issues. This finally gives as a time span of 21.8 d and a duty cycle of 95 per cent. The resulting full light curve can be seen in Fig.6.
A frequency analysis using the software package PERIOD04 (Lenz & Breger 2005) that combines Fourier and least-squares algorithms was conducted. It reveals no significant frequencies down to a signal-to-noise ratio of 4 (following the analysis in Breger et al.1993).
3.3 Imaging data
Additionally, we collected publicly available SPHERE (Spectro-Polarimetric High-contrast Exoplanet REsearch, Beuzit et al.2019) observations of HD 37306 from the ESO archive (program ID
5https://archive.stsci.edu/missions/tess/doc/EXP-TESS-ARC-ICD-TM-00 14.pdf
5222
D. P. Iglesias et al.
095.C-0212). The observations were performed using the dual-band imaging mode IRDIFS (InfraRed Dual-dual-band Imaging Field Stabilized,H2H3, Dohlen et al.2008; Claudi et al.2008; Vigan et al.2010). Basic data reduction was performed using the SPHERE Data Reduction Handling pipeline (Pavlov et al.2008), to perform background subtraction, flat-field, and bad pixels corrections, and to determine the position of the star behind the coronograph. To try to detect the debris disc, we processed the data using the angular differential imaging technique (Marois et al.2006; Gomez Gonzalez et al.2017) by performing a principal component analysis before de-rotating and stacking the pupil-tracking observations. The sky rotation achieved during the observations was of 29.2◦. We removed between 1 and 25 principal components, but did not detect the disc in the reduced images. The 5σ contrast achieved were in the order of 14.6 mag at 1 arcsec and 16.8 mag at 3 arcsec. The FOV of 11 arcsec x11 arcsec considering the star is located at∼70 pc yields a coverage of∼(775 au)2. Given the extra absorption detected in the
CaII, FeII, and TiIIlines, if the event is related to a body belonging to the debris disc, the disc is most likely close to edge-on, the most favorable case for a detection using angular differential imaging (Milli et al.2012). Despite this possible favourable orientation, the non-detection of the disc with SPHERE can most likely be explained either with a very small disc close to the star, or a low surface disc brightness (either an intrinsically faint disc or a radially very extended one).
4 T R A N S I E N T S P E C T R O S C O P I C E V E N T
In every observation of HD 37306 taken in 2017 September with the FEROS spectrograph, unusually large additional absorption features were present in the CaII lines and other metallic lines such as TiIIand FeII. These observations cover a range of eight consecutive nights and the absorptions are consistently present during the whole time range. Once we analysed this data set, on 2019 March, we took a new epoch of data with MIKE, and found that the additional absorptions had disappeared, going back to the ‘quiescent’ stage. Unfortunately, we cannot determine the duration of the event detected in HD 37306 because previous and posterior data were taken∼1.5 yr apart. Therefore, we can only state that the event lasted at least eight days, but less than three years. A detailed view of the CaII K line is shown in Fig. 2. The large additional absorption detected in 2017 can be appreciated in blue, while previous and posterior data only show two narrow features of interstellar origin (Iglesias et al.2018).
We analysed other typical gas tracers such as NaI, OI, and the Balmer lines, not finding any change to our 3σ threshold (see Section 3.1). We also studied SiO bands as collision (hypervelocity impact) released gas would be expected to recondense, but we observed no change on those bands either.
The absorptions in the H and K lines are equally intense due to saturation, suggesting optically thick material. Based on the absorption depth of the CaII H & K lines and following the guidelines in Kiefer et al. (2014a), we estimated that the stellar fraction covered by the gas would be∼37 per cent and that the gas could be roughly located at about 15 stellar radii (or about 0.14 au for the typical size of an A1V-type star of 2.0R, Pecaut & Mamajek
2013). The higher temperature closer to the star is consistent with the detection of only ionized species and not neutral, and is also consistent with the feature exhibiting broader components due to thermal broadening.
The full width at half-maximum of the absorption features are in the order of ∼50 km s−1, much larger than the typical
values observed during exocometary transits (10–15 km s−1, Beust,
Karmann & Lagrange2001; Kiefer et al.2014a) and their radial velocities are centred close to the stellar one, as can be seen in Figs3and4, and in Table2. There are no significant changes either in the intensity of the absorptions or their radial velocities during the 2017 September period. Regarding the duration and stability of this event, although we do not know exactly how long it lasted, a duration
≥8 d is remarkably high in the context of exocometary transits, as they usually evolve in less than 1 d (Kiefer et al.2014b; Welsh & Montgomery2018). Considering the characteristics of the features, we expect that the gas producing them would be close to the star, as the radiation pressure on the ions is larger and acts more efficiently at shorter distances. A high radiation pressure could be responsible for a higher velocity dispersion of the ions, leading to broader components (Beust et al. 1991). Recent work by Lin & Chiang (2019) highlights the possibility that gas released from bodies that are on eccentric orbits, whether they be planetesimals or smaller dust, should also reside on an eccentric orbit. Thus, it is possible that some or all of the gas velocity dispersion is related to its origin, rather than radiation pressure acting solely on the gas.
5 D I S C U S S I O N
We here explore different possibilities that might explain the observed absorptions and evaluate which one could be the most likely scenario.
5.1 Instrumental artifact
In order to discard the possibility that the absorptions might be due to an instrumental issue, we also analysed spectra from other A-type stars taken during the same nights with the same instrumental set-up. We did not detect any similar event in these other sources, thus firmly ruling out any possible instrumental artefact.
5.2 Circumstellar shell
A possible explanation for the observed spectroscopic event could be a circumstellar shell. This scenario could explain the long duration and stability of the absorptions. In addition, absorption features in the TiIIand FeIIlines are usually present in shell stars. However, shell stars typically present narrow absorption features at the core of the Hydrogen lines (Slettebak1986; Gray & Corbally
2009). As previously mentioned, we analysed the Balmer H lines of HD 37306, not finding any sign of non-photospheric absorption or emission or any variation at all (to a 3σ level) through all the observations. The relatively low projected rotational velocity of HD 37306 (considering we are discussing fast rotators given the spectral type) of 140 km s−1also argues against this scenario, since,
according to Abt (2008) and Abt, Tan & Zhou (1997), evidence of ‘shell-like’ circumstellar gas is mainly detected for stars with
vsini>200 km s−1. Although the origin of circumstellar shells is
unclear, some studies suggest they are accreted by rapidly rotating stars (vsini≥200 km s−1) from the interstellar medium (ISM, Abt
2015). In this particular case, it would be unlikely that HD 37306 accreted and lost such a shell within three years. On the other hand, considering the possibility of the shell being expelled from the star, as it seems to be the case for fast rotating super giants (e.g. Gvaramadze et al.2018; Kourniotis et al.2018), the lack of signs of stellar activity in the Balmer lines and the not high enough projected rotational velocity do not favour this possibility either.
MNRAS490,5218–5227 (2019)
5.3 Exocometary break-up
Another reasonable model for the week-long absorptions might be similar to what was proposed for the star KIC8462852 (Boyajian et al.2016; Wyatt et al.2018): a family of exocomets observed after breakup. We consider the possibility of an optically thick ‘stream’ of ionized gas that fills out some fraction of its orbit.
To have a better estimate of the configuration that could lead to an event lasting over several days, we tried to model the extra absorption line with a ‘toy model’ of an eccentric gaseous disc. This model does not properly calculate the optical depth for different velocities but rather computes a histogram of the number of particles that have a certain velocity and are passing in the line of sight of the star.
A given model is fully described by the following parameters, the inner semimajor axisr0, the radial width of the discr, the
eccentricitye, inclinationi, position angleφ, argument of periapsis
ω, opening angleψ, stellar mass Mstellar radius R, and stellar
radial velocityRv(the latter three values being fixed to 2.15 M,
2.0 R, and 23.5 km s−1, M
and Rtaken from Pecaut & Mamajek
(2013)6andR
vfrom Iglesias et al. (2018). We then draw 2 000 000
particles, and each particle has the following orbital parameters; a semimajor axisrdrawn uniformly betweenr0andr0+r, an
inclination (and position angle) drawn from a normal distribution centred ati(andφ, respectively) with a standard deviation ofψ, with all the particles sharing the same argument of periapsisω. Then, we take the mean anomaly uniformly between [0, 2π), solve Kepler’s equation for the eccentric anomaly and compute the true anomalyνfrom it. We can then compute the positions and velocities (x,y,z,vx,vy,vz) of each particle (zbeing the direction towards the
observer). The code checks which one is passing in the line of sight of the star (x2+y2≤R
andz >0) and saves its radial velocity
vz. We compute the histogramFmodof allvz(with the same binning
as the observations) that satisfied the aforementioned criteria and try to fit it to the observationsFobs. We first compute the scaling
factor that minimizes theχ2, as
fscale=
Fmod×(Fobs−1)
σ2
Fmod
σ
2 . (1)
We subtract−1 fromFobsbecause the observations are normalized
to 1, while the histogram starts at 0. The final model is then obtained asFmod =1+Fmod×fscale. As already mentioned, this approach
really is a ‘toy model’ as we do not compute the optical depth in the photospheric line as a function of the radial velocity. Therefore, we cannot really constrain the vertical extent of the disc for instance, but this allows us to have a first-order approximation of where the gas should be to reproduce the velocity dispersion that we observe around HD 37306.
The problem is highly degenerate, and after several tests we settled on the following free parameters: the inner radiusr0, the
ratio between the width of the disc and the inner radius r/r0,
the eccentricitye, and the argument of periapsisω. The value of the position angle does not matter for the modelling, and we fix i= 90◦ andψ = 0.05. To find the best-fitting solution, we use an affine invariant ensemble sampler Monte Carlo Markov Chain,
[image:7.595.321.538.58.220.2]6http://www.pas.rochester.edu/ emamajek/EEM dwarf UBVIJHK colors Teff.txt
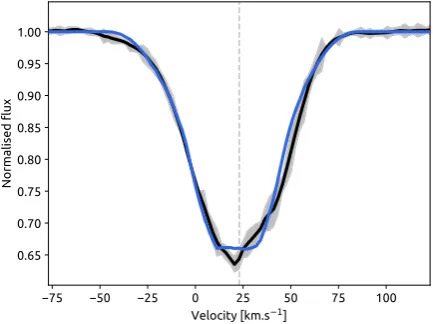
[image:7.595.319.538.263.451.2]Figure 7. Model of the exocometary break-up (blue) to the CaIIK line absorption during the event (black).
Figure 8. Top view of the best-fitting model. Observer located at the bottom. The colour scale shows the radial velocity and the red shaded area shows where we estimate the velocity dispersion to fit the observations (the radial velocity of the star has been subtracted in this plot).
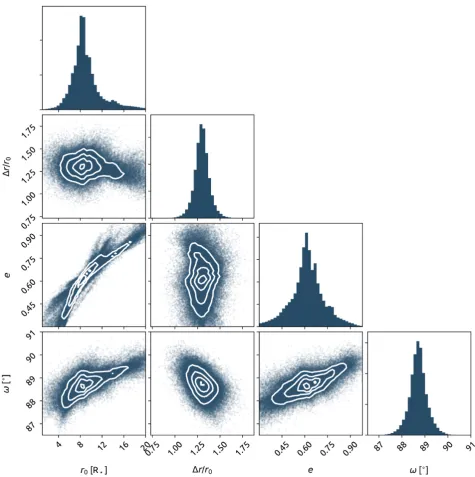
implemented in theEMCEEpackage (Foreman-Mackey et al.2013), using 100 walkers, a burn-in phase of 1000 steps and a final length of 2500 steps. At the end of the run, we find an acceptance fraction of 0.26 and the maximum autocorrelation length among the four free parameters is 43 steps. Fig.7shows the best-fitting model to the observations, Fig. 8shows the top view of the same model, and the probability distributions are shown in Fig. 9(using the
CORNERpackage, Foreman-Mackey2016). From those probability distributions, we derive the 16th and 84th percentiles to estimate the uncertainties, which are reported in Table3. From Fig.9, it is clear that the inner edge of the disc (r0) and the eccentricity of the
disc (e) are coupled, as expected, given that we are only modelling the radial velocity dispersion. Furthermore, one should note that because the input parameter isr/r0(and not simplyr), there
is also a degeneracy between the latter value and r0 (and hence
witheas well). We find that the gaseous disc should have inner and outer edges with semimajor axis between 8.5 and 19.6 R, and
hence should be quite extended in the radial direction. Those values yield orbital periods between 5.5+−21..76and 19.4+
5.6
−5.1d, suggesting that
overall, the gaseous disc would have to survive between half and
5224
D. P. Iglesias et al.
Figure 9. Probability distribution for the modelling results of the gaseous disc.
Table 3. Free parameters, priors, and best-fitting results for the modelling of the observations assuming a gaseous disc around HD 37306.
Parameters Prior Best fit
r0(R) [1, 20] 8.5+−21..67 r/r0 [0.1, 5] 1.3+−00..11
e [0.3, 0.98] 0.6+−00..11
ω(◦) [80, 100] 88.7+−00..33
one full orbit. Considering that the chances of detection increase for longer periods and that the gas does not present significant variations over the 8 d it was observed, it is more likely that the disc should have survived close to one full orbit. The eccentricity should be
around 0.6, and we find that the pericentre of the disc should lie in between the star and the observer. This is because this configuration produces the largest radial velocity dispersion, and we do not find exactly 90◦because of the slight asymmetry of the profile. If we consider the inclination of the orbiting material is close to 90◦and that the lower limit on the stellar fraction covered by the gas is
∼37 per cent, then a lower limit on the opening angle of the disc should lie between 0.015 and 0.035, at the outer and inner edges of the disc, respectively. We should note that the model ignores the possible effect of radiation pressure, which might accelerate the dissipation of the gas.
Because the vast majority of the 2 000 000 particles do not pass in front of the star, the final modelled spectrum can be relatively noisy. Instead of increasing significantly the number of particles we smooth the modelled spectrum using a moving box; each velocity
MNRAS490,5218–5227 (2019)
[image:8.595.64.264.603.673.2]bin is the mean value of the three neighbours before and three neighbours after (including the bin that is evaluated). Because the observed spectrum is also noisy, especially close to the minimum, we also smooth it in a similar fashion.
As can be appreciated in Fig. 7, the model reproduces the absorption profile quite closely and the scenario is compatible with the duration of the event. In addition, the lack of detection in the simultaneous photometric observations taken with MASCARA and ASAS-SN could be explained by not reaching the sensitivity required to detect an exocomet transiting an A-type star. For instance, the first photometric detection of exocomets crossing in front ofβPictoris (also an A-type star) were performed usingTESS observations and the dips were reported to have depths between 0.5 and 2 mmag (Zieba et al. 2019). Between MASCARA and ASAS-SN, MASCARA reached the best sensitivity withσ=17.7 mmag, clearly not sensitive enough to have a detection similar to those inβPictoris. Unfortunately, the availableTESSobservations of HD 37306 were not simultaneous with the spectroscopic event.
5.4 Colliding trojans
We studied the possibility of such a long-lasting absorption being due to colliding trojans producing gas in the Lagrangian points of a possible hidden planet. But, in order to be so close to the star and transit for so long, the orbit of the planet needs to be highly eccentric. We performed hydrodynamical simulations of a gaseous disc with an embedded Jupiter mass planet using our modified version (Montesinos et al. 2015) of the FARGO code (Baruteau & Masset2008). The surface disc density is defined by
(r)=0[1au]r , where0=0.1 g cm−2, andrthe distance to the
star in au. We assume a viscous fluid with a turbulent viscosity (Shakura & Sunyaev 1973) given by α = 10−3. Under these
circumstances, most of the gas is accreted during the simulation (105
yr), remaining an optically thin layer of gas with a gap (carved by the planet). The resulting low-density disc could be compatible with the lack of detection of a stable gas component. The quantification of the lack of detection is, however, out of the scope of this paper, since stability arguments discard this scenario (see below). On top of that simulation, we followed the evolution of (100 000) dust particles with different sizes ranging from micrometres to centimetres, where the dust is affected by the gas dynamics due to drag and drift forces. In addition to these forces, the dust particles feel the gravitational potential from the star. The self-gravity of the disc was neglected (details of our dust code can be found in Cuello et al.2019).
We found that the presence of a Jupiter mass planet in a circular orbit carves a gap in the gaseous disc with a large dust particle concentrations (∼1 Earth-mass) located at the Lagrangian points (L4 and L5) of the giant planet (in agreement with Lyra et al.
2009). In this case, the dusty trojans rotate at Keplerian velocity with zero eccentricity. For Jupiter mass planets with eccentricities higher than 0.1, we found that the dust is not able to accumulate in the Lagrangian points. It is worth mentioning that in order to explain the observations, trojan eccentricities should be at least 0.6.
5.5 Planetary transit
[image:9.595.311.545.56.225.2]Planetary transits are very difficult to detect in A-type stars using photometry given the brightness of the star compared to the shadow produced by a planet. However, the brighter the star, the higher the signal-to-noise ratio of the transiting planet atmospheric spectrum. Here, we propose a couple of scenarios involving a transiting planet.
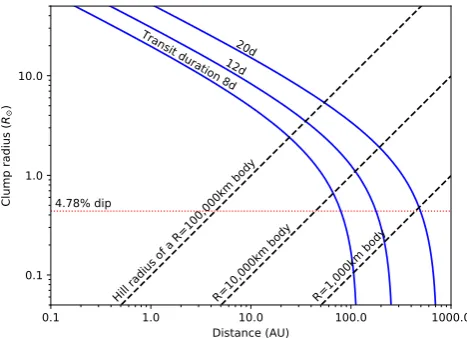
Figure 10. Distance to the star versus size of an optically thick, spherical dusty clump on circular orbits around the star. The solid blue lines show the transit duration, diagonal black dashed lines show Hill radii of planets of different sizes, and the red dotted line shows the minimum size the clump should have in order to have a 3σdetection in the MASCARA photometry, which corresponds to a 4.78 per cent dip in the light curve.
A possible scenario could invoke a planet passing at close enough distance to the star allowing sublimation of its atmosphere (or even surface) to occur. To better understand the possible location and size of what could be causing the observed absorptions, we explore the scenario-independent constraints, similar to the analysis done in Boyajian et al. (2016). Fig.10(analogue to fig.10in Boyajian et al.
2016) shows constraints for the duration of the transit, assuming that the clump causing the dip is opaque and moves in circular orbits around the star. As mentioned in previous sections, for the stellar parameters we assumeR=2.0R andM=2.15M(Pecaut &
Mamajek2013). Following Boyajian et al. (2016), if the clump is much less massive than the star of massMand orbits at a distance dfrom the star, then the relation between the clump radiusrand the duration of the transittis given by,
r ≈1.85t
M
d −R. (2)
In this scenario, we are assuming the clumps to be spherical and, basically, formed by a planet (or planetesimal) and the accumulation of sublimating material (gas and dust) inside its Hill sphere of radius RHill=d(Mpl/[3M])1/3.
Having no significant dip detected in the light curves (>3σ), the clump size must be under this detection limit (dotted red line in Fig.10), which, consideringR=2.0R, translates intor≈0.44R.
In order for the duration of the transit to be of at least eight days and be under the photometric detection limit, the clump should orbit at a distance≥∼100 au. At this distance, the temperature would be too low for the planet to sublimate producing large dense clouds around it, and for the gas to ionize. In addition, if the probability of having a planetary transit is∼R/d, then at∼100 au this probability would
be of 9.3×10⁻⁵, making the probability of the detection very low.
We could also consider the case of a forming planet having a Hill sphere full of gas. At the very early phase of planet formation, the planet has an intrinsic luminosity due to accretion (peaking in L, L bands), and what we would see would be actually the circumplanetary disc (not the planet itself). In this case, a forming (accreting) planet should be very bright (one should expect 10−3–
10−6L
during the first million years of formation; Mordasini et al.
5226
D. P. Iglesias et al.
2012). This scenario only makes sense in a gas-rich environment, therefore this is not likely to be the right explanation taking into account the debris disc nature and age range of the system. In addition, as discussed in the first case, to explain an eight days transit the forming planet would have to be far away from the star but, at the same time, the gas would have to be ionized, making the second possible explanation in this section very unlikely as well.
5.6 Possible interstellar origin
In the diffuse ISM, CaIIand TiIIare pretty well correlated (Hunter et al. 2006) and the NaI/CaII ratio ranges from 0.1 to 1000 (Siluk & Silk1974; Vallerga et al.1993) depending on the dust and ionization state of the CaII, which is not in disagreement with our detection. However, the median value of thebvalue for CaII
components is 1.3 km s−1 in the diffuse ISM, corresponding to a
kinetic temperature of around 4100 K (Welty, Morton & Hobbs
1996). Ourbvalues for the CaIIcomponents are of 33.2 km s−1
on average, which would correspond either to very high turbulent velocities (>20 km s−1) or extremely high kinetic temperatures (>
2×10⁶K). More importantly, interstellar features do not show
such strong variations within short periods (e.g. Smith et al.2013; McEvoy et al.2015), thus the appearance and disappearance of a large component within three years would be very unlikely. Besides, the star is at∼70 pc, thus it is located inside the local bubble where column densities do not reach such high values. For instance, at 100pc logN(CaII) ∼11.5 cm−2 (Hunter et al. 2006),
and the observed absorptions have on average a logN(CaII) of
∼12.9 cm−2.
6 C O N C L U S I O N S
We detected unusually broad spectral absorption features from ionized gas species in the debris disc system HD 37306. The stellar spectra present stable non-photospheric absorption lines superimposed on to several CaII, FeII, and TiIIlines over a time range of at least eight days.
We analysed simultaneous spectroscopic and photometric ob-servations of HD 37306 before, during and after the event and found no significant change in the photometric data that might be correlated with the spectroscopic event. We also analysed high angular resolution SPHERE images of the target but the disc was not detected.
We evaluated several scenarios aiming to determine which one would provide the most likely explanation for the particular features detected in HD 37306. We were able to reasonably discard some possibilities such as an instrumental artefact, colliding trojans or an interstellar origin. Other options such as a circumstellar shell or a planetary transit cannot be completely ruled out, but remain as very unlikely possibilities.
We conclude that the most likely scenario would be the transit of a family of exocomets observed after breakup releasing a large amount of gas close to the star, at a few stellar radii. Our model reproduces satisfactorily the broad profile of the absorption feature and is in agreement with the duration of the event. A rather strong limitation of this scenario is that radiation pressure should dissipate CaIIon short time-scales and this effect is not considered in our model.
Due to the stochastic nature of the event we reported in this study, it will be challenging to further characterize what happened during 2017. Future ALMA (Atacama Large Millimiter Array) observations may help detect other gas tracers in emission, such as
CO, that could have been released during this event, and may help us figure out the processes involved in this unusual week-long event. We will perform further high-resolution spectroscopic observations of this system aiming to possibly detect any kind of additional events and characterize them to have a better understanding of the system. Given the rarity of this event, we aim to obtain an estimate of the occurrence rate of such phenomenon in debris disc stars.
AC K N OW L E D G E M E N T S
AB, DI, JO, MM, and NG acknowledge support from ICM (Iniciativa Cient´ıfica Milenio) via N´ucleo Milenio de Formaci´on Planetaria. AB acknowledges support from FONDECYT regular grant 1190748. JO acknowledges financial support from the Uni-versidad de Valpara´ıso, and from Fondecyt (grant 1180395). MM acknowledges financial support from the Chinese Academy of Sci-ences (CAS) through a CAS-CONICYT Postdoctoral Fellowship administered by the CAS South America Center for Astronomy (CASSACA) in Santiago, Chile. GMK is supported by the Royal So-ciety as a Royal SoSo-ciety University Research Fellow. NG acknowl-edges grant support from project CONICYT-PFCHA/Doctorado Nacional/2017 folio 21170650. Based on observations collected at the European Southern Observatory under ESO programmes: 076.C-0279(A), 078.C-0209(A), 080.C-0712(A), 094.A-9012(A), 099.A-9029(A), and 095.C-0212(B). DI thanks Isabel Rebollido and Dr. Benjam´ın Montesinos for their insightful comments on this paper. This paper includes data collected by the TESS mission, which are publicly available from the Mikulski Archive for Space Telescopes (MAST). Funding for the TESS mission is provided by the NASA Explorer Program. This research has made use of the SIMBAD data base, operated at CDS, Strasbourg, France, and ASTROPY, a community-developed corePYTHONpackage for Astronomy (Astropy Collaboration et al.2013). This work has made use of data from the ESA space missionGaia(http://www.cosmos .esa.int/gaia), processed by the Gaia Data Processing and Analysis Consortium (DPAC,http://www.cosmos.esa.int/web/gaia/dpac/con sortium). Funding for the DPAC has been provided by National Institutions, in particular the institutions participating in the Gaia Multilateral Agreement. This publication makes use of VOSA, developed under the Spanish Virtual Observatory project supported from the Spanish MICINN through grant AyA2011-24052.
R E F E R E N C E S
Abt H. A., 2008,ApJS, 174, 499 Abt H. A., 2015,PASP, 127, 1218
Abt H. A., Tan H., Zhou H., 1997,ApJ, 487, 365 Astropy Collaboration et al., 2013,A&A, 558, A33
Ballering N. P., Rieke G. H., Su K. Y. L., Montiel E., 2013,ApJ, 775, 55 Baraffe I., Chabrier G., Allard F., Hauschildt P. H., 1998, A&A, 337, 403 Baruteau C., Masset F., 2008,ApJ, 678, 483
Bayo A., Rodrigo C., Barrado Y Navascu´es D., Solano E., Guti´errez R., Morales-Calder´on M., Allard F., 2008,A&A, 492, 277
Bernstein R., Shectman S. A., Gunnels S. M., Mochnacki S., Athey A. E., 2003, in Iye M., Moorwood A. F. M., eds, Proc. SPIE, Vol. 4841, Instrument Design and Performance for Optical/Infrared Ground-based Telescopes. SPIE, Bellingham, p. 1694
Beust H., Madjar A. V., Lagrange-Henri A. M., Ferlet R., 1991, A&A, 241, 488
Beust H., Karmann C., Lagrange A.-M., 2001,A&A, 366, 945 Beuzit J. L. et al., 2019, preprint (arXiv:1902.04080) Boyajian T. S. et al., 2016,MNRAS, 457, 3988 Breger M. et al., 1993, A&A, 271, 482
MNRAS490,5218–5227 (2019)
Castelli F., Gratton R. G., Kurucz R. L., 1997, A&A, 318, 841
Claudi R. U. et al., 2008, in Proc. SPIE Conf. Ser. Vol. 7014, Ground-based and Airborne Instrumentation for Astronomy II. SPIE, Bellingham, p. 70143E
Cuello N., Montesinos M., Stammler S. M., Louvet F., Cuadra J., 2019, A&A, 622, A43
David T. J., Hillenbrand L. A., 2015,ApJ, 804, 146 De Rosa R. J. et al., 2014, MNRAS, 437, 1216
Dohlen K. et al., 2008, in Proc. SPIE Conf. Ser. Vol. 7014, Ground-based and Airborne Instrumentation for Astronomy II, SPIE, Bellingham. p. 70143L
Feroz F., Hobson M. P., Bridges M., 2009,MNRAS, 398, 1601 Foreman-Mackey D., 2016,J. Open Source Softw., 1, 24
Foreman-Mackey D., Hogg D. W., Lang D., Goodman J., 2013,PASP, 125, 306
Gagn´e J. et al., 2018,ApJ, 856, 23
Gaia Collaboration, Brown A. G. A., Vallenari, A., 2018, A&A, 616, A1 Gomez Gonzalez C. A. et al., 2017,AJ, 154, 7
Gontcharov G. A., 2006,Astron. Lett., 32, 759 Gontcharov G. A., 2012,Astron. Lett., 38, 694
Gray R. O., Corbally J. C., 2009, Stellar Spectral Classification. Princeton Univ. Press, Princeton, NJ
Gvaramadze V. V., Kniazev A. Y., Maryeva O. V., Berdnikov L. N., 2018, MNRAS, 474, 1412
Hunter I., Smoker J. V., Keenan F. P., Ledoux C., Jehin E., Cabanac R., Melo C., Bagnulo S., 2006,MNRAS, 367, 1478
Husser T. O., Wende-von Berg S., Dreizler S., Homeier D., Reiners A., Barman T., Hauschildt P. H., 2013,A&A, 553, A6
Iglesias D. et al., 2018,MNRAS, 480, 488
Jenkins J. M., 2017, Technical Report, Kepler Data Processing Handbook: Overview of the Science Operations Center. NASA Ames Research Center, Mountain View, CA
Jenkins J. M. et al., 2010,ApJ, 713, L87
Jenkins J. M. et al., 2016, in Proc. SPIE Conf. Ser. Vol. 9913, Software and Cyberinfrastructure for Astronomy IV, SPIE, Bellingham. p. 99133E Kaufer A., Stahl O., Tubbesing S., Nørregaard P., Avila G., Francois P.,
Pasquini L., Pizzella A., 1999, The Messenger, 95, 8 Kausch W. et al., 2015,A&A, 576, A78
Kelson D. D., 2003,PASP, 115, 688
Kelson D. D., Illingworth G. D., van Dokkum P. G., Franx M., 2000,ApJ, 531, 184
Kiefer F., Lecavelier des Etangs A., Boissier J., Vidal-Madjar A., Beust H., Lagrange A.-M., H´ebrard G., Ferlet R., 2014a, Nature, 514, 462 Kiefer F., Lecavelier des Etangs A., Augereau J.-C., Vidal-Madjar A.,
Lagrange A.-M., Beust H., 2014b, A&A, 561, L10 Kochanek C. S. et al., 2017,PASP, 129, 104502 K´osp´al ´A. et al., 2013,ApJ, 776, 77
Kourniotis M., Kraus M., Arias M. L., Cidale L., Torres A. F., 2018, MNRAS, 480, 3706
Kral Q., Matr`a L., Wyatt M. C., Kennedy G. M., 2017,MNRAS, 469, 521
Lenz P., Breger M., 2005,Commun. Asteroseismol., 146, 53 Lin J. W., Chiang E., 2019,ApJ, 883, 68,
Lyra W., Johansen A., Klahr H., Piskunov N., 2009,A&A, 493, 1125 Marois C., Lafreni`ere D., Doyon R., Macintosh B., Nadeau D., 2006,ApJ,
641, 556
Mayor M. et al., 2003, The Messenger, 114, 20 McEvoy C. M. et al., 2015,MNRAS, 451, 1396
Milli J., Mouillet D., Lagrange A. M., Boccaletti A., Mawet D., Chauvin G., Bonnefoy M., 2012,A&A, 545, A111
Montesinos M., Cuadra J., Perez S., Baruteau C., Casassus S., 2015,ApJ, 806, 253
Mo´or A. et al., 2015,MNRAS, 447, 577
Mordasini C., Alibert Y., Klahr H., Henning T., 2012,A&A, 547, A111 Morton D. C., 1991,ApJS, 77, 119
Pavlov A., M¨oller-Nilsson O., Feldt M., Henning T., Beuzit J.-L., Mouillet D., 2008, in Proc. SPIE Conf. Ser. Vol. 7019, Advanced Software and Control for Astronomy II. SPIE, Bellingham, p. 701939
Pecaut M. J., Mamajek E. E., 2013,ApJS, 208, 9 Rebollido I. et al., 2018,A&A, 614, A3
Ricker G. R.et al., 2015, Journal of Astronomical Telescopes, Instruments and Systems, 1, 014003
Savage B. D., Sembach K. R., 1991,ApJ, 379, 245 Shakura N. I., Sunyaev R. A., 1973, A&A, 24, 337 Shappee B. J. et al., 2014,ApJ, 788, 48
Siess L., Dufour E., Forestini M., 2000, A&A, 358, 593 Siluk R. S., Silk J., 1974,ApJ, 192, 51
Slettebak A., 1986,PASP, 98, 867 Smette A. et al., 2015,A&A, 576, A77 Smith J. C. et al., 2012,PASP, 124, 1000
Smith K. T., Fossey S. J., Cordiner M. A., Sarre P. J., Smith A. M., Bell T. A., Viti S., 2013,MNRAS, 429, 939
Stumpe M. C. et al., 2012,PASP, 124, 985
Talens G. J. J., Spronck J. F. P., Lesage A. L., Otten G. P. P. L., Stuik R., Pollacco D., Snellen I. A. G., 2017,A&A, 601, A11
Talens G. J. J. et al., 2018,A&A, 619, A154
Torres C. A. O., Quast G. R., da Silva L., de La R. R., Melo C. H. F., Sterzik M., 2006, A&A, 460, 695, . p.
Vallerga J. V., Vedder P. W., Craig N., Welsh B. Y., 1993,ApJ, 411, 729 Vigan A., Moutou C., Langlois M., Allard F., Boccaletti A., Carbillet M.,
Mouillet D., Smith I., 2010,MNRAS, 407, 71 Welsh B. Y., Montgomery S. L., 2018,MNRAS, 474, 1515 Welty D. E., Morton D. C., Hobbs L. M., 1996,ApJS, 106, 533
Wyatt M. C., van Lieshout R., Kennedy G. M., Boyajian T. S., 2018, MNRAS, 473, 5286
Zieba S., Zwintz K., Kenworthy M. A. Kennedy G. M., 2019,A&A, 625, L13
Zuckerman B., Song I., 2012,ApJ, 758, 77
This paper has been typeset from a TEX/LATEX file prepared by the author.