I
Acknowledgements
This master thesis marks the end of my studies in Business Administration and was performed internally at the University of Twente. During the past sixth months I have worked on this master thesis with great passion. On one hand it is a relief to finish such a big project, while on the other hand it is difficult to let go. However, this thesis does not mark the end of my academic studies. After graduating in Business Administration I will continue my masters in Communication studies.
I would like to thank my supervisors Ton Spil and Robin Effing for always providing relevant feedback and for the useful and interesting discussions we had on the subject. It is very motivating to see your supervisors be genuinely interested and invested in your research. I would also like to thank them for giving me the freedom in choosing the subject and dimensions of this research. Throughout this research I got drawn into the world of data science. I followed many online courses in order to supplement me with the knowledge needed to analyze big data like the data used in this thesis. I really want to thank my supervisors for supporting me in trying something new. Currently, I am still following courses in data science and machine learning and cannot wait to also implement this new knowledge in my graduation thesis for Communication studies.
Additionally I would like to thank my brother for implementing the database in which the tweets were originally stored. Finally, I would like to thank my family, friends and flat mates for always supporting me during these busy and sometimes difficult times. This graduation project taught me many things and introduced me to data science and machine learning. Without this master thesis my future career would look very different. Therefore, I will be forever grateful to the people who supported me along the way.
I hope you enjoy reading this master thesis.
II
Abstract
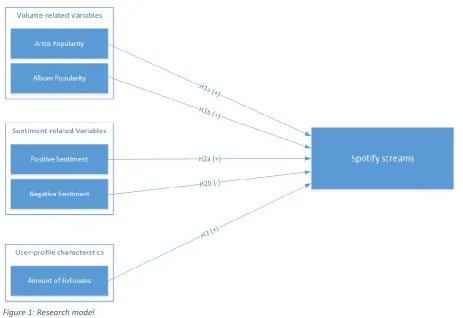
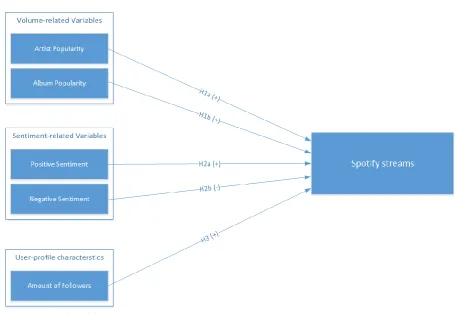
[image:3.595.68.532.288.606.2]Kalampokis, Tambouris and Tarabanis (2013) categorized social media predictor variables in three categories: volume-related variables, sentiment-related variables and profile characteristics of online users. Previous research has shown the predictive power of Twitter when using a single type of predictor variable. However, few studies have focused on the combination of multiple types of social media predictor variables. Moreover, research on the predictive power of social media in music often solely focused on volume-related variables and focused on blogs and Myspace. Nonetheless, Twitter plays an increasingly important role in the music industry and in academic research. This study tests the predictive power of all three categories of social media predictor variables on Spotify streams of newly released music albums. Based on an extensive literature review the research model in figure 1 has been designed.
Figure 1: Research model
Over 2.4 million tweets were collected over a period of five weeks using keywords related to the artist and the album title. Multiple regression analyses were performed in order to test the
III
Hypotheses Results
H1a: The volume of tweets for each album is positively associated with Spotify streams.
Accepted H1b: The volume of tweets for each artist is positively associated with Spotify
streams.
Accepted H2a: Positive sentiment in tweets is positively associated with Spotify streams. Rejected H2b: Negative sentiment in tweets is negatively associated with Spotify streams. Rejected H3: Amount of followers is positively associated with Spotify streams. Rejected Table 1: Results on hypotheses
Results show the importance of volume-related variables in predicting Spotify streams. The sentiment-related variables and profile characteristics of online users were found to have no significant predictive power on Spotify streams. Results on the hypotheses formulated according to the research model can be found in table 1. The volume of tweets related to the album performed better at predicting Spotify streams than the volume of tweets related to the artist. A daily time series of the volume of tweets containing the album title was able to predict first week streams with high accuracy. Exploratory analysis suggests that the relationship between volume-related variables and streams could be influenced by the age of the musician. For younger musicians the Twitter predictor variables were able to significantly predict Spotify streams, while for older musicians the overall regression model was not significant. Furthermore, additional analyses suggest that the type of performer (male vs. female vs. band) could also influence the predictive power of Twitter on Spotify streams.
IV
Table of Contents
Acknowledgements ... I Abstract ... II
1. Introduction ... 1
1.1 Twitter ... 1
1.2 Music Industry ... 2
1.3 Research Questions ... 3
2. Literature Search ... 5
3. Literature Review ... 8
3.1 Volume-related Variables ... 9
3.2 Sentiment-related Variables ... 13
3.3 Profile Characteristics of Online Users ... 16
3.4 Additional Variables ... 17
3.4.1 Artist Reputation ... 17
3.4.2 Record Label ... 17
3.4.3 Traditional Media ... 17
3.5 Research Model ... 18
4. Methodology ... 19
4.1 Data Collection ... 19
4.1.1 Twitter ... 19
4.1.2 Spotify ... 20
4.1.3 Additional Data ... 20
4.2 Data Analysis ... 21
4.2.1 Preprocessing ... 21
4.2.2 Sentiment Analysis ... 21
4.3 Model Design ... 22
5. Results ... 25
5.1 Dataset Characteristics ... 25
5.2 Model Testing ... 29
5.2.1 Multiple Linear Regression for Same Week ... 29
5.2.2 Multipe Linear Regression for Prediction ... 31
5.3 Additional Analyses ... 33
5.3.1 Further Sentiment Analysis ... 33
5.3.2 Time Series Analysis ... 34
5.3.3 Demographic Influences ... 36
V
6. Analysis ... 38
7. Conclusion ... 42
7.1 Limitations ... 44
7.2 Future Research... 44
8. References ... 46
8.1 Literature Review ... 46
8.2 References oustide of Literature Review ... 49
9. Appendices ... 51
Appendix A ... 51
Appendix B ... 52
Appendix C... 53
Appendix D ... 57
Appendix E ... 59
Appendix F ... 61
Appendix G ... 62
1
1. Introduction
From the top five most followed accounts on Twitter, four are musicians and the other is Barack Obama. The first Twitter account to exceed five million followers was a musician’s. Furthermore, some of the highest rates of tweets per second are observed during televised music events. These cases all stress the importance of Twitter in the music industry, which is rapidly changing. In 2015 streaming became the biggest source of revenues (Friedlander, 2016). However, few academic studies have explored the relationship between Twitter and music revenues. On the other hand, Twitter has been used to predict box-office revenues (Asur & Huberman, 2010; Rui, Liu & Whinston, 2013), political elections (Ceron, Curini & Lacos, 2015) and the spread of diseases (Kim, Seok, Oh, Lee & Kim, 2013). Kalampokis, Tambouris and Tarabanis (2013) defined three types of social media predictor variables: volume-related variables, sentiment-related variables and profile characteristics of online users. Despite their framework many studies only focus on one social media predictor variable which often is volume-related. In this study all three social media predictor variables are used and the interaction between them is explored. Using social media predictor variables derived from Twitter this study tries to predict the amount of Spotify streams received by newly released albums.
Some early studies in the field of social media prediction in the music industry have explored
relations between blog buzz and album sales (Dhar & Chang, 2009; Dewan & Ramaprasad, 2014), and Myspace broadcasting and music sales (Chen, De & Hu, 2015). Kim, Suh and Lee (2014) were the first to explore the option of using Twitter to predict music sales. However, Kim et al. (2014) only included volume-related variables in their analysis. This study expands upon that study by testing how
effective the use of Twitter is in predicting Spotify streams by including multiple social media predictor variables. The rest of the introduction is organized as follows. First, Twitter and its use in academic research is discussed. Second, recent developments in the music industry are explored. Third, the central research question and sub-questions are formulated.
1.1 Twitter
The type of social media that this study focuses on is Twitter. Twitter is a popular social network with 313 million monthly active users (Twitter, 2016). Although the amount of active users on Twitter seems to slightly reach a plateau, it still has its highest amount of monthly active users ever. Twitter is the fourth most popular social networking site worldwide after Facebook, YouTube and Instagram (Kallas, 2016). Another reason that makes Twitter so attractive to social media research is its
2 been shown multiple times in previous research. For example, Asur and Huberman (2010) were able to accurately predict the box-office revenues of newly released movies using Twitter. Ceron et al. (2015) found that using the sentiment expressed in Twitter messages clearly predicted Obama to be the winner of the 2012 US presidential election, even though traditional polling considered the race too close to call. A high amount of tweets being public and the availability of the streaming API make Twitter a popular choice for academic research (Burnap et al., 2014; Ceron et al., 2014).
1.2 Music Industry
The music industry is a multibillion-dollar industry which has been experiencing an on-going decline since 1995 as a result of multiple difficulties including digitalization and piracy. In 2014 global revenues dropped below US$15 billion for the first time in decades, as revenues decreased by 0.4% compared to 2013 (IFPI, 2015). The International Federation of the Phonographic Industry (IFPI) recently reported that 2015 marks a change. For the first time in two decades global recorded music industry revenues saw a significant growth with 3.2% compared to 2014 (IFPI, 2016). This
development led to positive responses within the industry. Besides, 2015 was the first year where streaming surpassed digital downloads as the biggest component of revenues in the United States, the largest music industry in the world (Friedlander, 2016). Streaming is rapidly growing and is already the main source of revenue in multiple markets. The disruption streaming causes is bigger than digital downloading did, because streaming changes the way consumers have access to music. PASM (2015) predicts that streaming will be able to double the value of the music business by 2020. In July of 2016 Nielsen published their mid-year report analyzing music data from the first half of 2016. This report contains the most updated information on the current state of the music industry in the United States. For the first time, audio streaming (54%) surpassed video streaming (46%) as the biggest streaming format (Nielsen, 2016). Despite the constant popularity of YouTube and Vevo, streaming services like Spotify and Apple Music contributed to audio streams increasing by 97.4% compared to the same half-year period last year. In comparison, video streaming only grew by 28.6%. These are not the only statistics that point to the growing importance of streaming in the music industry. Despite the resurgence of vinyl sales, overall album sales were down 13.6% with digital album sales dropping 18.4%. Digital track sales were hit even harder, decreasing by 23.9% (Nielsen, 2016). Forecasters now predict that if similar trends continue, Apple might have to turn off the iTunes store in 2020. Mark Mulligan, analysist at Midia wrote: “By 2020 download business would be tracking to be 10 times smaller than streaming revenue but, crucially, streaming revenue would nearly have reached the 2012 iTunes Store download revenue peak.” (Music Industry Blog, 2016). Next to Nielsen, market monitors report similar results (BuzzAngle, 2016). All these statistics point to the indisputable growth of streaming and the downfall of digital downloads. Spotify is the biggest service provider with over 40 million paid subscribers and more than 100 million active users. Since March, Spotify increased its paid subscriber base with 10 million. In comparison, Apple Music has 17 million subscribers (Schneider, 2016). Therefore, this research focuses on Spotify.
Besides streaming, social media has also had an impact on the music industry. Social media has made it easier than ever for artists to reach people, communicate with them in a meaningful way, and build a fan base. In the current music climate, social media is important for young artists (Leenders, Farrell, Zwaan & Ter Bogt, 2015). Currently, music consumption is at an all-time high (IFPI, 2016). The
3 have access to social media. This can actually make it much harder for artists to get noticed from the crowd. Social media is the place where most fans go to follow their favorite artists. New releases like singles, albums and music videos are often launched on social media. This presents record labels with an opportunity to track the buzz and sentiment regarding the release (Franklin, 2013). Social media can also be used to obtain user data, find new artist and predict future hits (Shubber, 2014). For example, Asur and Huberman (2010) used social media data to predict box-office revenues around the time of release. Using data from Twitter, their predictions were more accurate than those of the Hollywood Stock Exchange, which is seen as the golden standard in the industry.
This study will focus on albums, because their release dates are often known in advance and their releases are big events and focal points in the social media campaign of artists. Singles generally receive less attention. Since 2015 albums have a global release day, on Fridays, which makes the buzz surrounding the album release easier to track. Albums can also be compared to movies, which have often been the focus of research into the predictive power of Twitter. Both are released following a comprehensive release strategy and both are part of the entertainment industry.
1.3 Research Questions
Previous research has discussed the predictive power of social media in general and has taken steps into testing this phenomenon in the music industry. Despite Twitter being a popular type of social media in academic research, only one study (Kim et al., 2014) explored the predictive power of Twitter in the music industry. Additionally, all studies researching the link between social media and music success have focused on sales data. Recent developments in the music industry have shifted the main attention to streaming. However, academic research has not yet caught up with this
development. To the best of our knowledge, this is the first study that uses social media data in order to predict and explain the amount of streams received by music albums. Because Spotify is the most important provider of audio streaming at this point, the focus of this study is on Spotify streams. Based on the introduction the following research goal and central research question have been formulated.
Research goal: To capture the relationship between Twitter predictor variables and Spotify streams received by newly released albums.
Central research question: What is the relationship between volume-related, sentiment-related and profile-related Twitter variables and the volume of Spotify streams of newly released music albums?
The following sub-questions have been formulated based on the central research question: - What Twitter predictor variables has previous literature identified as having significant
predictive power on predicting both real-world and online outcomes?
- To what extent has the predictive power of social media in the music industry been demonstrated before?
5
2. Literature Search
In order to gain an understanding of the predictive power of Twitter a systematic literature review was performed according to the method described by Wolfswinkel, Furtmueller and Wilderom (2013). The literature review also follows the principles of Webster and Watson (2002). The main idea behind these approaches is that the method and approach of the literature review is
transparent and described in detail. A computer search was conducted at the end of July 2016 on the international research databases of Scopus and Web of Science. This search was extended in
September 2016 to include a new set of keywords in the search. The final sample of papers has been constructed through a comparison of abstracts, removing duplicates, number of citations, forward and backward citations and finally reading the full texts. This process is described in more detail below.
The starting point of this literature review is a previous literature study. Kalampokis et al. (2013) wrote a literature review on the predictive power of social media. Their literature review provided a comprehensive review of the literature in this field. However, it could use an update in 2016. Kalampokis et al. (2013) performed the search in 2012 using the search term ‘(predict OR forecast) AND social media’ on Google Scholar with the following inclusion and exclusion criteria:
Excluded qualitative or purely theoretical articles. Included only studies aiming at making predictions.
Included only studies that attempt to predict real world outcomes. For example, studies that focused on online features such as tie strength, volume of comments on online news or movie rating on IMDB were excluded.
While the literature review by Kalampokis et al. (2013) is a great starting point there are certain things that the literature review in this paper would like to add:
The published literature on social media and predicting after 2012. The literature search by Kalampokis et al. (2013) was performed in 2012. Since their study there has not been another comprehensive literature review on this subject. This might be caused by how many papers on the subject are published by computer scientists. Most articles on the topics of computer science are presented at conferences and therefore only include a short overview of past research with more focus on the methods and results. This study will provide a comprehensive overview of the literature published between 2013 and the first half of 2016. Literature that focuses on online outcomes. The study by Kalampokis et al. (2013) excluded
articles that attempted to predict online outcomes. This thesis focuses on an online
outcome, online music streaming. These excluded articles from Kalampokis et al. (2013) are included in this review, because they might describe differences between offline and online outcomes. Therefore it is important to include these studies for the literature review in this paper.
6 Twitter was planned to be the type of social media used in the empirical part of the research.
Accordingly, it was decided to expand to literature search to focus specifically on Twitter. Extra searches with these new keywords were conducted in September 2016.
The goal of this literature review is to gain an understanding of what types of social media, methods, variables and results have been recorded in previous research on the predictive power of social media. The sub-goals for each part of the review are as follows:
- Providing an update and extension to the work of Kalampokis et al. (2013) with a specific focus on the use of Twitter for predicting.
- Gathering knowledge on the specifics related to ‘online outcomes’ that were omitted in Kalampokis et al. (2013).
- Capturing the previous ways that predictions using social media have been studied in the music industry.
A basic search on Scopus into social media was performed. This search showed that academic research into social media, did not start until 2006. Therefore, only papers published in 2006 or later are included in the literature review. Computer searches using keywords were performed on the online databases of Scopus and Web of Science. These are multidisciplinary databases that can cover a broad subject like social media. Table 1 displays the keywords used in the search and provides detailed information on how many papers were found and selected in each phase. The set of keywords can be split up into three groups, where the first group focuses on expanding the work of Kalampokis et al. (2013), the second group narrows its focus to the music industry and the third group focuses on the use of Twitter for predictions. Because of the big amount of results for certain search terms a restriction was placed of having a minimum number of ten references to be included. This means that papers found using these search terms were only included in the review if they had at least ten references on the databases they were found at. This criterion allows for the inclusion of only highly relevant papers in the review. The use of broad search terms allows us to review all the different aspects of the social media spectrum. Further narrowing down these terms could lead to the exclusion of key papers. On the other side, the keywords that specifically focused on the predictive power of social media in the music industry resulted in few papers. Therefore, no minimum requirement of citations was set for these papers. During the extra search in September 2016 it was also decided to include recent papers since these could include state-of-the-art knowledge related to Twitter. For these papers published in 2016 the minimum requirement of 10 citations was also dropped. A detailed description regarding the combination of search terms used can be found in Appendix A.
The selection process was organized as follows. Firstly, articles were selected based on their title and abstract. Secondly, duplicates were removed. Finally, full texts were read and a concept matrix was updated after reading each paper (Webster & Watson, 2002). This concept matrix can be found in Appendix B. Forward and backward citations were also performed during this stage. Afterwards, papers were analyzed using the grounded theory approach which is responsible for how the
7
Search Terms Years Ref.
Min Scopus Results Scopus Selected WOS Results WOS Selected Total Selected Actual Selected “social media” AND
(forecast OR predict)
2013-2016 ≥10 40 9 28 6 15 12
“Social media” AND “monitoring”
2013-2016 ≥10 64 15 19 7 22 6
“Social media” AND (forecast OR predict)
2006-2012 ≥10 42 9 27 4 13 7
“Social media” AND “music”
2006-2016 ≥10 31 8 7 3 11 4
“Social media” AND “music” AND (forecast OR
predict)
2006-2016 - 7 1 9 1 2
11 “Social media” AND (music
sales OR album sales)
2006-2016 - 9 9 7 5 12
“Twitter” AND (forecast OR predict)
2013-2016 ≥10 36 7 18 1 8
8 “Twitter” AND
“monitoring”
2013-2016 ≥10 34 4 14 0 4
“Twitter” AND (forecast OR predict)
2016 - 95 7 59 5 12
“Twitter” AND “monitoring”
2016 - 53 2 24 0 2
Total selected after reading abstracts
101 -
After removing duplicates 83 -
Final sample after reading full texts &
forward/backward citations
[image:13.595.68.564.72.482.2]48 48
Table 1: Literature review overview
Abbreviations: Ref. Min. = Reference minimum; amount of references needed in order to be selected. WOS = Web of Science.
Authors Year Journal/Proceedings
Asur & Huberman 2010 International Conference on Web Intelligence and Intelligent Agent Technology
Bischoff et al. 2009 International Conference on Advanced Data Mining and Applications Ceron et al. 2014 New Media & Society
Chen et al. 2015 Information Systems Research
Dewan & Ramaprasad 2009 Pacific Asia Conference on Information Systems Dewan & Ramaprasad 2012 Information Systems Research
Dewan & Ramaprasad 2014 Management Information Systems (MIS) Quarterly Dhar & Chang 2009 Journal of Interactive Marketing
Kim et al. 2014 Proceedings of the first international workshop on Social media retrieval and analysis
Rui et al. 2013 Decision Support Systems
Sharma et al. 2012 Journal of Information, Information Technology, and Organizations Saboo et al. 2015 International Journal of Research in Marketing
[image:13.595.67.528.561.762.2]8
3. Literature Review
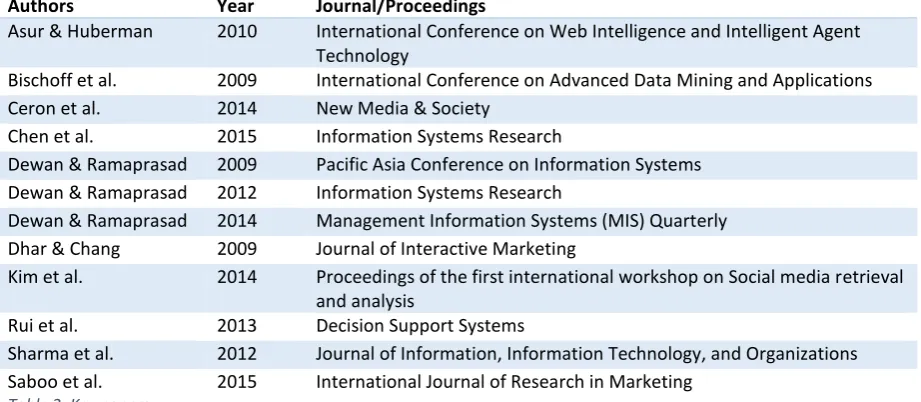
The literature review is split-up based on the type of social media predictor variable studied. Table 3 features an overview of the academic literature and what type of social media predictor variables are included within these studies. Volume-related variables are the most studied type of social media predictor variable for the Twitter studies, as well as for the music specific studies. For related variables table 3 shows that only two studies focus on social media in music using sentiment-related variables. Research into user-profile characteristics is relatively scarce in both cases.
This research focuses on both Twitter and the music context. In this literature review one paper was found that also focused on the use of Twitter to predict a music-specific phenomenon. Kim et al. (2014) researched whether it was possible to predict album sales using volume-related Twitter variables. This paper is further explored in chapter 3.1. Because there is only one paper that includes both Twitter and music it is important that in the literature review both the predictive power of Twitter and the predictive power of other social media in music are represented. Therefore, for each type of social media predictor variable the findings from the Twitter prediction studies are discussed first and then we zoom in on studies that applied social media prediction in the music industry. Research into sentiment-related variables and user profile characteristics is relatively scarce in the music context. It is therefore especially important to explore how these variables were studied in different contexts. The literature review is organized as follows. First, volume-related variables are discussed. Second, sentiment-related variables and sentiment analysis is elaborated upon. Third, user-profile characteristics of online users are discussed. Fourth, additional variables found in the literature are presented. Finally, the hypotheses and research model are formulated and designed.
Predictive Power of Twitter
Predictive Power of Social Media in Music
Volume-related (3.1)
Asur & Huberman (2010), Burnap et al. (2014), Caldarelli et al. (2014), Ceron et al. (2014), de Choudhury et al. (2013), Denecke et al. (2013), Hanson et al. (2013), Hong et al. (2011), Jashinsky et al. (2014), Jungherr (2013), Kim et al. (2013), Lipizzi et al. (2016), Liu et al. (2016), Oghina et al. (2012), Rui et al. (2013), Schumaker et al. (2016), Suh et al. (2010), Young et al. (2014), Zhu et al. (2011)
Total = 19
Bischoff et al. (2009), Chen et al. (2015), Dewan & Ramaprasad (2012). Dewan & Ramaprasad (2014). Dewan & Ramaprasad (2009), Dhar & Chang (2009), Kim et al. (2014), Maecker et al. (2013), Salganik et al. (2006), Sharma et al. (2012), Saboo et al. (2015)
Total = 11
Sentiment-related (3.2)
Asur & Huberman (2010), Burnap et al. (2014), Burnap et al. (2016), Ceron et al. (2014), Ceron et al. (2015), Jungherr (2013), Li et al. (2016), Lipizzi et al. (2016), Liu et al. (2016), Oghina et al. (2012), Rui et al. (2013), White (2016)
Total = 12
Dewan & Ramaprasad (2012), Dhar & Chang (2009),
Total = 2
User-profile characteristics (3.3)
Burnap et al. (2014), de Choudhury et al. (2013), Rui et al. (2013), Zhu et al. (2011), Suh et al. (2010)
Total = 5
Bischoff et al. (2009), Dewan & Ramaprasad (2012), Dhar & Chang (2009), Saboo et al. (2015)
Total = 4
9
3.1 Volume-related Variables
Volume-related variables are the main type of variable used in social media prediction research. For example, Luo & Zhang (2013) found that the volume of consumer reviews from an electronic product review website had a significant positive effect on firm value. Jin, Gallagher, Cao, Luo and Han (2010) showed that Flickr provided hints that Obama would win the presidential election in 2008. Next to the US election, Flickr also showed the geographical distribution of iPod and iPhone sales and was able to predict quarterly sales with relatively low error (Jin et al., 2010). Also, Won et al. (2013) built a prediction model that tried to predict the national number of suicides in South Korea using counts of blogs that mentioned words related to suicide or dysphoria. These previous studies used various forms of social media. However, many studies that research the predictive power of social media use Twitter. The research in this literature review that used volume-related variables derived from Twitter can be split-up in three categories: health, politics and movies. In this section the main conclusions from these contexts will be discussed. For a detailed overview of the findings of literature in health, politics and movies see appendix C. After discussing the use of volume-related variables from Twitter the effect of volume-related variables on predicting music outcomes are discussed.
In the context of health the main focus of many papers is not strictly on predicting, but rather on monitoring. A common practice is the gathering of Twitter data by using health related keywords and then matching the volume of tweets to official disease reports per area. In these cases, it is
important that tweets are geolocated or can be traced to a certain area. Hanson et al. (2013) monitored Adderall use among college students while Jashinsky et al. (2014) found strong
correlations between high risk tweets and actual suicide data per US state. Another study found a significant relationship between the volume of tweets containing HIV risk behavior and actual HIV cases in the Unites States (Young, Rivers & Lewis, 2014). Kim et al. (2013) used linear regression to build a model with good predictive power on the spread of influenza by using around thirty
influenza-related keywords. While the use of volume-related metrics has received good results in a health context, there are some limitations related to data availability that pop-up in almost every health-related study. The low amount of geotagged tweets (Hanson et al., 2013), outdated regional disease information (Young et al., 2014) and shame possibly restricting Twitter users are often mentioned (Stoové & Pedrana, 2014).
10 These studies already show the importance of context in social media prediction. The third and final context found in most Twitter prediction studies is the movie industry. From health, politics and movies, this is the context that shows the most similarities to the context in which this master thesis is performed; the music industry. Studies in health and politics mainly focused on one type of social media predictor variable. Research that focuses on social media prediction in a movie context also focuses on combining multiple types of social media predictor variables. One of the studies that initiated the research trend into the predictive power of social media was a study related to the movie industry. Asur and Huberman (2010) used the volume and sentiment of tweets to predict box-office scores with a higher accuracy than the Hollywood Stock Exchange (HSE). Their goal is to not monitor all movies mentioned on Twitter, but to predict box-office scores in the opening weekends of newly released movies. Over 2.8 million tweets for 24 movies were collected over a period of three months. By only using the tweet-rate in a linear regression model the authors were able to significantly predict box-office scores (R2 = 0.80). Next, the authors constructed a time series from seven days before the release of a movie from the tweet-rates and also include an additional
11 Similar to the Twitter prediction studies, volume-related variables are the most popular type of social media predictor variable used when applying social media prediction to the music industry. These volume-related variables can range from the amount of blog posts, number of tweets, number of Myspace comment to the number of reviews and more. The dependent variable is often related to music success like song sales or album sales. In order to fully understand the relationship between social media and music, we first take a look at social influence in a music context. Salganik, Dodds and Watts (2006) created an artificial music market to tests the effect of social influence on music downloads. Participants were shown a list of unknown bands. They then had the possibility to listen to tracks, rate them on a 1-5 scale and download the songs. The independent condition gave no extra information, while the social influence condition showed how many times each song was
downloaded by previous participants. The social influence condition also consisted of eight different virtual worlds that developed separately from each other. The results suggest that social influence increases the inequality of outcomes, which results in popular songs becoming more popular and less popular songs becoming even less popular. Maecker, Grabenströer, Clement and Heitmann (2013) re-created the study by Salganik et al. (2006) and found similar results for music, but also for movies and fashion products. The authors also find that the popularity of products is related to social information for both positive and negative types of information. Social information regarding the purchases or popularity of music is often found on social media. Therefore, when social media sales ranks become available companies can expect a shift in market shares (Maecker et al., 2013). The first set of researchers that studied the predictive power of social media in music focused on the amount of blog posts, also defined as ‘blog buzz’. Dewan and Ramaprasad (2009) research the simultaneous relationship between blog buzz and album sales. Using a time-series cross-section dataset with the weekly blog buzz and weekly album sales of 2694 albums the authors find results that indicate strong bi-directional causality. This relationship seems to be stronger for albums that were recently released. Other variables like type of record label, artist reputation and the number of Amazon reviews were also included in the analysis. These variables will be discussed in their
12 sampling drives music sales. This suggestion is later debunked by Dewan and Ramaprasad (2014) who conclude that sampling is the reason that a higher amount of blog posts leads to lower song sales. Sharma et al. (2012) and Saboo, Kumar and Ramani (2014) study music sampling from social media websites. The number of times an album was sampled on Myspace predicted album sales in four out of eleven weeks (Sharma et al., 2012). Saboo et al. (2014) study social sampling over various social media websites like Facebook, Twitter, Myspace, YouTube and Last.fm and conclude that social sampling has a significant negative influence on music sales. Therefore, it is important to keep the effects of sampling in mind when researching social media types that offer the opportunity to sample music, like blogs for example.
Research on volume-related variables later switched to other social media sites like Myspace. In a study by Sharma et al. (2012) the number of posts on Myspace was a good predictor of album sales, because it was significantly related to album sales in seven out of eleven weeks. However, this number dropped significantly when latency effects were included. Chen et al. (2015) found that there is a significant relationship between the amounts of posts made by an artist on Myspace on music sales. Nonetheless, this effect is mainly caused by bulletins and not by friend updates. Bulletins are messages posted by the artist themselves and are therefore seen as more personal than friend updates. This distinction is specific to Myspace and therefore difficult to apply to other types of social media. The authors also find that around the time of new music releases the effect of personal messages is about six times larger than otherwise. Myspace was once the most popular social media for artists to use, but it has experienced a serious decline in recent years. Therefore, it is important to also research other types of social media (Chen et al., 2015). As described by Saboo et al. (2014) comments on social media have a significantly positive influence on music sales. The interesting aspect is that this effect keeps increasing as the amount of comments increases. It is important for managers to encourage participation on social media as “social comments are like testimonies, create a positive buzz about the brand and bring new consumers into fold” (Saboo et al., 2014, p. 9). Sharma et al. (2012) found no relationship between YouTube comments and album sales. YouTube views and the number of uploaded videos seemed to have a small predictive effect on album sales. Bischoff, Firan, Georgescu, Nejdl and Paiu (2009) used social media data gathered from Last.fm and build an algorithm for hit prediction. Their algorithm improved performance by 28% on a similar algorithm that did not include social media data.
13 suggest that linear models may not fit the distribution of data. When using the support vector
machine the model with just Twitter information achieves an R2 = .57. The combined model of Twitter information and the amount of weeks an album has been on the Billboard charts improved the performance to 0.75. An algorithm for hit prediction was constructed and used to predict hits across various ranges. The algorithm, using Twitter information and weeks on the chart, was able to predict whether a song would be in the 1-10 range on the Billboard chart with 92% accuracy. The authors conclude that despite the combined model having the highest accuracy “music listening behavior available in Twitter can generate an outstanding predictive model” (Kim et al., 2014, p. 55). The final volume-related variable is the number of reviews. Dewan and Ramaprasad (2009, 2012) take the number of reviews on Amazon into account in their analysis. Although both variables appear to be significant predictors of album sales, the authors do not further elaborate on this. Chen et al. (2015) include the number of new Amazon reviews in their research. They find that the volume of new reviews seems to have some association with the sales rank of albums. Also, an artist’s posts are not influenced by customer reviews, but friend updates by artists seems to weakly predict the amount of new customer reviews.
3.2 Sentiment-related Variables
Jungherr (2013) and Luo and Zhang (2013) used sentiment-related variables in their approach without actually performing a sentiment analysis. Jungherr (2013) analyses the German election of 2009. Throughout this election people have been encouraged to express support or disapproval by tweeting a party name preceded by a hashtag and followed by a + or -. These mentions have been collected by the German website Wahlgetwitter and are later used by Jungherr (2013) for analysis. The overall sentiment of tweets was more negative than positive, and sentiments were a valuable addition to purely using tweet volume in predicting the election outcome. Luo and Zhang (2013) found a significant positive relationship between the average score of consumer reviews and firm value metrics.
When performing a sentiment analysis there generally are two main approaches. The first approach is lexicon-based. In this method the sentiment of a text is defined by matching words in the text to words in a pre-defined lexicon. The second approach is based in machine learning. Here, a classifier model is trained to classify texts into sentiment categories. In the next part studies using the lexicon-based approach are discussed first and studies using machine learning are discussed next.
14 Burnap et al. (2016) also used the SentiStrength tool when calculating the sentiment of tweets in trying to predict the UK 2015 general election. The authors take into account the earlier critics by Gayo-Avello (2013) for predicting political elections with social media. Mainly the authors analyse sentiment instead of volume, take into account parliamentary representation and test their prediction model on a new set of data. The authors combine volume and sentiment by counting tweets with a positive sentiment as a vote for a specific party. Their results highlight the difficulty in predicting political elections when there is a certain party that is very big in specific regions of the country. The authors suggest new methods for geolocation in future similar research. Lipizzi et al. (2016) also used the SentiStrength tool and were critical of the results they received regarding the predictive power of sentiment. When only using sentiment, it was found to be a weak predictor of box-office revenues. Liu et al. (2016) use a sentiment lexicon constructed by the Harbin Institute of Technology in China. The ratio of positive to negative tweets is used for measuring sentiment. Liu et al. (2016) find that sentiment is a good predictor of box-office revenues and it is included in their model that achieves the best performance. In an attempt to predict political elections using Twitter, White (2016) found that the mean sentiment that each Twitter user gave to each candidate was the best predictor out of the variables they tested. Sentiment was calculated using word polarity from the qdap R package, which uses a lexicon of positive and negative words. The Twitter forecast model using the mean sentiment score was able to forecast the overall Canadian election as well as
provincial results (White, 2016). Li, Zhou and Liu (2016) used a lexicon that searched for frequency of happy, sad, anger, fear, disgust and surprise words. The authors only use correlational measures and find a high correlation between the frequency of happy, sad and angry words and stock behaviour. Finally, Schumaker, Jarmoszko and Labedz (2016) used a similar tool to SentiStrength called
OpinionFinder. This tool classifies texts on two axes, positive or negative and subjective or objective. The sentiment of tweets was used to predict the outcomes of matches in the English Premier League in 2014. Results showed that positive surges of the sentiment in tweets can lead to a better
prediction of match outcomes than traditional betting odds. However, the authors also mention the high volume of tweets from opposing teams inserting negative sentiment about the other team (Schumaker et al., 2016).
15 show that the Italian leaders are generally scored as less positive on social media than in traditional polls. For some leaders the poll and social media results are very similar, while this is not the case for other leaders. The Mean Absolute Error (MAE) of the predictions seems to decrease as we get closer to the election date. For both of the French case studies, the results from the social media analysis were in line with the actual election results and with published surveys. Twitter allows for a proper analysis of day-to-day reactions from the general public. Concluding, while internet users might not always be representative of the full population, this analysis shows that there is a consistent correlation between social media results and that they are also able to forecast electoral results. Also, social media sentiment reacts to day-to-day exogenous factors (Ceron et al., 2014). In 2015, Ceron et al. (2015) used similar methods and received similar results in the 2012 US presidential election and in predicting the centre-left coalition leader in Italy. Ceron et al. (2015) again report on the ability of social media to monitor any momentum gained in a campaign. In the 2012 US
presidential election the authors report that online sentiment clearly predicted Obama to be the winner although the race was considered too close to call by traditional polling. On the other hand, Rui et al. (2013) built a Naive Bayesian classifier. This classifier was trained on a corpus of 3000 tweets in order to classify tweets as either positive, negative or neutral. Through different robustness checks the positive tweets ratio always had a significant and positive effect on box-office revenues. Similarly, the negative tweets ratio always had a negative impact on box-office revenues. Although this effect was not significant in all cases.
None of the articles related to the predictive power of social media in music performed a sentiment analysis where a set of text is classified as positive or negative. It certainly seems relevant to include the sentiment of social media content when researching its effect on sales. As shown before
16
3.3 Profile Characteristics of Online Users
From the three types of social media predictor variables identified by Kalampokis et al. (2013), profile characteristics of online users is the least popular one in academic literature. Only a small sample of the literature in this review included these type of variables. Zhang and Pennacchiotti (2013) collected demographic information like age and gender, and Facebook likes from Facebook when trying to predict eBay sales. Results show that there is a difference in the categories that men and women buy products from. Most sales in eBay categories could be predicted by the Facebook likes per user. In a study on predicting postpartum depression through Twitter, de Choudhury, Counts and Horvitz (2013) included the number of followers and followees from recent mothers. The number of followees was a better predictor than the number of followers in predicting extreme behavioural change. However, in this case this is probably caused by mothers who are faced with postpartum depression attempting to minimize the amount of people they follow. Next to the number of followers and followees, Burnap et al. (2014) also included the number of previous tweets and a variable ‘reach’. This variable was calculated by summing the number of followers of each user that retweeted a certain tweet. Only the amount of followers had a positive effect on the amount of retweets. Rui et al. (2013) also include the amount of followers in their model that tried to predict the box-office revenues of movies. Tweets from users with a following above 400 are categorized as type-2 tweets and tweets from users with a following below 400 as type-1 tweets. The dynamic panel shows that the percentage of tweets from users with a high following has a positive and significant effect on box-office scores. A robustness check for the cut-off point of 400 followers for type-2 tweets shows similar results (Rui et al., 2013).
Dhar and Chang (2009) include a variable related to the profile characteristics of online users in their model by calculating the weekly change of Myspace friends. However, this turns out to not be a significant predictor of album sales. When analysing the link between blog buzz and music sales, it could be argued that blog popularity is a profile characteristic. In this case, the user is seen as the blog who posted the blog article. Blog popularity has a significant and positive effect of music
sampling, especially for albums with a lower Amazon ranking (Dewan & Ramaprasad, 2012). Saboo et al. (2014) find that social following has a positive effect on a song’s Billboard hot 100 ranking in a decreasing way. Followers on social media have a positive effect on music success. However, as the follower count increases, its effect decreases.
17
3.4 Additional Variables
Additional variables are often exclusive to the industry or context the predictive study is applied in. For example, Won et al. (2013) collected economical and meteorological measures as well as celebrity suicide data when predicting national suicides. The number of theaters a movie was
released in has been included in various studies that used Twitter data to predict box-office revenues of movies (Asur & Huberman, 2010; Liu et al., 2016). This section discusses variables outside of the social media predictor variables that were included in studies that explored the predictive power of social media in music. These variables are specific to the music industry and could provide additional explanations when exploring the predictive power of social media in music.
3.4.1 Artist Reputation
Many studies include some form of artist reputation in their statistical analysis. Dewan and
Ramaprasad (2009, 2012 & 2014) include a dummy variable for artist reputation as a control variable. This variable is set to 1 if an artist appeared on the “top Artists of the Year” chart by Billboard
between 2002 and 2006, or if the artist appeared on the “Billboard All-Time Hot 100 Artists”. Artist reputation did not have a significant effect on music sampling (Dewan & Ramaprasad, 2012). Dewan and Ramaprasad (2014) split up their dataset based on artist reputation. The analysis showed that the negative relationship between song buzz and song sales is mainly caused by artist with a low reputation. It seems like artist who have not yet established a big reputation are mostly impacted by free sampling on blogs displacing sales. Chen et al. (2015) found that a decrease in sales from an
artist can lead to a decrease in artist reputation, defined as google searches, in the following week.
3.4.2 Record Label
Similar to artist reputation, Dewan and Ramaprasad (2009, 2012 & 2014) include a dummy variable for the type of record label as a control variable in their model. The dummy variable is set to 1 if the music has been released by a major record label and to 0 if music is released by an independent record label. A record label is classified as a major label when it is part of the Recording Industry Association of America. The relationship between type of record label and music sampling is significant, indicating that songs released by independent labels are sampled more (Dewan & Ramaprasad, 2012). Dewan and Ramaprasad (2014) split their sample based on type of record label. From the results it appears that the negative relationship between song buzz and song sales is mainly caused by music released by independent labels. For albums released by major record labels the relationship between buzz and sales is insignificant. Results by Dhar and Chang (2009) indicate that albums released by a major label generally receive higher album sales.
3.4.3 Traditional Media
Chen et al. (2015) included expenses on traditional media in their analysis, which they obtained from an advertising intelligence company. Traditional media includes TV, radio, newspapers and
18
3.5 Research Model
From previous research it can be conclude that volume-related variables, sentiment-related variables and user profile characteristics on Twitter have all seen significant results when used as predictor variables. However, the importance of each type of social media predictor variable depends on the context it is used in. Based on previous research, a significant relationship is expected between all three types of social media predictor variables in the music industry. A schematic representation of the research model can be found below in figure 1. It should be noted that this model is a
simplification of reality. There are many different factors influencing the amount of streams an album will receive. However, in this study the focus is on using metrics received from Twitter. The effects of additional variables related to the music industry will be explored in the additional analyses in chapter 5.3. Based on the literature review the following hypotheses have been formulated.
H1a: The volume of tweets for each album is positively associated with Spotify streams. H1b: The volume of tweets for each artist is positively associated with Spotify streams. H2a: Positive sentiment in tweets is positively associated with Spotify streams.
[image:24.595.68.524.418.732.2]H2b: Negative sentiment in tweets is negatively associated with Spotify streams. H3: Amount of followers is positively associated with Spotify streams.
19
4. Methodology
4.1 Data Collection
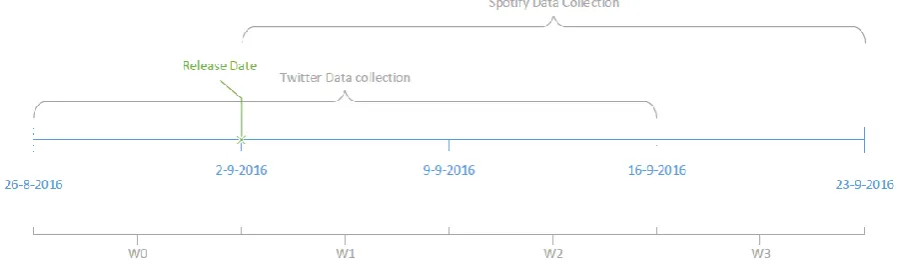
[image:25.595.71.522.409.542.2]Twitter data has been collected for five weeks between the 26th of August and the 30th of September. Tweets were collected from the week before the album release till two weeks after release (week 0 to week 2). In order to perform predictive analysis Spotify streams were collected from the first week of release to three weeks after the release (week 1 to week 3). Figure 2 provides more detail into the timeline of the data collection. The specific dates in figure 2 refer to the data collection process for albums released on the 2nd of September. Week 0 refers to the week before the album release, also referred to as the pre-release week. Twitter data has been collected in this week in order to test the predictive power of Twitter (see chapter 5.3). However, albums cannot receive any streams before they are released and therefore there is no streaming data for week 0. Week 1 is the album release week, the first day of week 1 is the release day of the album. Week 2 and week 3 are the week after the release week and the second week after the release week respectively. Album release dates were retrieved from www.hitsdailydouble.com and www.pauseandplay.com. The amount of albums released per week differs strongly. Albums are selected based on how likely a proper set of search query can be constructed in order to retrieve relevant tweets. If an album uses a very commonly used word as a title it is therefore less likely to be used in this research because many irrelevant tweets would be collected. The focus is on newly released albums, therefore EPs, live performances or tribute albums are excluded from the dataset.
Figure 2: Timeline of the data collection; example of albums released on 02-09-2016
4.1.1 Twitter
20 importance of using correct keywords and not just using the album title without consideration. Afterwards a new feature was implemented in the streaming API program that allowed for the use of the Boolean operator AND. Now, keywords can be more carefully chosen to collect more relevant tweets. Next to the content of the tweet, the account name, amount of followers of the account and the time stamp of the tweet were also collected using the streaming API. Our program collected tweets for five weeks between the 26th of August and the 30th of September. This resulted in the collection of 2,469,574 tweets from 898,837 unique users.
4.1.2 Spotify
The number of weekly streams per album were manually collected from Spotify. Because Spotify only publishes the daily streams for the 200 most streamed tracks per day, album streams had to be collected manually. As with Twitter, a short test of data collection was done to see if the streaming number of songs is updated regularly and correctly. Data was collected for a sample of songs including very popular songs and less popular songs. Song data and album data showed that streaming numbers were all updated regularly. For the tracks that were in the top 200 most
streamed daily songs we could calculate the difference between the chart numbers and the manually collected numbers. The average difference between these two was 1.26%, which is probably caused by the official chart numbers being collected in a different 24 hour timeframe than the manually collected numbers. For the albums in our dataset, the number of streams received by singles and promotional songs released before the album release date were collected on Thursday night right before the release of the album. Afterwards, streaming data was collected weekly and previously released streams were subtracted to calculate the amount of new streams received per week.
4.1.3 Additional Data
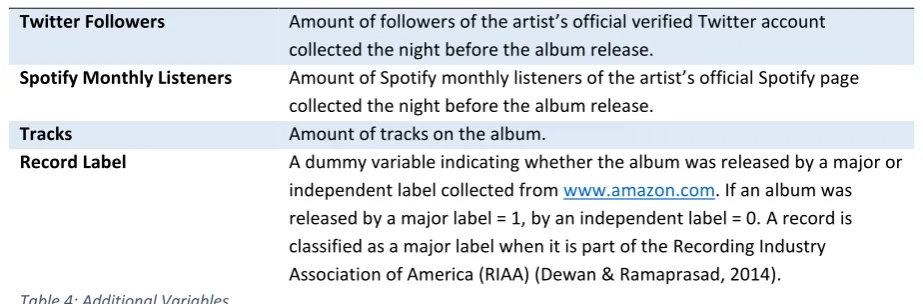
The data was supplemented with additional variables next to data from Twitter and Spotify. The focus of this research is on the relationship between Twitter predictor variables and Spotify streams. However, research identified some additional variables that could play a role in this relationship. Therefore, additional variables were collected which will be used in the additional analyses in chapter 5.3. For each artist in the dataset the amount of Twitter followers and Spotify monthly listeners were manually collected on the night before release of the album. The amount of tracks on each album and whether the album was released by a major or independent label were also collected. More details regarding these additional variables can be found in table 4.
Additional Variables
Twitter Followers Amount of followers of the artist’s official verified Twitter account collected the night before the album release.
Spotify Monthly Listeners Amount of Spotify monthly listeners of the artist’s official Spotify page collected the night before the album release.
Tracks Amount of tracks on the album.
[image:26.595.61.523.598.750.2]21
4.2 Data Analysis
4.2.1 Preprocessing
A small sample of the albums that tweets were collected for were not released on Spotify (for example, Jason Aldean – They Don’t Know). Therefore, keywords for these albums were removed from the database. One extreme outlier (Shawn Mendes – Illuminate) was removed from the dataset. This album had extremely high values for both tweet volume and streams compared to the rest of the dataset. For example, the inclusion of this album resulted in the mean of the tweets containing the album name per week becoming ten times as big as its median. Finally, random samples per keyword were checked to test if these keywords actually captured tweets about the artist or album, or if these keywords were also used to discuss other things. Twenty-eight albums were used for the analysis. These albums and their release dates can be found in appendix F. Before sentiment analysis can be performed on a text it is important that the text is properly
preprocessed. Parts of the text that are not influencing the sentiment expressed in the tweet should be removed or replaced. For example, if a tweet is addressed to a user called @horrible than that tweet could be wrongly classified as negative despite the real message of the tweet being positive. All preprocessing and statistical analyses have been performed in R. The tweets in our dataset have been preprocessed using the following steps:
Replace all capitalization with lower case Remove hashtags
Remove @mentions Remove URLs
Remove stop words (top 25)
Album title/artist name filtered out. Before calculating the sentiment the name of the respective artist or album for which the tweet was collected is removed. These names are only removed for the sentiment analysis and not from the real dataset. This is to prevent tweets that mention album titles like ‘Bad Vibrations’ and ‘False Readings On’ to be classified as a false negative.
4.2.2 Sentiment Analysis
22 However, machine learning models require a large manually coded test set. Due to time and budget constraints the decision was made to use a lexicon-based approach. The recently released ‘syuzhet’ package in R was used to calculate the sentiment. This package offers four different lexicons to detect sentiment that all have roots in academic research. These lexicons are taken from: syuzhet (sentiment dictionary from the Nebraska Literary Lab), Liu, Hu and Cheng (2005), Nielsen (2011) and Mohammad and Turney (2010).
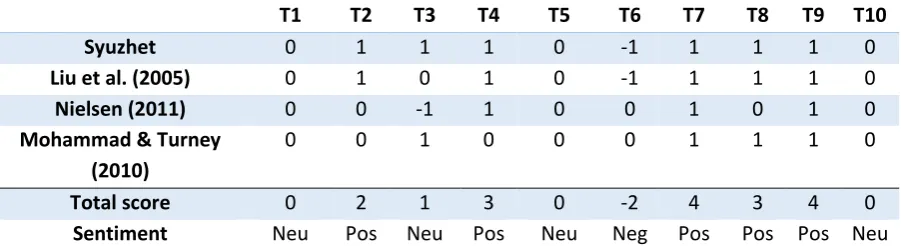
Sentiment analysis is still an immature topic. Experiments with previous methods showed the sensitivity of various methods. Therefore, a combination of all lexicons is used which only decides on the classification of sentiment when multiple lexicons agree. Each lexicon provides an average polarity score per tweet. A function was written that rounds up the value of sentiment classification for each method per tweet, where positive values become +1, negative values become -1 and zeros stay as 0. Each method produces an output with different ranges, so by rounding each individual score to +1, -1 or 0 they can be properly compared. Then, these scores are summed for each tweet and the tweet is only classified as positive if the sum of rounded sentiments is at least two, and negative if that sum is at least minus two. If the score is in between these values, the tweet is classified as neutral since it does not contain a clear sentiment. Combining the scores of these four methods and checking for congruency between them allows us to better classify the sentiment of tweets. Table 5 presents an example of the process. This table already features the rounded scores to -1, +1 or 0 for ten random tweets in the dataset.
T1 T2 T3 T4 T5 T6 T7 T8 T9 T10
Syuzhet 0 1 1 1 0 -1 1 1 1 0
Liu et al. (2005) 0 1 0 1 0 -1 1 1 1 0
Nielsen (2011) 0 0 -1 1 0 0 1 0 1 0
Mohammad & Turney (2010)
0 0 1 0 0 0 1 1 1 0
Total score 0 2 1 3 0 -2 4 3 4 0
[image:28.595.69.520.410.533.2]Sentiment Neu Pos Neu Pos Neu Neg Pos Pos Pos Neu
Table 5: Example of the sentiment classification using the four lexicons. T1-T10 are ten random tweets from our dataset. Abbreviations: neu = neutral, neg = negative, pos = positive.
4.3 Model Design
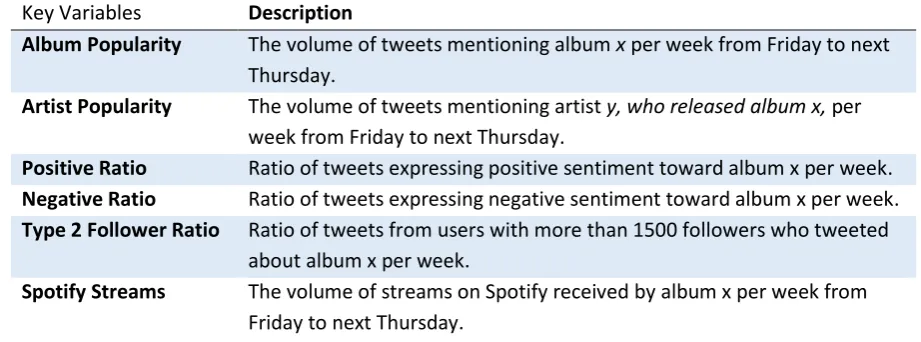
The Twitter predictor variables used in this research can be split up in three categories:
- Volume-related variables: The volume of tweets mentioning a certain album per week: album popularity. And the volume of tweets mentioning a certain artist (that released said album) per week: artist popularity.
- Sentiment-related variables: Positive ratio, negative ratio. - Profile characteristics of online users: Ratio of type 2 followers.
23 Key Variables Description
Album Popularity The volume of tweets mentioning album x per week from Friday to next Thursday.
Artist Popularity The volume of tweets mentioning artist y, who released album x, per week from Friday to next Thursday.
Positive Ratio Ratio of tweets expressing positive sentiment toward album x per week. Negative Ratio Ratio of tweets expressing negative sentiment toward album x per week. Type 2 Follower Ratio Ratio of tweets from users with more than 1500 followers who tweeted
about album x per week.
[image:29.595.60.521.72.243.2]Spotify Streams The volume of streams on Spotify received by album x per week from Friday to next Thursday.
Table 6: Key variables
Before performing linear regression, correlations were calculated first. Because the data in our dataset is not normally distributed, Spearman’s rho was chosen instead of Pearson’s r. Spearman’s correlation coefficient is denoted as 𝑟𝑠 and is restricted by −1 ≤ 𝑟𝑠 ≤ 1, where the closer 𝑟𝑠 is to 1 the stronger the positive correlation. Similarly, the closer 𝑟𝑠 is to -1, the stronger the negative correlation. Spearman’s rho is calculated according to equation 1 presented below, where 𝑟𝑠 is the correlation coefficient (Spearman’s rho), 𝑑 is the difference in ranks between a pair of scores and 𝑛 is the number of ranks.
𝑟𝑠 = 1 −
6 ∑ 𝑑2
𝑛(𝑛2− 1) (1)
After performing the correlational analysis the relationship between the key variables will be tested using multiple linear regression analysis. The multiple linear regression equation is presented below in equation 2. Let 𝑌 denote the amount of Spotify streams and 𝜖 the error. Then 𝛽𝑖 refers to the regression coefficient for each parameter. The parameters are:
- X1: Album Popularity - X2: Artist Popularity - X3: Positive Ratio - X4: Negative Ratio - X5: Type 2 Follower Ratio
𝑌 = 𝛽0+ 𝛽1𝑋1+ 𝛽2𝑋2+ 𝛽3𝑋3+ 𝛽4𝑋4+ 𝛽5𝑋5+ 𝜖 (2)
24 Twitter predictor variables from the week before release (week 0) will be used to predict the Spotify streams received in the release week (week 1).
The main measure for testing the fit of the overall regression model is the coefficient of
determination, the R2. The R2 measures the proportion of variance in the dependent variable that is explained by the independent variables. While the R2 always increases when more variables are added to the linear model, the adjusted R2 takes the addition of extra variables into account. Therefore, the adjusted R2 is used in this study.
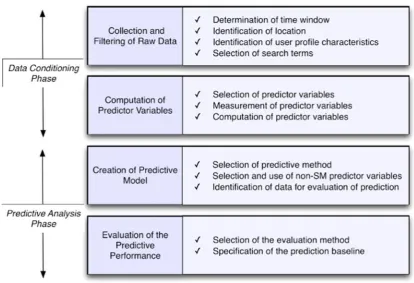
[image:30.595.93.508.339.622.2]Kalampokis et al. (2013) provided a framework to analyze current research and design future research into the predictive power of social media. This framework can be found in figure 3. This framework was followed throughout the design of this research. A structured overview of the methodology used in this paper can be found in the completed framework in Appendix G.
25
5. Results
5.1 Dataset Characteristics
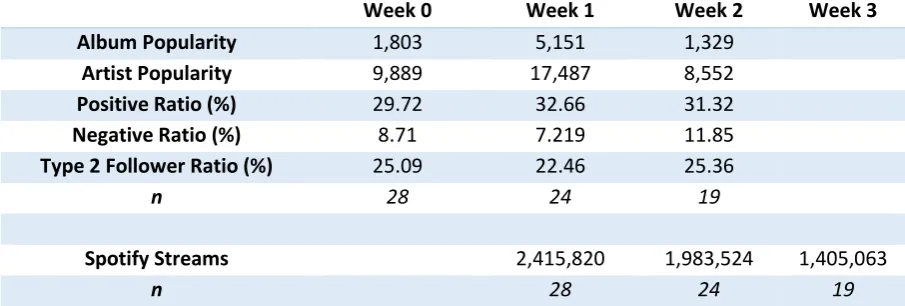
Summary statistics for all variables can be found in table 7. For albums released close to the 30th of September it was impossible to collect Twitter data for two weeks after the release date since the data collection had already been closed. Table 7 provides more detail into how much data is included in the analysis per week. When inspecting the mean values in table 7 a big peak of the volume of tweets containing the album name (album popularity) is observed in the release week (5151). As one might expect, most people would tweet about an album shortly after it has been released. The volume of tweets containing the album name (album popularity) is also higher in week zero than in week two, suggesting that pre-release promotional activities increase the volume of tweets. From now on, variables are referred to by their variable names as described in table 6. Therefore, instead of ‘the volume of tweets mentioning the artist’, we will now refer to this variable as ‘artist
popularity’. For artist popularity we see a similar peak during release week, although the difference in volume between the week before release and week two is much smaller than for album
popularity. Asur and Huberman (2010) observed an increase in the amount of sentiments after a movie release. In our dataset the ratios of positive and negative sentiment per week are constant across all weeks. As expected the amount of Spotify streams peak during the first week of release and steadily decrease with 25.7% and 29.2% in the second and third week.
Week 0 Week 1 Week 2 Week 3
Album Popularity 1,803 5,151 1,329
Artist Popularity 9,889 17,487 8,552
Positive Ratio (%) 29.72 32.66 31.32
Negative Ratio (%) 8.71 7.219 11.85
Type 2 Follower Ratio (%) 25.09 22.46 25.36
n 28 24 19
Spotify Streams 2,415,820 1,983,524 1,405,063
[image:31.595.65.518.406.559.2]n 28 24 19
26 Figure 4: Volume of tweets containing the album name per week (album popularity).
[image:32.595.75.510.429.734.2]27 Figure 6: Amount of Spotify streams per week. W0 denotes Week 0, which is the week before the release of the album. Therefore, all albums received zero streams in week 0.
In order to further explore the weekly trajectory of the volume-related variables and streams, charts were made which can be found in figures 4-6. Figures 4-6 present weekly data which is also used in further analysis. Only albums for which data in all weeks was available are included in these charts, which means that nineteen albums have been included. For album popularity a clear peak during the release week can be observed in figure 4. The only album that does not follow this trend is ‘Hard II Love’ which shows a decrease from week 0 to week 2. Generally, tweet volume in week 0 seems to be slightly higher than the tweet volume in week 2. Figure 5 presents the artist popularity per week, which shows a similar peak in week 1 like figure 4. However, the tweet volume containing the artist ‘Mac Miller’ shows a different pattern by peaking in week 0. The amount of Spotify streams are shown in figure 6. The amount of streams peaks in the release week and steadily decreases afterwards.
With regard to the peak of album popularity in week 1 an additional chart was created which can be found in figure 7. For this chart the album popularity has been calculated per day instead of per week. The chart in figure 7 shows a big peak on release day (day 8) for most albums, which is
28 Figure 7: Tweet volume of tweets containing the album name (album popularity) per day. The dotted line on day 8
represents the album release.
Before entering the variables into the multiple linear regression model, correlations were calculated. The correlation matrix, including two-tailed p-values, can be found in table 8. Spearman’s rho correlations were calculated using only complete observations (n = 43). A high positive correlation is observed between album popularity and artist popularity, 𝑟𝑠 = .83, p < .01. This suggests that the volume of tweets about album and artist are closely related. The positive sentiment ratio of tweets is positively correlated with both album popularity (𝑟𝑠 = .35, p < 0.05) and artist popularity (𝑟𝑠 = .45, p < .01). It seems like the ratio of positive tweets increases along the volume of tweets. Between Spotify streams and the independent variables, multiple significant correlations can be observed. Both album popularity (𝑟𝑠 = .69, p < .01) and artist popularity (𝑟𝑠 = .82, p < 0.01) show a significant positive correlation with Spotify streams. The type 2 follower ratio displays a significant negative correlation with Spotify streams (𝑟𝑠 = -.30, p < .05). These correlations suggest that while the volume of tweets about the album and artist increase, Spotify streams also increase. On the other hand, when the amount of tweets from users with a high following increases, Spotify streams seem to decrease.
Album Popularity
Artist Popularity
Positive Ratio
Negative Ratio
Type 2 Follower Ratio
Spotify Streams 1. Album Popularity -
2. Artist Popularity 0.83** -
3. Positive Ratio 0.35* 0.45** -
4. Negative Ratio 0.07 0.15 -0.08 -
5. Type 2 Follower Ratio
-0.25 -0.19 -0.18 0.21 -
6. Spotify Streams 0.69** 0.82** 0.29 0.13 -0.30* -
[image:34.595.65.521.616.757.2]