On Pattern Mining in Graph Data
to Support Decision-Making
Von der Fakultät für Mathematik und Informatik
der Universität Leipzig
angenommene
D I S S E R T A T I O N
zur Erlangung des akademischen Grades
Doctor Rerum Naturalium
(Dr. rer. nat.)
im Fachgebiet Informatik
vorgelegt von
Diplom-Ingenieur (FH) André Petermann
geboren am 22. November 1984 in Zwickau
Die Annahme der Dissertation wurde empfohlen von:
1. Prof. Dr. Erhard Rahm, Universität Leipzig
2. Prof. Dr. Esteban Zimányi, Université Libre de Bruxelles
Die Verleihung des akademischen Grades erfolgt mit Bestehen der
Verteidigung am 21. Januar 2019 mit dem Gesamtprädikat
Magna cum Laude
Abstract
In recent years graph data models became increasingly important in both research and industry. Their core is a generic data structure of things (vertices) and con-nections among those things (edges). Rich graph data models such as the property graph model support additional data attached to vertices and edges. Such data ranges from simple labels to named attributes. Thus, graph data models can be used to represent data of different domains. Typically, they are used to repre-sent native network data such as the world wide web, social networks or complex knowledge bases. However, they are also suitable to represent data from domains that are strongly placed in the context of relational databases. An example is data from business information systems. Here, domain objects such as customers, prod-ucts and sales orders can be represented by vertices and their relationships can be represented by edges.
Graphs have an extraordinary analytical power because relationships can be evaluated without schema knowledge. For example, it is possible to query all ver-tices that are connected to one another without knowledge about possible rela-tionship types. By contrast, for such queries relarela-tionship types are even part of the result. There are also data mining techniques based on this property of graph data models. The present dissertation will study to which extend graph data mod-els and data mining techniques based thereon may help analysts to make better decisions. As general as this problem sounds, so versatile are the studied prob-lems. In particular, they range from transforming relational data into graphs to the extraction of relevant patterns.
Around these subproblems we developed a conceptual framework called BIIIG (Business Intelligence with Integrated Instance Graphs). The term business intelligence is usually associated with data warehouse models which are tailored to the representation of facts, measures and dimensions. With BIIIG, we transfer these concepts to a graph data model. In particular, we propose to represent logi-cal partitions of interrelated data by a collection of many small graphs. In BIIIG’s model these graphs contain not only interrelated facts but also subgraphs of di-mension values that occur in multiple graphs. Further on, measure values such as business indicators must be evaluated on the graph level. With characteristic subgraph mining, we will propose an example analytical workflow that is capable to extract interesting patterns that cannot be found by existing approaches.
We identified different requirements that must be met to implement BIIIG. Since we evaluate measures in the context of graphs a crucial one is the repre-sentation of graphs where not only vertices and edges but also graphs themselves may have attributes. By an overview of recent graph database and graph process-ing systems we will show that currently no system supports these features. Thus, we developed the so-called Extended Property Graph Model which extends the property graph model by respective graph collections and operators that allow to create, modify or evaluate graph attributes.
Another crucial problem that will be studied is the transformation of business data, which is commonly stored in relational databases, into property graphs. We will present a flexible approach based on metadata evaluation. Our solution pro-vides more features than previous academic approaches and solutions provided by database vendors. Additionally, our approach includes a seamless data integration strategy and a generic algorithm that can turn a large graph of business data into a collection of meaningful subgraphs. Since real business data is not available we used test data of a real business information system and developed a data generator based on business process simulation to evaluate these techniques.
An important primitive to extract patterns from graph collections is frequent subgraph mining. In the past this problem has only been studied for chemical datasets where graphs represent molecules. Since business data shows different characteristics existing algorithms cannot be applied to BIIIG. Thus, we extended an existing algorithm by the missing features. Frequent subgraph mining is our most expensive subproblem in terms of computational complexity. Thus, this dis-sertation also studies the problem’s parallelization in the context of state-of-the-art Big Data technology. In particular, we propose an approach that brings the com-putation to the data and propose multiple optimizations to decrease runtime. In an extensive experimental evaluation, we will show the scalability of our solution with regard to different parameters.
Many interesting patterns can only be extracted, if dimension values are at-tached to taxonomies and also generalizations are evaluated. Thus, this disserta-tion also studies the problem of generalized frequent subgraph mining. We will propose an efficient algorithm with support for multiple dimensional taxonomies. To improve efficiency, we decompose the problem into separate mining steps for frequent subgraphs and frequent vectors that represent vertex dimensions.
With Gradoop, a distributed system for declarative graph analytics, there is already a first system that supports the Extended Property Graph Model. The de-velopment of BIIIG was often connected to the dede-velopment of Gradoop. Thus, some implementations of BIIIG’s components, for example our horizontally scal-able approach to frequent subgraph mining, were contributed to Gradoop. Thus, just like the framework, they are available under an Open Source licence. Addi-tionally, thread-parallel implementations of all proposed data mining algorithms have been turned into an Open Source Java library. At the end of this disserta-tion we will report two real-world applicadisserta-tions of BIIIG in cooperadisserta-tion with two large-scale enterprises. The application scenarios were targeting the identifica-tion of patterns that are characteristic to fraud and security threats. With these evaluations we were able to confirm that our approach works.
The result of this dissertation is BIIIG, a practical conceptual framework for graph-based business intelligence. All components of BIIIG were implemented and the resulting prototypes were evaluated in experiments. Further on, the func-tionality of BIIIG has been confirmed in real-world applications. By the diversity of these applications’ domains we could show that BIIIG is not limited to busi-ness intelligence. Its major strength is the extraction of domain knowledge by a generic pattern mining process that requires no schema knowledge as input. In particular, this is useful for an initial discovery but also for continuous monitoring of patterns that occur in one or more interrelated databases. This dissertation will further state open research questions for graph-based business intelligence. These questions will relate to technical problems to further improve performance and to functional extensions to improve usability.
Acknowledgements
There are so many parties whom I would like to thank. Let me start with academia. First of all, I would like to thank Professor Johannes Waldmann for arousing my interest in computing science. Without his lectures I would never have discovered my passion for programming. Further thanks goes to Professor Jörg Bleymehl who brought me to my initial scholarship for cooperative PhD studies between both Leipzig Universities. I would probably never have started this dissertation without this option. My deepest thanks also goes the Professor Robert Müller whose support enabled me to catch the scholarship and who gave me first advice about professional research. Further on, also his lectures played an important role in my life as they woke up my interest in databases that continues unil today. Finally, highest thanks goes to Professor Erhard Rahm who gave me the chance to prove myself in Leipzig’s database research group despite my rather untypical CV. Without his guidance and supervision this dissertation would never have been finished.
A second party who I’d like to thank are companies that enabled practical expe-rience that would never have been possible without their cooperation. First, there is Axel Schwanke from Immowelt. I would like to thank him for the option to send a student to Immowelt to evaluate BIIIG on Gradoop. Further thanks goes to Gerald Ulmer from Siemens. He enabled me to evaluate the findings of this disser-tation in practice under very good conditions. I would also like to thank the whole STA team for welcoming me warmly despite my short and sporadic presence.
Further thanks goes to my former colleagues of the database research group for interesting discussions about research in general and about the joy and sorrow that we were all facing at certain times of our work. Very special thanks goes to the graph guys which are Martin Junghanns as well as our former student assistants Kevin Goméz, Niklas Teichmann and Stephan Kemper. Without them work would have been quite lonely. In particular, I would like to thank Martin for all the endless discussions about graphs and programming. I am sure without them this disserta-tion would have had a different outcome. Special thanks also goes to Kevin who did more than just a student job to make experiments running and always kept all these tedious configuration things away from me. Further special thanks goes to Markus Nentwig. I thank him and Martin for all the happy memories about lunch breaks, pub evenings and business trips.
I also want to thank all of my friends for not abandoning me after hearing sentences like"Sorry, I must focus on a paper right now. I will call you back.","No, not this weekend I have a deadline to catch." and"Let’s postpone this after I will have finished my dissertation, please." Very special thanks goes to Dr. Roxana Bujack who is not only a friend but also contributed to this dissertation by giving me some valuable tutoring sessions in mathematics during the first months of my research.
Further highest thanks goes to my parents Egon and Sieglinde Petermann. I am the fist in the family who made it to the dissertation and without them that would never have been possible. Making them proud has always motivated me. I thank my mother in particular for keeping me on track back in school days. Without her commitment and knowledge I would probably have not even made it to university. I also thank my father in particular for his constant support for doing things in my way. Because of him I also know that freedom, the key to personal fulfilment, is not self-evident and that I can consider myself fortunate to grew up in a free country. If education had been linked to political submission even today, I would not have made it this far.
Finally, my greatest thanks goes to Janet Jesemann who intensively supported me over all the years like no other. I thank her not only for the immense effort of proof-reading my papers and this dissertation but also for all the priceless mental support. She has endured an endless number of discussions related to my research, pulled me out of every crisis and stopped me from giving up more than once. So, a part of this dissertation also belongs to her.
About the Author
Andre Petermann studied Multimedia Technology at Leipzig University of Applied Science and graduated as Diplom-Ingenieur (FH) in 2011. In 2009, he also received a bachelor’s degree in Information Technology from the University of the West of Scotland as part of an ERASMUS programme. After studies he left univeristy and became a data warehouse developer. When he came into contact with graph databases for the first time he had the idea to utilize them for business intelligence. He though the best way to investigate this topic would be a dissertation and started looking for professors that may support this idea. With Professor Erhard Rahm from Leipzig University and Professor Robert Müller from Leipzig University of Applied Sciences he found two supporters and could successfully apply for a pub-lic scholarship 1. So, in 2013 he went back to university and started research at
Leipzig University’s database research group. In 2015 he became a research assis-tant at ScaDS Dresden/Leipzig Competence Center for Scalable Data Services and Solutions2.
1funded within the EU programEuropa fördert Sachsenof the European Social Fund 2funded by the German Federal Ministry of Education and Research (BMBF 01IS14014B)
Dissertation-related Publications
1. Petermann, A., Junghanns, M., Müller, R. and Rahm, E. BIIIG : Enabling Busi-ness Intelligence with Integrated Instance Graphs. In Workshops Proceed-ings of the 30th International Conference on Data Engineering Workshops, ICDE 2014, Chicago, IL, USA, March 31 - April 4, 2014 (2014), pp. 4–11. 2. Petermann, A., Junghanns, M., Müller, R. and Rahm, E. FoodBroker -
Gen-erating Synthetic Datasets for Graph-Based Business Analytics. In Big Data Benchmarking - 5th International Workshop, WBDB 2014, Potsdam, Ger-many, August 5-6, 2014, Revised Selected Papers (2014), pp. 145–155. 3. Petermann, A., Junghanns, M., Müller, R. and Rahm, E. Graph-based data
in-tegration and business intelligence with BIIIG. PVLDB 7, 13 (2014), 1577–1580. 4. Junghanns, M., Petermann, A., Teichmann, N., Gómez, K. and Rahm, E.
An-alyzing Extended Property Graphs with Apache Flink. In Proceedings of the 1st ACM SIGMOD Workshop on Network Data Analytics, NDA@SIGMOD 2016, San Francisco, California, USA, July 1, 2016 (2016), pp. 3:1–3:8.
5. Petermann, A. and Junghanns, M. Scalable Business Intelligence with Graph Collections. it - Information Technology 58, 4 (2016), 166–175.
6. Petermann, A., Junghanns, M., Kemper, S., Gómez, K., Teichmann, N., and Rahm, E. Graph Mining for Complex Data Analytics. In IEEE International Conference on Data Mining Workshops, ICDM Workshops 2016, December 12-15, 2016, Barcelona, Spain. (2016), pp. 1316–1319.
7. Junghanns, M., Petermann, A., Neumann, M. and Rahm, E. Management and Analysis of Big Graph Data: Current Systems and Open Challenges. In Handbook of Big Data Technologies. 2017, pp. 457–505.
8. Junghanns, M., Petermann, A. and Rahm, E. Distributed Grouping of Prop-erty Graphs with Gradoop. In Datenbanksysteme für Business, Technolo-gie und Web (BTW 2017), 17. Fachtagung des GI-Fachbereichs „Datenbanken und Informationssysteme" (DBIS), 6.-10. März 2017, Stuttgart, Germany, Pro-ceedings (2017), pp. 103–122.
9. Junghanns, M., Petermann, A., Teichmann, N. and Rahm, E. The Big Picture: Understanding large-scale graphs using Graph Grouping with Gradoop. In Datenbanksysteme für Business, Technologie und Web (BTW 2017), 17. Fachtagung des GI-Fachbereichs „Datenbanken und Informationssysteme" (DBIS), 6.-10. März 2017, Stuttgart, Germany, Proceedings (2017), pp. 629–632.
10. Kemper, S., Petermann, A. and Junghanns, M. Distributed FoodBroker: Skalier-bare Generierung graphbasierter Geschäftsprozessdaten. In Datenbanksys-teme für Business, Technologie und Web (BTW 2017), 17. Fachtagung des GI-Fachbereichs „Datenbanken und Informationssysteme" (DBIS), 6.-10. März 2017, Stuttgart, Germany, Workshopband (2017), pp. 105–110.
11. Junghanns, M., Kiessling, M., Averbuch, A., Petermann, A. and Rahm, E. Cypher-based Graph Pattern Matching in Gradoop. In Proceedings of the Fifth International Workshop on Graph Data-management Experiences & Systems, GRADES@SIGMOD/PODS 2017, Chicago, IL, USA, May 14 - 19, 2017 (2017), pp. 3:1–3:8.
12. Petermann, A. Graph Pattern Mining for Business Decision Support. In Pro-ceedings of the VLDB 2017 PhD Workshop co-located with the 43rd Interna-tional Conference on Very Large Databases (VLDB 2017), Munich, Germany, August 28, 2017. (2017).
13. Petermann, A., Micale, G., Bergami, G., Pulvirenti, A. and Rahm, E. Min-ing and RankMin-ing of Generalized Multi-Dimensional Frequent Subgraphs. In 2017 Twelfth International Conference on Digital Information Management (ICDIM) (Sept 2017), pp. 236–245.
14. Petermann, A., Junghanns, M. and Rahm, E. DIMSpan - Transactional Fre-quent Subgraph Mining with Distributed In-Memory Dataflow Systems. In Proceedings of the Fourth IEEE/ACM International Conference on Big Data Computing, Applications and Technologies (Austin, TX, USA, 2017), BDCAT ’17, ACM, pp. 237–246.
15. Bergami, G., Petermann, A. and Montesi, D. THoSP: an Algorithm for Nest-ing Property Graphs. In ProceedNest-ings of the 1st ACM SIGMOD Joint In-ternational Workshop on Graph Data Management Experiences & Systems (GRADES) and Network Data Analytics (NDA), Houston, TX, USA, June 10, 2018 (2018), pp. 8:1–8:10.
16. Junghanns, M., Kiessling, M., Teichmann, N., Gómez, K., Petermann, A., and Rahm, E. Declarative and distributed graph analytics with Gradoop. PVLDB to appear (2018).
Contents
1 Introduction 10
1.1 Relational Data vs. Graph Data . . . 10
1.2 Graphs for Business Intelligence . . . 16
1.3 Contributions and Publications . . . 20
1.4 Structure of Dissertation . . . 22
2 Background and Related Work 24 2.1 Graph Data Structures . . . 24
2.2 Comparison of RDF and Property Graphs . . . 30
2.3 Distributed Dataflow Systems . . . 34
2.4 Graph Processing . . . 36
2.5 Graph Databases . . . 37
2.6 Graph Transformation of Relational Data . . . 42
2.7 Graph-based Data Warehousing . . . 44
2.8 Graph Pattern Mining . . . 46
2.9 Data Generators . . . 53
3 Analytical Framework 55 3.1 Master and Transaction Data . . . 55
3.2 Business Transaction Graphs . . . 56
3.3 Example Scenario . . . 58
3.4 Measures and Dimensions . . . 59
3.5 Characteristic Subgraph Mining . . . 61
3.6 Requirements . . . 64
4 Extended Property Graph Model 65 4.1 Motivation . . . 65
4.2 Data Structure and Operators . . . 67
4.3 The Gradoop Framework . . . 70
4.4 FoodBroker Data Generator . . . 72
5 Graph-based Transformation and Integration of Data 80
5.1 Overview . . . 80
5.2 Metadata Management . . . 84
5.3 Graph Transformation . . . 90
5.4 Data Integration . . . 91
5.5 Business Transaction Graphs . . . 96
5.6 Experimental Evaluation . . . 99
5.7 Conclusion . . . 104
6 Frequent Subgraph Mining in Distributed Graph Collections 105 6.1 Motivation . . . 105
6.2 Frequent Subgraph Mining in Collections of Directed Multigraphs . . . 107
6.3 Frequent Subgraph Mining with Distributed Dataflow Systems . . . 115
6.4 Comparison to MapReduce-based Approaches . . . 124
6.5 Experimental Evaluation . . . 129
6.6 Conclusion . . . 134
7 Generalized Multidimensional Frequent Subgraph Mining 135 7.1 Motivation . . . 135
7.2 Problem, Data Model and Terminology . . . 138
7.3 Path Substitution Method . . . 140
7.4 Pattern Decomposition Method . . . 142
7.5 Experimental Evaluation . . . 149
7.6 Conclusion . . . 153
8 Real-World Applications, Conclusion and Outlook 154 8.1 BIIIG for Real Estate Fraud Detection . . . 154
8.2 BIIIG for Security Threat Analysis . . . 156
8.3 Conclusion . . . 159
List of Definitions
2.1 Undirected Simple Graph . . . 27
2.2 Directed Simple Graph . . . 27
2.3 Directed Multigraph . . . 27
2.4 Labeled Directed Multigraph . . . 28
2.5 Property Graph . . . 28
2.6 RDF Triple Graph . . . 29
2.7 RDF N-quad Graph Collection . . . 29
2.8 Hypergraph . . . 29 2.9 Hypervertex Graph . . . 30 3.1 Master Data . . . 55 3.2 Transaction Data . . . 56 3.3 Business Process . . . 56 3.4 Business Case . . . 56
3.5 Business Transaction Graph . . . 58
3.6 Measure . . . 59
3.7 Dimension . . . 59
3.8 Dimension Relationship Pattern . . . 60
4.1 Property Graph Collection . . . 67
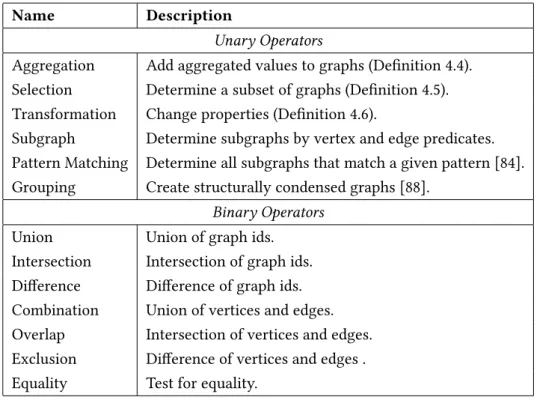
4.2 EPGM Operator . . . 67
4.3 Graph Collection Copy . . . 68
4.4 Aggregation . . . 68 4.5 Selection . . . 69 4.6 Property Transformation . . . 69 6.1 Subgraph . . . 108 6.2 Path . . . 108 6.3 Pattern . . . 108 6.4 Isomorphism . . . 108 6.5 Embedding . . . 108 6.6 Support . . . 109
6.7 Frequent Subgraph Mining . . . 109
6.8 Parent-Child Relationship of Graphs . . . 109
6.10 DFS Embedding . . . 113
6.11 DFS Extension . . . 113
6.12 Parent-Child Relationship of DFS Codes . . . 114
6.13 Minimum DFS Code . . . 114 7.1 Taxonomy/Taxonomy Path . . . 139 7.2 Label Generalization . . . 139 7.3 Top-level Label . . . 139 7.4 Bottom-level Label . . . 139 7.5 Multidimensional Graph . . . 140 7.6 Graph Generalization . . . 140 7.7 Top-level Graph . . . 140 7.8 Bottom-level Graph . . . 140
7.9 Generalized Multidimensional Frequent Subgraph Mininig . . . 140
7.10 Global Order of Labels . . . 143
7.11 Taxonomy Path Vector . . . 144
7.12 Vector Generalization . . . 145
List of Figures
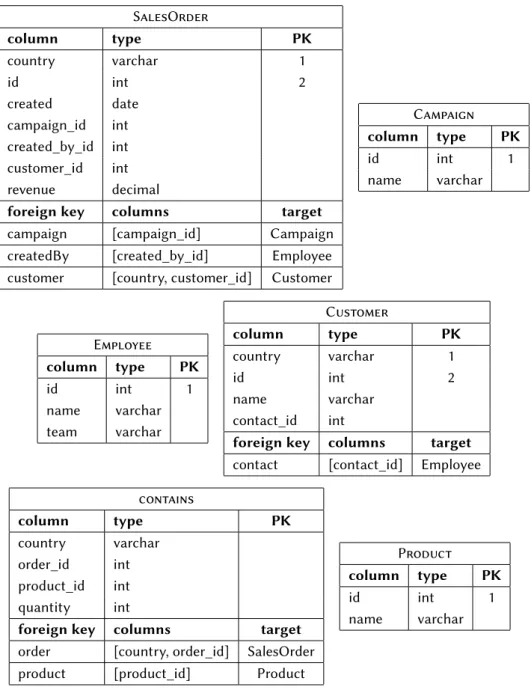
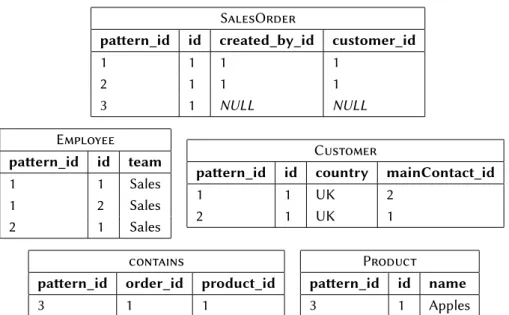
1.1 Schema (Metadata) of a relational database: Every rectangle represents a table definition including the table name (e.g. SalesOrder) and all columns, their data type and primary key position (PK). Further on, each table contains foreign keys including their columns and target
table. . . 11
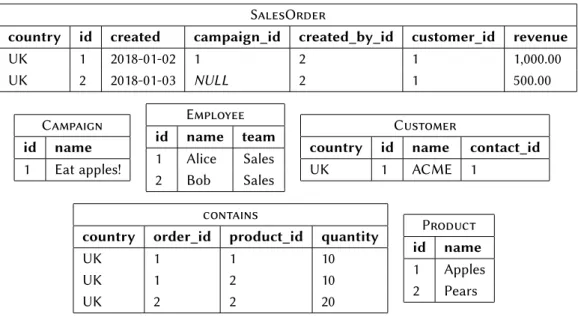
1.2 Comparison of the same instance data in relational and graph repre-sentation. . . 12
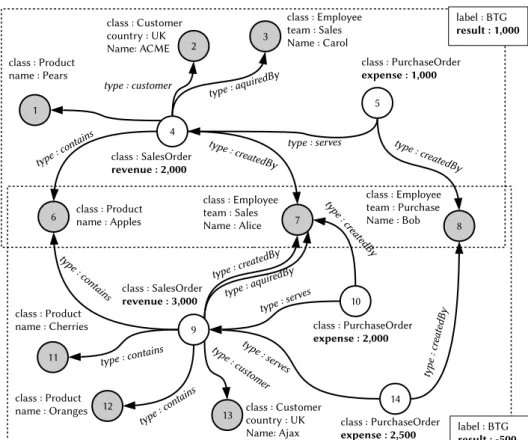
1.3 Comparison of a pattern mining result in graph and relational repre-sentation. Both representations contain the same information. . . 14
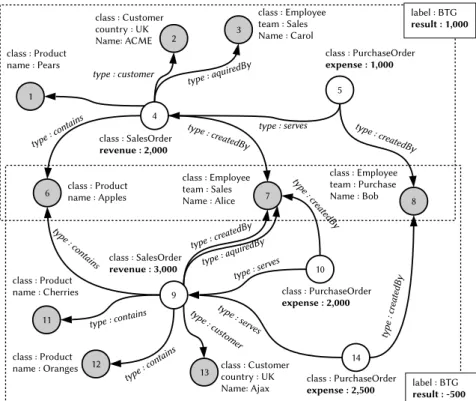
1.4 Example graph collection with shared vertices. Dotted lines represent graph boundaries. Solid rectangles overlaying the graphs’ boundaries contain graph properties. Bold properties contain measure values and normal font ones dimensional values. . . 17
1.5 Example Taxonomy of dimensionEmployee. . . 18
1.6 Example generalization of a graph pattern. . . 19
2.1 Graph structures with different edge characteristics. . . 27
2.2 Graph structures with different attached data formats. . . 28
2.3 Hypergraphs and hypervertices. . . 30
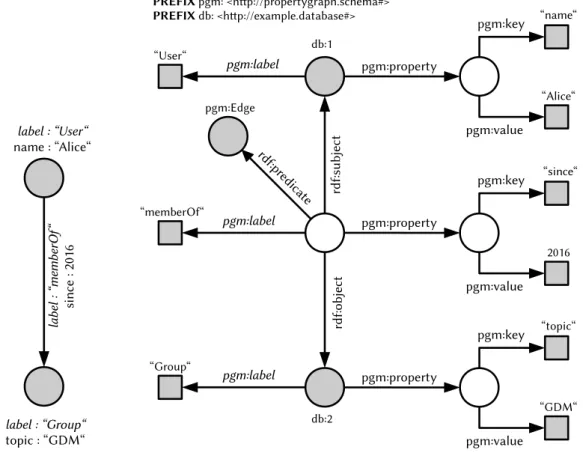
2.4 Comparison of an example property graph with mandatory label prop-erties (italic font) and its schema-less RDF representation by standard reification. . . 32
2.5 Comparison of pattern matching queries. . . 40
3.1 Example business transaction graphs with aggregated graph measures isClosedandsoCount[139] . . . 57
3.2 Example relationship patterns with dimension values aslabel-properties. 59 3.3 Business transaction graph (id=1) after normalization for pattern mining. 62 4.1 Example graph collection with shared vertices. Dotted lines represent graph boundaries. Solid rectangles overlaying the graphs’ boundaries contain graph properties. Bold properties contain measure values and normal font ones dimensional values. . . 66
4.3 FoodBroker Schema : The outer rectangles show the boundaries of two systemsERPandCIT. Database tables correspond either to classes or n:m relationship types (*Line). Primary keys are highlighted by italic letters. Relationship types are shown as solid lines. Foreign keys are attached to relationship types. Implicit relationship types in between both databases are represented by dotted lines. For each implicit rela-tionship type, there is a corresponding column with prefixerp. . . 74 5.1 Overview of the BIIIG framework. . . 81 5.2 Example unified metadata graph with associated relational database. 83 5.3 Example unified metadata graph with metadata from multiple sources.
Vertices represent classes and edges represent relationship types. Gray vertices represent master data classes. Dashed rectangles represent source boundaries and correspond to thedsproperties of vertices. . . 92 5.4 Example integrated instance graph with data from multiple sources.
Vertices represent data objects and edges represent relationships. Gray vertices represent master data. Dashed rectangles represent source boundaries and correspond to the prefix of sidproperties of vertices. The instance graph was generated based on the unified metadata graph shown by Figure 5.3 . . . 93 5.5 Example instance graph of Figure 5.4 after vertex fusion. . . 94 5.6 Example of the relationship integration problem. . . 96 5.7 Visualization (Gephi [224]) of the integrated instance graph extracted
from a dataset that was created by the real-world business information systems ERPNext. . . 100 5.8 Visualization (Neo4j frontend [232]) of a business transaction graph
extracted from a dataset created by the FoodBroker data generator. . 101 5.9 Visualization (Gephi [224]) of a business transaction graph extracted
from a dataset created by a real-world business information system. Zoom factor is to low to render labels. . . 102 5.10 Clipped view on the graph of Figure 5.9 with a higher zoom factor
(Gephi [224]). Black vertices show master data and gray vertices show transaction data. The displayed label is the class property of transac-tion data and a manually chosen business identifier for master data. . 103 6.1 Example illustrations for a collection of labeled graphs, a subgraph
(gray background), a frequent pattern lattice and embeddings. The values attached to vertices and edges representid:labelpairs . . . 107 6.2 Pattern lattice search strategies. Bullets represent patterns and lines
represent parent-child relationships where parents are shown above children. Red lines are those actually processed by the particular search strategy. . . 109
6.3 Dataset element representing graph g3, pattern p21 and embedding
mapµ(g3, p21)of Figure 6.1. . . 122
6.4 Illustration of our couterexample showing two graphsg1, g2. Each one contains a3-edge subgraph with automorphisms (black lines) and an extension to a4-edge subgraph (red lines). Roman numbers are vertex identifiers. . . 127
6.5 Example graph of Gradoop’s predictable transactions graph genera-tor. Colored rectangles represent subgraphs and their guaranteed sup-port. . . 130
6.6 Scalability for varying input size. . . 131
6.7 Scalability for varying result size. . . 132
6.8 Horizontal scalability for varying cluster sizes. . . 133
7.1 Example multidimensional subgraph and patterns. . . 136
7.2 Path-substitution method: Taxonomy paths are represented by dedi-cated vertices and edges (blue lines). . . 137
7.3 Example taxonomies of Figures 7.1 and 7.2. Bold fonts highlight dummy roots. . . 138
7.4 Comparison of taxonomy path representations in frequent graph pat-terns. The gray filled vertex can be assigned to a taxonomy path. Red color indicates infrequent parts of a pattern. . . 141
7.5 Generalization search lattice for a 2-dimensional example vector set L = {(111,2111),(111,2112),(112,2112)}. Common prefixes indi-cate label generalizations (e.g., 11 <T 112). Edges represent vector generalization from bottom to top. . . 143
7.6 Bottom-up search in the example lattice of Figure 7.5. Edge labels cor-respond toumin of Algorithm 7.1. Red lines indicate paths that have been traversed unnecessarily atφmin = 3. . . 144
7.7 Top-down search in the example lattice of Figure 7.5. Edge labels cor-respond toumin of Algorithm 7.2. Gray lines indicate pruned paths at φmin = 3. . . 147
7.8 GM-FSM evaluation results for variable minimum support threshold φminand a fixed maximum edge countkmax = 6. . . 150
7.9 GM-FSM evaluation results for fixed minimum support thresholdφmin = 0.2and a variable maximum edge countkmax. . . 152
List of Tables
2.1 Glossary of symbols part 1 (greek letters) . . . 25 2.2 Glossary of symbols part 2 (further symbols) . . . 26 2.3 Selected Unary Transformations. I represents the input andO
repre-sents the output data set.A..Dare distinct data spaces andW is a set
of worker threads. . . 34 2.4 Comparison of Graph database systems. . . 38 2.5 Citation count of FSM algorithms on Google Scholar (June 2018). . . 50 3.1 Examples transaction data classes, master data classes, measures and
dimensions of different business processes. . . 58 4.1 Operators supported by Gradoop at the time of May 2018. . . 68 4.2 FoodBroker Configuration Parameters . . . 77 4.3 Measures of FoodBroker datasets for different scale factors (SF) . . . . 78 6.1 Methodical comparison of DIMSpan and approaches based on
MapRe-duce. . . 123 6.2 Cost comparison of DIMSpan and approaches based on MapReduce. . 126 6.3 Embeddings and DFS codes during the pattern growth from 3-edge
subgraphs (black lines) to4-edge subgraphs (red lines) in the graphs of Figure 6.4. . . 128
List of Algorithms
5.1 Relational Metadata Acquisition (Part I - Classes) . . . 86
5.2 Relational Metadata Acquisition (Part II - Relationship Types) . . 87
5.3 MethodaddRelationshipType . . . 88
5.4 Automated Graph Transformation . . . 89
5.5 Vertex Fusion . . . 95
5.6 Business Transaction Graph Isolation . . . 97
6.1 A priori (BFS) approach to frequent subgraph mining . . . 110
6.2 Pattern growth (DFS) approach to frequent subgraph mining . . . 112
6.3 Level-wise pattern growth (LDFS) approach to FSM . . . 116
6.4 DIMSpan dataflow. . . 117
6.5 Pattern growth map function . . . 120
7.1 Bottom-up search GFVM . . . 145
Chapter 1
Introduction
To make good decisions, enterprises have a permanent desire to understand the reasons for success or failure of their business. Nowadays, enterprises use soft-ware systems to support this task, so-called decision support systems (DSS)[151]. A popular class of these systems,data-driven DSS, analyze data that is available in databases to extract information relevant to decision-making. Databases are typi-cally used to store domain objects, for example, a trade company stores customer and sales order data. Additionally, databases store relationships among domain objects, for example, for each order there is a relationship to the ordering cus-tomer. Today, the dominating data models of data-driven DSS are the relational data model [37] and its descendants that are tailored to analytical applications, for example, data warehouse models [61]. In fact, DSS data models were not changed in the last two decades.
The present dissertation examines to which extend the application of a graph data model can be useful to support decision-making. The remainder of the cur-rent chapter offers the reader a basic introduction to graph database models and graph data mining (Section 1.1) and will motivate the research goal (Section 1.2). Further on, it will state the dissertation’s contributions including related publica-tions (Section 1.3) and end with an overview of the dissertation’s structure (Section 1.4).
1.1
Relational Data vs. Graph Data
The major difference between relational and graph databases is the handling of relationships. In the relational model, all data is stored in tables (relations). Figure 1.2a shows a relational database that stores data of a trade company such as sales orders, customers or products. Basically, there is one table for each class of data objects (e.g., Customer) and every row describes a single instance. The columns of a table represent attributes (e.g.,Customer.name). All values of a column have the same data type. Further on, there arekeysto mark attributes to represent identity or relationship information.
SalesOrder column type PK country varchar 1 id int 2 created date campaign_id int created_by_id int customer_id int revenue decimal
foreign key columns target
campaign [campaign_id] Campaign createdBy [created_by_id] Employee customer [country, customer_id] Customer
Campaign column type PK id int 1 name varchar Employee column type PK id int 1 name varchar team varchar Customer column type PK country varchar 1 id int 2 name varchar contact_id int
foreign key columns target
contact [contact_id] Employee contains column type PK country varchar order_id int product_id int quantity int
foreign key columns target
order [country, order_id] SalesOrder product [product_id] Product
Product
column type PK
id int 1 name varchar
Figure 1.1: Schema (Metadata) of a relational database: Every rectangle represents a
ta-ble definition including the tata-ble name (e.g. SalesOrder) and all columns,
their data type and primary key position (PK). Further on, each table contains
SalesOrder
country id created campaign_id created_by_id customer_id revenue
UK 1 2018-01-02 1 2 1 1,000.00 UK 2 2018-01-03 NULL 2 1 500.00 Campaign id name 1 Eat apples! Employee id name team 1 Alice Sales 2 Bob Sales Customer
country id name contact_id
UK 1 ACME 1 contains
country order_id product_id quantity
UK 1 1 10 UK 1 2 10 UK 2 2 20 Product id name 1 Apples 2 Pears
(a)Sample relational database with the schema of Figure 1.1: Every rectangle represents a
table with sample data.
(b)Sample graph database with the same data as the relational database of Figure 1.2a.
Circles represent vertices with global identifiers and their connections represent edges. Arrowheads indicate an edge’s direction. Classes, relationship types and attributes are shown by key-value pairs close to vertices and edges (property graph model). Primary keys of the relational database were not taken over.
For each relational database, there is aschemathat describes all tables in terms of columns and keys. Figure 1.1 shows the schema for the database of Figure 1.2a. For each table there may be aprimary keywhose values identify objects. Primary keys may consist of one or more columns and any distinct combination of their values is unique per table, for example, according to Figure 1.2a a SalesOrder is identified by a hcountry_id,idipair. Further on, there are foreign keys whose values reference primary keys, for example, to store a customer reference for each sales order. Our example shows two possible constellations of foreign keys:
For relationship types where one party can be referenced only once, e.g., the employee who created a sales order, foreign keys are part of the referencing row. For example, values ofSalesOrder.created_by_idreference values ofEmployee.id. This constellation is calledone-to-many (1:n)since one employee may create multi-ple sales orders but every sales order was created by exactly one employee. Besides this, there is the so-calledmany-to-many (m:n) constellation. Here, both parties may be involved arbitrarily often. For example, the same product may be contained in multiple orders and vice versa. To store instances of this relationship type a ded-icated table is required (e.g., contains). Further on, since relationships may also have attributes these tables may have additional columns (e.g,contains.quantity). In a relational database relationships are implicit, i.e., the schema must be eval-uated to decide whether a table represents a class of objects or a relationship type and whether a column stores basic attributes or keys. By contrast, in a graph database, relationships are explicit, so-calledfirst-level citizen. Figure 1.2b shows the same data as Figure 1.2a in a graph format. Among different graph models [6], we choose theproperty graph model [157] for our running example due to its wide acceptance in both industry and academia [87]. In this model, domain objects are represented byverticesand relationships are represented byedges. Attributes may be attached to vertices and edges in the form of key-value pairs called proper-ties. Typically, there are no constraints among property keys, property values and possible relationships, i.e., there is no schema.
The major advantage of graph databases over relational ones are additional query capabilities. A basic graph query operation is traversing. For example, a neighborhood traversal allows to access vertices that have a common edge with a given start vertex. An equivalent relational solution would require full schema knowledge to create a single query for every possible foreign key. While traversing a graph database leads to homogeneous results, for example, a collection of vertices or subgraphs, the relational pendant leads to one result per queried foreign key. If neighbor vertices are originated from different tables, they cannot be represented in a single result table due to different attributes and primary key spaces. The problem intensifies in the case of multi-hop traversals since every combination of
SalesOrder
pattern_id id created_by_id customer_id
1 1 1 1 2 1 1 1 3 1 NULL NULL Employee pattern_id id team 1 1 Sales 1 2 Sales 2 1 Sales Customer
pattern_id id country mainContact_id
1 1 UK 2 2 1 UK 1 contains
pattern_id order_id product_id
3 1 1
Product
pattern_id id name
3 1 Apples
(a)Patterns of Figure 1.3b in relational representation. Numbers above patters in Figure
1.3b correspond topattern_idcolumns. All primary and foreign keys includepattern_id
columns, e.g.,SalesOrder.hpattern_id, customer_idireferencesCustomer.hpattern_id, idi.
(b)Collection of three graph patterns. Dotted lines represent pattern boundaries. Patterns
1 and 2 represent sales orders placed by a customer from the UK. In both patterns, the orders were created by employees of the sales team. Further on, in both cases customers have a contact persons from the sales team. However, in pattern 2 the sales order was created by the contact person, too, while the employees were distinct in pattern 1. Pattern 3 shows a sales order that contains apples.
Figure 1.3: Comparison of a pattern mining result in graph and relational representation.
The traversal operation already clarifies the advantage of explicit relationships and schema-freedom for exploratory queries. Another similar yet powerful op-eration is graph pattern matching [52]. This technique enables a user to identify subgraphs that are equal or similar to a given pattern. The other way around, graph models also allow the extraction of patterns. For example, an analyst may be interested in frequent relationship patterns of lossy sales orders. A solution based on a relational database is facing the same problems as those of traversal queries since relational patterns across tables must be determined by querying all possible schema fragments [46] and represented in multiple tables.
Let’s take the example of a not further explained algorithm that returns 3 pat-terns of interest from a database with the schema of Figure 1.1. Let it be assumed that these patterns are heterogeneous with regard to quantity and structure of re-lationships. Figure 1.3 shows such patterns in both multi-relational (Figure 1.3a) and graph (Figure 1.3b) representations. The most obvious difference of both rep-resentations is the main criterion of data organization. While in Figure 1.3b every pattern is represented by a single graph and all results form a graph collection, in Figure 1.3a patterns are fragmented within a single set of tables. These tables are derived from the schema of Figure 1.1. More precisely, these tables cover all columns of all tables that match at least one pattern’s data. Additionally, all pri-mary keys have an additional pattern id component (e.g.,Customer.pattern_id).
The obvious advantage of graphs for this scenario is a more intuitive result representation. The graph representation clearly shows the semantic meaning as well as the differences between the three patterns while the relational represen-tation requires further interprerepresen-tation. Besides the patterns-centric data organiza-tion graphs also directly show the difference between cyclic and acyclic relaorganiza-tion- relation-ship patterns (e.g., patterns 1 vs. pattern 2) due to the fact that relationrelation-ships are first-level citizen. Further on, graph patterns show no absence of possible objects and relationships (e.g.,NULL values inSalesOrder.customer_id). Especially for highly heterogeneous results, a relational representation might be confusing due to a dominance of NULLvalues.
However, these advantages are not solely an issue of result representation. Even data mining algorithms can already take advantage of schema freedom, ex-plicit persistence of relationships and cycle detection, for example, the extraction on frequent patterns [1]. The most famous approach for relational data is frequent itemset mining [2] also known as shopping basket analysis. This approach de-termines frequent patterns of coexisting attribute values but completely ignores relationship structure. More elaborate approaches such as multi-relational mining [46] consider patterns across multiple tables but provide no mechanism to handle cyclic relationships. However, there are efficient graph-based algorithms that al-low the extraction of patterns that include not only attributes but also arbitrary relationship structures [82].
1.2
Graphs for Business Intelligence
The research goal of this dissertation is a framework that enables decision-makers to benefit from the flexibility of graph-based data representation and from the novel capabilities of graph mining algorithms. Therefore, we started the devel-opment ofBIIIG (Business Intelligence with Integrated Instance Graphs). BIIIG is a conceptual framework of a graph-based data-driven DSS [141]. We have chosen Business intelligence (BI)as an umbrella term that covers all technologies required by a respective system [33]. BIIIG provides solutions to different problems:
First, BIIIG should support the holistic analysis of data from multiple sources with arbitrary structures, e.g., data from relational databases or from web services that serve formats such as JSON and XML. Thus, BIIIG uses the property graph model which is very suitable for this task. Domain data objects are transformed into vertices, all relationships among them are reflected by edges and all attributes are directly attached to vertices and edges in form of properties. Further on, there is a data integration [107] strategy. For example, it is possible to add edges between vertices that represent the same conceptual entity (sameAs). Such edges can be added either on the instance level (object matching [99]) or on the schema level and either by an expert or by automated approaches [155]. Since these relationships are materialized by edges in a single graph, they can be used to analyze data across sources or to fuse vertices that correspond to each other.
BIIIG shall further allow the evaluation of patterns in a context, for example, patterns that occur frequently together with sales orders that lead to financial loss. Therefore, some established concepts from data warehousing [96] were adopted to the graph model. In a data warehouse measures of facts are evaluated by dimen-sional values. Afactis typically a tuple that represents a business transaction (e.g., a sales order) and whose fields are either measure values (e.g., profit) or foreign keys to dimensions (e.g., customers or products). Thus, it is possible to aggre-gate measures by dimensional values (e.g. total profit by customer country). BIIIG transfers those concepts to a graph model. To preserve relationship information BIIIG’s facts are not tuples but graphs that represent, for example, a well defined neighborhood of sales order vertices. For the application domain of business in-formation systems BIIIG even includes an algorithm to automatically extract such fact graphs calledbusiness transaction graphs (BTGs)[141].
Figure 1.4 shows an example collection of two BTGs. Both, dimensional values (normal font properties) and measure values (bold font properties) are attached to the graph structure. Common dimensional values of multiple graphs are reflected by shared vertices (e.g. apples). Since there is no schema, not only the actual property values (e.g.,name: Apples) but also semantic information are considered as dimensional values (e.g., type: containsandclass: Product). Further on, there
Figure 1.4: Example graph collection with shared vertices. Dotted lines represent graph
boundaries. Solid rectangles overlaying the graphs’ boundaries contain graph properties. Bold properties contain measure values and normal font ones di-mensional values.
are aggregated measures (e.g., result: 1,000) attached to graphs1. These so-called
graph measuresallow filtering and categorizing graphs, for example, to select only lossy graphs. In consequence, a suitable graph model must support multiple graphs as first-level-citizen as well as collections of those. Further on, graphs must support properties. The existing property graph model lacks these concepts.
Before BIIIG, there was neither an academic graph database model [9] nor a productive graph database [87] with support for multiple attributed graphs (graph collections) and graph attributes. Because of this situation, we developed a new graph database model calledExtendend Property Graph Model (EPGM). As the name already implies, it is an extension to the existing property graph model [157]. In particular, its data structure adds support for graph collections and graph prop-erties, so-called property graph collections. Beyond meeting the requirements of BIIIG, EPGM includes a set of operators that were majorly developed by Martin Junghanns in the context of the Gradoop framework [89]. Gradoop is a system for declarative graph analytics based on the distributed dataflow system Apache Flink [30].
To extract knowledge from property graph collections the determination of 1The measure of our example is calculated by
Figure 1.5: Example Taxonomy of dimensionEmployee.
pattern frequencies is a crucial primitive. With regard to graphs, this process is called frequent subgraph mining (FSM) [82]. A number of efficient FSM algo-rithms were developed in the 2000s [130, 190]. However, these algoalgo-rithms were only applied to a single use case: chemical compounds. In graphs that represent compounds vertices reflect atoms and edges their bonds. However, chemical com-pounds and business information data show two fundamental differences: First, relationships in business data are mostly directed, i.e., there is a semantic differ-ence between A references B and vice versa. In compounds, bonds have no di-rection. Second, business data may contain multiple relationships between two distinct entities. For example, the bottom graph of Figure 1.4 contains a pair of parallel edges that is expressing that employee Alice aquired and created a sales order. A graph with support for parallel edges is calledmultigraph. In compounds, any pair of atoms can only be connected by exactly one bond.
To the best of our knowledge, prior to BIIIG there was no frequent subgraph algorithm that was capable to extract patterns from directed multigraphs. To make a respective algorithm available, we followed a straightforward approach and ex-tended existing techniques. However, the bare extraction of frequent patterns is still not sufficient to answer complex questions relevant to decision support. Thus, BIIIG includes further algorithmic and technical extensions. From the technical point of view, we proposed an efficient parallelization under consideration of the constraints of shared nothing clusters, i.e., following abring the computation to the dataapproach. With this approach, FSM can also be applied to Big Data scenarios. An important algorithmic aspect of frequent pattern mining refers to dimen-sional taxonomies. In a data warehouse [96] based on the multidimendimen-sional model, a special variant of the relational model, measures are associated to multiple di-mensions. For example, sales can be evaluated by customer and employee informa-tion (2 dimensions). For some dimensions, the finest granularity (e.g., an employee with nameAlice) can be attached to ataxonomyas shown by Figure 1.5. By the use of taxonomies the granularity of single dimensions can be generalized, for
exam-Figure 1.6:Example generalization of a graph pattern.
ple, to calculate the total revenue of all sales people instead of the one of Alice. The generalization of dimensional values has already been applied to frequent itemset mining [67]. For example, the pattern {bread,butter} could be infrequent while
the more general one{bakery product,milk product}is frequent.
Generalization has also already been applied to graphs (chemical compounds) [76], but without support for directed multigraphs and under the assumption that all vertices belong to the same dimension. However, the data of most applica-tions involves multiple dimensions, for example, to find out that{bread,butter}is
mostly bought in themorninginsuburban stores. With BIIIG, we enabled general-ized subgraph mining with support for multiple dimensions. Therefore, dedicated vertex properties are attached to taxonomies and generalized during the mining process [145]. For example, the left graph of Figure 1.6 shows a pattern with four dimensions while the right graph shows one example of its generalizations at dif-ferent levels for each dimension. In particular, it shows that Alice sold apples to Germany.
The remainder of the present dissertation will discuss the contributions of BI-IIG in more detail. Although there is no software system that includes all BIBI-IIG components yet, there are prototypes and experimental evaluations for all of its building blocks. Most of the prototypes were turned into Open Source software and made available to the public. Due to the limited availability of real word busi-ness data, most evaluation were done using synthetic data. Therefore, a dedicated data generator based on business process simulation [142] was developed. How-ever, parts of BIIIG have been evaluated in real-world scenarios in cooperation with Siemens AG and Immowelt AG.
1.3
Contributions and Publications
This section provides an overview of the contributions made in the context of this dissertation. All of them were peer-reviewed and published in journals or pro-ceedings of conferences and workshops. Additionally, a summary of most contri-butions was presented on the VLDB 2017 PhD workshop [138].
Comparison of recent graph database systems: Before the development of
BIIIG started, both academic and commercial graph database systems were sys-tematically compared with regard to their suitability. In chapter two of Manage-ment and Analysis of Big Graph Data: Current Systems and Open Challenges [87], published in 2017, we provide an in-depth comparison of their data models and analytical capabilities.
Graph-based Data Transformation and Integration: Although a typical
com-pany’s business data implicitly describes a graph it is usually stored in business in-formation systems based on relational databases. Further on, companies often use multiple of these systems and there are implicit cross-system relationships. To the best of our knowledge, we proposed the first semi-automated approach to trans-form data from multiple relational databases into a single graph whose vertices represent domain objects and whose edges represent their mutual relationships.
We further proposed a graph-based approach to data integration. The process is executed after the transformation and consists of two steps. First, correspon-dence edges among vertices of different graphs are added and, second, clusters of vertices that correspond to each other are fused into a single vertex. The ap-proach was initially proposed on the GDM 2014 workshop and published within the ICDM 2014 workshop proceedings [141]. Further on, an initial prototype was demonstrated on the VLDB 2014 conference [143].
Collections of Property Graphs: In established data mining approaches
in-terrelated input data is mostly represented by tuples of measure values and di-mension values. In the context of graphs these values must be attached to the graph structure and aggregated measure values are graph attributes. Since the lat-ter was not supported by any existing model, we proposed the use ofcollections of property graphs. They act as data structure of the novelExtended Property Graph Model (EPGM). The model supports vertices and edges that may appear in different graphs as well as graph properties. Further on, we proposed some operators that benefit from this data structure, for example, graph-based aggregation of measure values. The initial idea was already presented on the GDM 2014 workshop [141]. A more elaborate introduction to the concept of EPGM appeared on the NDA 2016 workshop, co-located with the SIGMOD 2016 conference [89].
FoodBroker Data Generator: Since real business data is not available to the
public, we designed a simulation-based generator for data that shows the charac-teristics of data from business information systems. The structure of FoodBroker graphs is based on a statistical model and contains correlations between single vertices and the surrounding graph structure. Thus, it can be used in experimental evaluations of analytical techniques. FoodBroker was initally| published within the proceedings of the WBDB 2014 workshop [142].
Frequent Pattern Mining for Directed Multigraphs: An primitive operation
of graph pattern mining is frequent subgraph mining (FSM). However, existing al-gorithms provided neither support for directed graphs nor those containing multi-ple edges between a pair of vertices. With the development ofDirected Multigraph gSpan (DMGSpan), a respective extension of the popular gSpan algorithm [196], we proposed an algorithm without these limitations. The extension of gSpan to support directed multigraph was initially published in the context of a Gradoop Demonstration on the ICDM 2016 conference [140].
Distributed Frequent Subgraph Mining: Parts of this work were done in the
context of Gradoop, a framework for distributed graph analytics [85]. To make the primitive operation of frequent subgraph mining available to this framework, we developedDistributed In-Memory gSpan (DIMSpan), a variant of DMGSpan tailored to characteristics of shared-nothing clusters and distributed in-memory dataflow systems. Details about DIMSpan were published in the proceedings of the BDCAT 2017 conference [144].
Generalized Frequent Subgraph Mining: Some patterns might not be
fre-quent while their generalizations are. Generalized graph patterns can be mined by attaching vertices to taxonomies. We proposed a novel approach to General-ized Multidimensional Frequent Subgraph Mining (GM-FSM), in particular the first solution to generalized FSM that supports not only directed multigraphs but also multiple dimensional taxonomies. The work was presented on the ICDIM 2017 conference [145].
Characteristic Subgraph Mining (CSM): In scenarios that compare patterns
of different categories, e.g., fraud or not, FSM is not sufficient since pattern fre-quencies may differ by category. Further on, determining all pattern frefre-quencies without frequency pruning is not an option due to the computational complexity of FSM. Thus, we developed an FSM extension to extract patterns that are charac-teristic for a specific category according to a user-defined interestingness function. The method was already described and published in journal article that appeared in 2016 init - information technology [139].
Open Source Implementations: All data mining algorithms developed during
the research that lead to this dissertation are available as Open Source software. Thread-parallel implementations of DMGSpan, GM-FSM and CSM based on both algorithms are available as part ofDirected Multigraph Miner2. DIMSpan and Food-Broker are part of the Gradoop3framework. Further on, there is a single-machine
version of FoodBroker4.
1.4
Structure of Dissertation
The remainder of this dissertation consists of the following seven chapters:
Chapter 2 provides the reader with background knowledge relevant to this
dis-sertation. It starts with a formal introduction of all graph structures mentioned and used in the remainder of this work. Afterwards, it will provide a technical intro-duction into different relevant software systems such as recent graph databases. Finally, there will be a discussion of related work in the fields of relational-to-graph data transformation, relational-to-graph-based data warehousing, relational-to-graph pattern mining and graph data generators.
Chapter 3 will introduce our analytical framework, in particular its basic
con-cepts and all relevant terminology such as measures, dimensions and business transaction graphs. It will further present an analytical method that is capable to extract patterns that correlate with business measures, called characteristic sub-graph mining. We will use the method together with an example scenario to fur-ther motivate BIIIG’s application and list the requirements that lead to BIIIG’s de-velopment.
Chapter 4 will study the Extended Property Graph Model (EPGM) which
sup-ports BIIIG’s data model requirements such as the representation of business trans-action graphs as well as all relevant operations. It will also take a look at Food-Broker, a data generator for data that contains business transaction graphs, and Gradoop, the first system that implements EPGM.
Chapter 5 is dedicated to graph-based transformation and integration of
busi-ness data, the foundation of the BIIIG approach. After an introduction of its spe-cific data model, all relevant techniques will be discussed in more detail. Finally, the results of an experimental evaluation with data originated from a real business information system will be presented.
2https://github.com/p3et/dmgm
3https://github.com/dbs-leipzig/gradoop 4https://github.com/dbs-leipzig/foodbroker
Chapter 6 studies the core problem of frequent subgraph mining (FSM). After
a review of existing methods we will discuss our extensions to support directed multigraphs. Additionally, we will discuss the parallelization of FSM in the con-text of multi-core CPUs and in particular distributed dataflow frameworks for Big Data processing. Due to their programming paradigms both approaches to paral-lelization differ fundamentally. Finally, results of an experimental evaluation will show the scalability of our approach.
Chapter 7 studies the problem of generalized frequent subgraph mining.
Mul-tiple approaches to solve this problem will be introduced and discussed. The most elaborate algorithm decomposes the problem into frequent subgraph mining of most relevant generalizations and mines all frequent specializations by a less costly approach to vector mining. The results of an experimental evaluation will confirm the effectiveness of this approach.
Chapter 8 concludes the dissertation. First, the results of use case evaluations in
cooperation with a large scale enterprise will be presented. This includes a report of practical experiences gained in implementation and application of the proposed algorithms. Finally, after a summary of the previous chapters it will name open research questions based on the outcomes of this dissertation.
Chapter 2
Background and Related Work
This chapter will provide background knowledge that will be useful to understand the remainder of this dissertation. Further on, it will discuss related work.
We will start with an overview of graph data structures (Section 2.1) and, due to to their importance, a detailed comparison of the two most popular graph models (Section 2.2). Nowadays, business intelligence is often related to Big Data tech-nologies. Thus, we will provide an introduction to the programming model of dis-tributed dataflow systems (Section 2.3). Since this dissertation is about graphs, we will also discuss recent graph-related software systems and their analytical capa-bilities. Due to their fundamental differences, we will do this separately for graph processing systems (Section 2.4) and graph database systems (Section 2.5).
Since BIIIG includes multiple aspects of business intelligence we will also study different fields of related work. The first one is graph-based data transformation and integration (Section 2.6.2). Afterwards, we will study two fields related to data analytics, in particular graph-based OLAP (Section 2.7) and graph pattern mining (Section 2.8). Since we also developed a data generator, we will also cover this field (Section 2.9).
2.1
Graph Data Structures
In this section, all characteristics of graph structures mentioned or used in the remainder of this dissertation will be precisely defined. We will use a common formalism of elements, sets of these and functions. This may appear unfamiliar to some readers as it differs from established formalisms for specific structures. However, the formalism was chosen to ensure comparability and to facilitate un-derstanding of more complex definitions later on in this dissertation. Tables 2.1 and 2.2 provide a glossary of all used symbols.
Basically, a graph [44] is a set of identifiers (vertices) and connections among them (edges). In a simple graph edges have no explicit identifier. Figure 2.1a shows an undirected simple graph.
Symbol Meaning Examples
α undirected adjacency α(v1) ={v2, v3} αo outgoing adjacency αo(v1) = {v2, v3} αi incoming adjacency αi(v1) ={v2, v3} β bottom level label β(Employee) =f alse
Γk
f Graph aggregation operator C
0 = ΓvertexCount |Vg| (C)
γ graph containment γ(v) ={g1, g2} ε empty element (NULL) π(v,age) =ε ζ vertex taxonomy association ζ(v) =T
η label parent η(Employee.Alice) = Employee
ιv/ιe vertex / edge bijection ιv :{v1, v2} ↔ {v3, v4} κ edge time bijection κ(2) =e
Λ label property key π(v,Λ) =User,π(e,Λ) =friendOf
λ labeling function λ(v) = User,λ(e) =friendOf
µ embedding map µ(g, p)7→ {m1, m2} ν vertex time bijection ν(2) =v
Πf Property transformation op. C0 = Π∀v∈V.π0(v,label)=π(x,name)(C)
π property function π(v,age) = 42,π(e,weight) = 0.7
ρ taxonomy path function ρ(A.A.B) = {A,A.A,A.A.B}
Σf Graph selection operator C0 = Σπ(g,vertexCount)≥3(C) ς source of an edge ς(e) =v
τ target of an edge τ(e) = v φ absolute support φ(G, p) = 42
φrel relative support φrel(G, p) = 0.7 φmin minimum support threshold φmin = 42 φrel
min rel. min. support threshold φrelmin = 0.7
ψ hyperedge function ψ(e) ={v1, v2, v3}
Ω EPGM Operator C0 = Ω(C)
ω top level label ω(Employee) = true
Symbol Meaning Examples
Ab element of heterogeneous tuple g =hVg, Egi C property graph collection see Chapter 4
d/D property value / set of D={”Alice”,42, true}
e/E edge / set of E ={e1, e2, . . . , en} g/G graph / set (collection) of G={g1, g2, . . . , gn} k/K edge discovery time / set of K ={1,2,3,4}
`/L/L label / set of / space of L={User,friendOf}
~
`/L vector / set of see Definition 7.11
<T label generalization Employee<T Employee.Alice <T graph generalization g1 <T g2
~
<T vector generalization ~`1<~T~`2
m embedding see Definition 6.5
p pattern p's=true
' isomorphism relationship p's=true
s subgraph svg =true
v subgraph relationship svg =true
•
v child of (graph) cv• p=true
T /T/T taxonomy / set of / space of see Definition 7.1
t time t = 5s
v/V vertex / set of V ={v1, v2, . . . , vn}
v path v =hv1, v3, v4, v2i
x DFS extension x=h0,1,from, true,edge,toi
X DFS Code X =hx1, . . . , xni
u/U vertex discovery time / set of U ={1,2,3,4}
y/Y property key / set of Y ={age,weight,Λ}
(a)Undirected Simple Graph (b)Directed Simple Graph
(c)Directed Multigraph
Figure 2.1: Graph structures with different edge characteristics.
Definition 2.1 (Undirected Simple Graph) An undirected simple graph is
de-fined as a pair g = hV, αiof a vertex setV = {v1, v2, . . . , vn}and an adjacency functionα:V → P(V)that connects a subset of other vertices to every vertex s.t.
v /∈α(v)andv1, v2 ∈V.
v1 ∈α(v2)⇔v2 ∈α(v1)
. Thus, an edge can implicitly be defined as a 2-element set of vertices{v1, v2 |v2 ∈α(v1)}.
Depending on the semantic meaning of vertices and edges, simple undirected graphs can be used to represent data of different scenarios. For example, for a social network vertices may represent user identifiers and edges may represent their mutual friendships. However, there are also scenarios where an edge has a different meaning depending on its direction. A graph structure that distinguishes between the start point (source) and end point (target) of an edge is denoted by the attributedirected[44]. Figure 2.1b shows a directed simple graph.
Definition 2.2 (Directed Simple Graph) A directed simple graph is defined as
a triple g = hV, αo, αii which, in contrast to a undirected graph, contains two separate adjacency functions describing outgoingαo : V → P(V)and incoming connectionsαi :V → P(V)s.t.v /∈αo(v);v /∈αi(v)and
v1, v2 ∈ V.
v1 ∈ αo(v2) ⇔ v2 ∈ αi(v1)
. Thus, an edge can be considered as a pairhv1, v2 |v2 ∈αo(v1)∧v1 ∈ι(v2)i.
Besides edge direction, the quantity of edges between a pair of vertices may carry semantics, for example, different roads (edges) may connect the same pair of cities (vertices) in a road network. So-called multigraphs[44] support an arbi-trary number of edges between any pair of vertices as well as connecting a vertex with itself. Edges of the latter type are called loop. Figure 2.1c shows a directed multigraph including a loop and a pair of parallel edges.
Definition 2.3 (Directed Multigraph) A directed multigraph is defined as a
quadru-ple g = hV, E, ς, τi of vertex identifiers V = {v1, v2, . . . , vn} , edge identifiers E ={e1, e2, . . . , em}as well as two functions mapping a source vertexς :E →V
(a)Labeled Directed Graph (b)Property Graph
(c)RDF Triple Graph
Figure 2.2:Graph structures with different attached data formats.
A further way of adding semantics to a graph is attaching data values to ver-tices and edges. The simplest form of data values are so-calledlabels. Figure 2.1b shows a labeled graph where vertex labels represent cities and edge labels express a weight (minimal train connection time in minutes).
Definition 2.4 (Labeled Directed Multigraph) A labeled directed multigraph
is defined as a sextuple g = hV, E, ς, τ, L, λi containing, in addition to
Defini-tion 2.3, a set of labels L = {`1, `2, . . . , `n} and a function λ : (V ∪E) → L assigning a label to every vertex and edge.
Labels can be used to distinguish types, e.g., users and groups in a social net-work, or to add specific data values, e.g., edge weights. However, especially when graph structures are used as part of database models [9] simple labels are not suf-ficient. Thus, two popular extensions of labeled directed multigraphs arose in this context. The first so-calledproperty graph model [157] supports attaching an ar-bitrary number of key-value pairs to the graph structure. Figure 2.2b shows a property graph whose vertices and edges show different properties.
Definition 2.5 (Property Graph) A property graph is defined as a septupleg =
hV, E, ς, τ, Y, D, πicontaining, in addition to Definition 2.3, a set of property keys
Y ={Λ, y0, y1, . . . , yn}, a set of data valuesD={ε, d0, d1, . . . , dn}and a function π : (V∪E)×Y →Dthat maps a data value to every combination of vertex or edge
and property key. Dcontains the empty valueεto express the nonexistence of a
data value for a given combination. Further on,K may contain a dedicated label
symbol Λwhere∀x ∈ (V ∪E).π(x,Λ) 6= ε s.t. the property graph is implicitly
labeled by a mandatory label property.
Besides property graphs, there is a second graph model that gained wide ac-ceptance and application within the research community. TheResource Description
Framework (RDF) [238] allows the description of graphs by so-calledInternational Resource Identifiers (IRI) as vertices and statements about these as edges. Figure 2.2c shows an example RDF graph. Note, the dotted line does not represent an edge but shall express that every edge label is actually a vertex (IRI).
Definition 2.6 (RDF Triple Graph) A RDF triple graph is defined as a sextuple g = hV, D, E, ς, λo, λpi of a set of IRIs V = {v1, v2, . . . , vn} , a set of literals D ={d1, d2, . . . , dm}and a set of triplesE ={e1, e2, . . . , ep}. Each triple has an assigned subjectς : E → (V ∪E), objectλo : E → V and predicateλp : E → (V ∪D).
With regard to the structural properties introduced in Definitions 2.3 to 2.5, RDF triple graphs are edge-labeled directed multigraphs with two kinds of ver-tices - IRIs and literals. Edge sources correspond to subjects and edge targets to objects. However, the model additionally supports edges whose sources are edges. While literals correspond to data values of property graphs, IRIs represent not only vertices but also edge labels. Thus, there is no distinction between these two concepts on the structural level. Properties are expressed by edges with a literal predicate. To support collections of RDF triple graphs, there is a extension called N-quads [239]:
Definition 2.7 (RDF N-quad Graph Collection) A RDF N-quad graph
collec-tion is defined as a septupleg = hV, D, E, ς, λo, λp, γicontaining, in addition to Definition 2.6, an additional graph containment functionγ :E →V mapping
ev-ery edge to a single IRI. Because of this fourth function, edgesEare called quads
instead of triples.
In comparison to property graph collections according to Definition 4.1, RDF collections have no explicit mapping of vertices to graphs and edges are assigned to exactly one graph. Graphs are identified by IRIs and, thus, there is also support for graph properties. Since the same IRI may be subject or object in edges of different graphs, it is possible to represent graphs with overlapping vertices. However, since properties are edges they are only valid in the context of a specific graph.
For the sake of completeness there are two further graph structures worth men-tioning although neither relevant for the remainder o
![Figure 3.1: Example business transaction graphs with aggregated graph measures isClosed and soCount [139] .](https://thumb-us.123doks.com/thumbv2/123dok_us/354333.2538994/66.892.157.744.163.852/figure-example-business-transaction-aggregated-measures-isclosed-socount.webp)