http://wrap.warwick.ac.uk
Original citation:
Herdman, J. A., Gaudin, W. P., Turland, D. and Hammond, Simon D.. (2011)
Benchmarking and modelling of POWER-7, Westmere, BG/P, and GPUs : an industry
case study. ACM SIGMETRICS Performance Evaluation Review, Volume 38 (Number
4). pp. 16-22. ISSN 0163-5999
Permanent WRAP url:
http://wrap.warwick.ac.uk/45668
Copyright and reuse:
The Warwick Research Archive Portal (WRAP) makes this work by researchers of the
University of Warwick available open access under the following conditions. Copyright ©
and all moral rights to the version of the paper presented here belong to the individual
author(s) and/or other copyright owners. To the extent reasonable and practicable the
material made available in WRAP has been checked for eligibility before being made
available.
Copies of full items can be used for personal research or study, educational, or not-for
profit purposes without prior permission or charge. Provided that the authors, title and
full bibliographic details are credited, a hyperlink and/or URL is given for the original
metadata page and the content is not changed in any way.
Publisher’s statement:
"© ACM, 2011. This is the author's version of the work. It is posted here by permission of
ACM for your personal use. Not for redistribution. The definitive version was published in
ACM SIGMETRICS Performance Evaluation Review, Volume 38 (Number 4) (2011)
http://dx.doi.org/10.1145/1964218.1964222
"
A note on versions:
The version presented here may differ from the published version or, version of record, if
you wish to cite this item you are advised to consult the publisher’s version. Please see
the ‘permanent WRAP url’ above for details on accessing the published version and note
that access may require a subscription.
Benchmarking and Modelling of POWER-7, Westmere,
BG/P, and GPUs: An Industry Case Study
J.A. Herdman, W.P.Gaudin, D. Turland
High Performance ComputingAWE plc, Aldermaston, UK
[email protected]
S.D. Hammond
Department of Computer Science University of Warwick, Coventry, UK
[email protected]
ABSTRACT
This paper introduces an industry strength, multi-purpose, benchmark: Shamrock. Developed at the Atomic Weapons Establishment (AWE), Shamrock is a two dimensional (2D) structured hydrocode; one of its aims is to assess the impacts of a change in hardware, and (in conjunction with a larger HPC Benchmark Suite) to provide guidance in procurement of future systems.
A suitable test problem is described and executed on a local, high-end, workstation for a range of compilers and MPI implementations. Based on these observations, specific configurations are subsequently built and executed on a se-lection of HPC architectures, including Intel’s Nehalem and Westmere micro architectures, IBM’s 5, POWER-6, POWER-7, BlueGene/L, BlueGene/P, and AMD’s Opter-on chip set. ComparisOpter-ons are made between these architec-tures, for the Shamrock benchmark, and relative compute resources are specified that deliver similar time to solution, along with their associated power budgets.
Additionally, performance comparisons are made for a port of the benchmark to a Nehalem based cluster, accel-erated with Tesla C1060 GPUs, with details of the port, and extrapolations to possible performance of the GPU.
Keywords
Benchmarking, Hydrodynamics, HPC, Distributed, OpenCL, GPU
1.
INTRODUCTION
There are currently a number of High Performance Comput-ing (HPC) architecture options available, or becomComput-ing avail-able, to the high-end HPC application user. Intel’s West-mere, has been available since the beginning of the second quarter of 2010, which, in addition to Nehalem, accounts for 54.6% of all the machines on the current (November 2010) Top500 list [1]. The POWER7 processor is the latest evo-lution of IBM’s long running POWER series. Released in 4Q09 in its server variant, it follows on from the success-ful POWER5 and POWER6 ranges, which account for 18 machines currently on the Top500. Although no POWER7 based HPC system is yet on the Top500 listing, 2011 will see the POWER7 used as the building block for the 10 PetaFlop (PFlop) Blue Waters system at the National Center for Su-percomputing (NCSA) [2]. IBM’s BlueGene architecture’s third generation: BG/Q, will be at the heart of the 1.6 mil-lion core Sequoia platform. Sequoia, a 20 PFlop platform will be based at Lawrence Livermore National Laboratory (LLNL), and is due into production in 2012. This follows the first and second BlueGene generations: BG/L and BG/P,
with ten combined platforms occupying the Top500, which, in conjunction with the Power series, accounts for 8% of the Top500 systems. AMD’s 8- and 12-core fourth generation Opteron processor, ’Magny-Cours’, were introduced to the market in March 2010. In its second, third and forth gener-ations, the Opteron accounts for 11.4% of the Top 500 list, most prevalent being its third generation Barcelona chip in its quad-core form. In addition to these, Graphics Process-ing Units (GPUs) offer a way to build extremely large HPC platforms, with an increased Flops/Watts ratio. GPU accel-erated machines already occupy Number One and Number Four on the November 2010 Top500 List [1], with 11 systems in total being GPU accelerated.
With such a diverse range of heterogeneous architectures coming to the fore, the challenge for HPC practionners is complex. Understanding which hardware is best suited for their application mix involves understanding a range of com-peting problems including application performance, algo-rithm re-coding, effective scheduling and associated running costs (e.g. power and cooling).
This paper introduces an industry strength benchmark: Shamrock. Developed at the Atomic Weapons Establish-ment (AWE), Shamrock is a two dimensional (2D) struc-tured hydrocode. One of its aims is to assess the impacts of a change in hardware, and (in conjunction with a larger HPC Benchmark Suite) to provide guidance in procurement of future systems. The code has been ported to 97.8% of the processor families that make up the Top500 list, and executed on 42% of the exact processor types.
A representive test case and problem size is discussed, and subsequently executed on a high-end workstation for a range of compilers and MPI implementations. Based on these observations, specific configurations are built and ex-ecuted on a selection of HPC processor generations. These include Intel’s Nehalem and Westmere micro-architectures, IBM’s POWER-5, POWER-6, POWER-7, BG/L, BG/P, and AMD’s Opteron chip set. Comparisons are made be-tween these architectures, for the Shamrock benchmark, and relative compute resources are specified that deliver similar time to solution, along with their associated power budgets. Additionally, performance comparisons are made for a port of the benchmark to a Nehalem X5550 based, 100MbE connected, cluster, accelerated with Tesla C1060 GPUs, with details of the port, and extrapolations to possible perfor-mance exploitation of the GPU.
of interest, description of related work, and the uniqueness of the benchmarking and predictions of this study. Sec-tion 3 introduces the performance of the benchmark on a local, high-end, workstation, followed by a discussion of the HPC platforms the code has been ported to. Section 4 looks at the performance characteristics on these HPC platforms, and details the port of the benchmark to a GPU cluster, and its relative performance. Section 5 concludes the paper.
2.
SHAMROCK
Prediction of the dynamic behaviour of materials as they flow under the influence of high pressure and stress is a key field of investigation at AWE. As a result, hydrodynamic simulations account for a large proportion of compute cycles on AWE’s HPC systems. Representative benchmarks have existed for many years: 2D hydrodynamic code fragments were part of the original Livermore Loops [3], and have been used in earlier performance studies [4]. More recently, and primarily, due to the large HPC resources required to exe-cute them, focus has been on three dimensional (3D) bench-marks codes, such as SAGE from LANL [5] and Hydra from AWE [6]. However, although not in the capability regime, 2D hydrodynamics accounts for a significant amount of ca-pacity computing, with finer resolution and growth in the number of CPU hours continually increasing.
To reflect this, Shamrock was developed at AWE as an industry-strength, domain-decomposed, multi purpose bench-mark. It is a 2D structured hydrocode, written predomi-nantly in Fortran 90, using the Message Passing Interface (MPI) as its means of communication between remote do-mains. The code has been designed for a number of pur-poses: (i) assessment of the impact on code performance of system upgrades to an incumbent architecture; (ii) to be run as part of a larger HPC Benchmark Suite to help assess plat-form suitability during a procurement cycle, and (iii) to be used to assess current and emerging technologies. Shamrock can configured to run in Adaptive Mesh Refinement (AMR) and Uniform modes but for the purposes of this paper only Uniform executions are considered.
The benchmarking and predictive modelling in this pa-per differs from earlier studies. It is the first benchmark-ing of the POWER7 platform, usbenchmark-ing a 2D hydrodynamics benchmark; it encompasses the most diverse range of cur-rent architectures, compilers, and MPI invocations for such a benchmark, and is distinct in its comparison of these. There have been a number of studies investigating the use of GPUs as accelerators in the field of 2D hydrodynamics: [7] and [8], and have reported speed-ups of factors of 70 over a single threaded CPU. However, this paper not only looks at speed-ups of the GPU over a single threaded CPU, but makes com-parisons running in an accelerated distributed MPI mode.
A representative, test case for this code is an interacting shock wave simulation. In this problem square inner, mid-dle, and outer regions of ideal gas at differing initial densities and energies cause the inner and outer regions to compress the middle region. This gives rise to shock fronts which collide and send the problem Rayleigh-Taylor unstable.
[image:3.595.316.560.58.318.2]Typical problem sizes are in the range of 300k, to 5M cells; a representative problem of approximately 1.05M cells (1024 x 1024) was chosen as a problem size in the middle of this typical range, and by measuring the time to solution for 10 iteration time steps a workable turnaround time for benchmarking purposes was achieved.
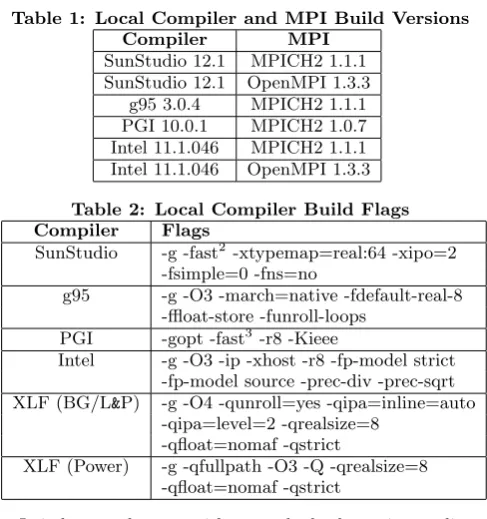
Table 1: Local Compiler and MPI Build Versions
Compiler MPI
SunStudio 12.1 MPICH2 1.1.1 SunStudio 12.1 OpenMPI 1.3.3
g95 3.0.4 MPICH2 1.1.1 PGI 10.0.1 MPICH2 1.0.7 Intel 11.1.046 MPICH2 1.1.1 Intel 11.1.046 OpenMPI 1.3.3
Table 2: Local Compiler Build Flags Compiler Flags
SunStudio -g -fast2 -xtypemap=real:64 -xipo=2 -fsimple=0 -fns=no
g95 -g -O3 -march=native -fdefault-real-8 -ffloat-store -funroll-loops
PGI -gopt -fast3 -r8 -Kieee
Intel -g -O3 -ip -xhost -r8 -fp-model strict -fp-model source -prec-div -prec-sqrt XLF (BG/L&P) -g -O4 -qunroll=yes -qipa=inline=auto
-qipa=level=2 -qrealsize=8 -qfloat=nomaf -qstrict
XLF (Power) -g -qfullpath -O3 -Q -qrealsize=8 -qfloat=nomaf -qstrict
It is known that, as with many hydrodynamics applica-tions, as the cell quantities are updated each timestep, there is not a large amount of data reuse, and hence the code is one that is memory bound, rather than CPU bound.
3.
ARCHITECTURES
Initially the code was developed and tested on a local, high-end, workstation for a range of compilers and MPI imple-mentations. Based on these observations, specific config-urations were subsequently built and executed on a selec-tion of HPC architectures, including Nehalem, Westmere, POWER-5, POWER-6, POWER-7, BG/P, BG/L, and AM-D’s Barcelona. The following section describes these archi-tectures, and observations from benchmarking.
3.1
Initial Benchmarking
An initial performance assessment was carried out on an Intel Xeon E5405 [9], dual socket, quad core desktop work-station. The hardware has a 12MB L2 cache, a 2.00 GHz clock speed, and a Front Side Bus (FSB) speed of 1333 MHz. Four compilers were chosen: Sun’s SunStudio 12.1 [10], Portland Group’s PGI 10.1.0 [11], Intel’s 11.0.073 Com-piler Tookit[12], and GNU’s g95 4.0.3 [13]. For the MPI, two variants: MPICH2 [14] and OpenMPI [15] were chosen, al-though builds were not available for all compiler and MPI permutations. Those that were available, and their respec-tive versions, can be found in Table 1.
The Shamrock build has some self imposed restrictions on compilation options. These are in place to ensure that the results between architectures and compilers are as numeri-cally comparable as possible. A full list of compiler options used in this study is specified in Table 2.
2
With the SunStudio complier, -fast is an alias for the following compiler options: xtarget=native O5 -libmil -fsimple=2 -dalign -xlibmopt -depend=yes -fns ftrap=common pad=local xvector=yes xprefetch=yes -xprefetch-level=2 -nofstore. Those in italics invalidate the IEEE Standard [16] and hence are manually disabled.
3
-Figure 1: Runtimes for Shamrock sodsquare 10242 on Xeon E5405
Figure 2: Xeon E5405 Compiler Memory Footprint
Results from the comparisons are shown in Figure 1. Com-paring the compilers, with the same MPI implementation, the Figure shows that the GNU compiler gives the poorest performance, 83.9% slower than the fastest compiler, the SunStudio, for a single core run. Between these two, the In-tel and PGI compilers are 26.5% and 15.1% slower than the SunStudio respectively. It is expected the discrepancies in compiler performance, are due to how the restrictions, im-posed through the build flags, affect how aggressive a par-ticular compiler is in its level of optimisation. This can be seen if the restrictions are lifted with the Sun and Intel compilers, and their equivalent implementations of Profile-Guided Optimisation (PGO) are enabled. In the case of the Sun compiler, the performance improvements are negligible, yet the Intel compiler’s performance sees a 25% improve-ment. A compiler comparison, often overlooked, is the re-sultant memory footprint at runtime. Figure 2 shows the high memory watermark (HMW) of the application during its execution, for the four compilers tested. SUN and GNU show a 5.26% increase in memory over the PGI compiler, however it would appear that Intel’s optimisations require a greater amount of memory to be executed, with a mem-ory footprint 36.84% greater at 418MB. This is a significant difference, and will impact the problem size that could be fitted into local memory.
When considering the same compiler, but with a differ-ent MPI implemdiffer-entation, in both cases where this is possi-ble: SUN and Intel, the OpenMPI build, out performs the equivalent MPICH2 build, by 4.5% and 8.5% respectively, when averaged over multi-core runs. To gain best perfor-mance, an MPI implementation should be optimality tuned for the system in question, this can be achieved by disabling error checking in the MPI builds, or setting configuration options for a specific system. However, in this study both MPI implementations are default builds, so it would ap-pear that, OpenMPI has the edge over MPICH2, in handling the shared-message MPI queue that will be being used, for Shamrock, when running locally on the workstation. Munroll=c:1 -Mnoframe -Mlre
3.2
HPC Platforms
A range of recent, and latest, HPC platforms were avail-able for benchmarking of the Shamrock code. Selections were available from Intel (Nehalem, and Westmere), IBM (POWER series, and BlueGene lines), and AMD (Barcelona). A detail of each platform is given, along with the compiler and MPI implementation of choice. Based on performance gains observed with the SunStudio and OpenMPI implemen-tations on the E5405, where possible the same compiler and MPI implementation has been installed on the HPC plat-form. Each platform, its compiler, and MPI implimentation is denoted inboldfollowing its description.
‘Willow’ is an Intel based cluster from Bull, based at the Atomic Weapons Establishment (AWE). It is built on Bull’s BullX B500 Extreme Computing blade technology. ‘Willow’ is actually two distinct platforms: A’ and ‘Willow-B’ each of which consist of 468 blades, or nodes, housed in 26 chassis. Each node contains two quad-core Intel Xeon Nehalem processors. This gives a total of 3,744 cores. Wil-low employs the Nehalem L5530 [17]. This has a clock speed of 2.4 GHz, with 8 MB cache and a theoretical peak of four floating point operations (FLOPS) per clock cycle. As is common with the Nehalem micro architecture, it utilises In-tel’s QuickPath Interconnect (QPI). The L5530 has a QPI speed of 5.86 GigaTransfers per second (GT/s). Willow’s interconnect is Quad Data Rate (QDR) InfiniBand (IB), with 40 Gb/s full-duplex bandwidth, providing an MPI bi-directional bandwidth of 748.8 GB/s. Each node has 24GB of DDR3 memory, which equates to 3GB/core. The total peak performance of each Willow platform is 35.942 Ter-aFlops (TFlops). The default Fortran compiler and MPI implementation of choice on the system is Intel 11.0.073 and BullXMPI 1.0.1 respectively. Test builds of SunStudio12u1 and OpenMPI 1.4.1, for SunStudio, have also been installed on the ‘Willow’ systems. These will be detoted asL5530 Intel BullXandL5530 Sun OpenMPIrespectively.
‘Blackthorn’ is a large, capability, platform based at AWE. The cluster is a Bull platform consisting of 1,080 compute nodes. Each node consists of two Intel Xeon X5660 hex-core ’Westmere’ processors. The X5660 [18] has a 2.8 GHz clock3, with 12 MB of cache, and a QPI speed of 6.40 GT/s. Each node has 48GB of DD3 memory, which equates to 4GB/core. Blackthorn’s interconnect is QDR IB, with 40 Gb/s full-duplex bandwidth, providing 1728 GB/s MPI bi-directional bandwidth. With each of the X5660 cores pro-viding a theoretical four FLOPS per clock cycle; Blackthorn has a peak of 145.1 TFs. Intel 11.0.073 is the default Fortran compiler, with BullXMPI 1.0.2 the default MPI implemen-tation; denoted asX5660 Intel BullX.
‘Gollum’ is an IBM 550 POWER5 based serverPwr5, a single node with 4 processors clocked at 1.65 GHz. Fortran is provided by XL Fortran 13.1.0.2.
‘Milano’ is an IBM Power 550 Express system. The four socket system is populated with dual core POWER6 proces-sors. Each of the eight cores has a clock speed of 4.2 GHz. The system runs AIX 5.3 ML11, and the Fortran compiler is IBM’s XL Fortran, Version 12.1.0.6. A second POWER6-based server was also benchmarked: ’V60’, an IBM Power 575. With 16 sockets this has 32 cores, each clocked at 4.7 GHz, and 128 GB memory. The operating system (OS)
3It is possible to increase this to 3.2 GHz via Intel’s
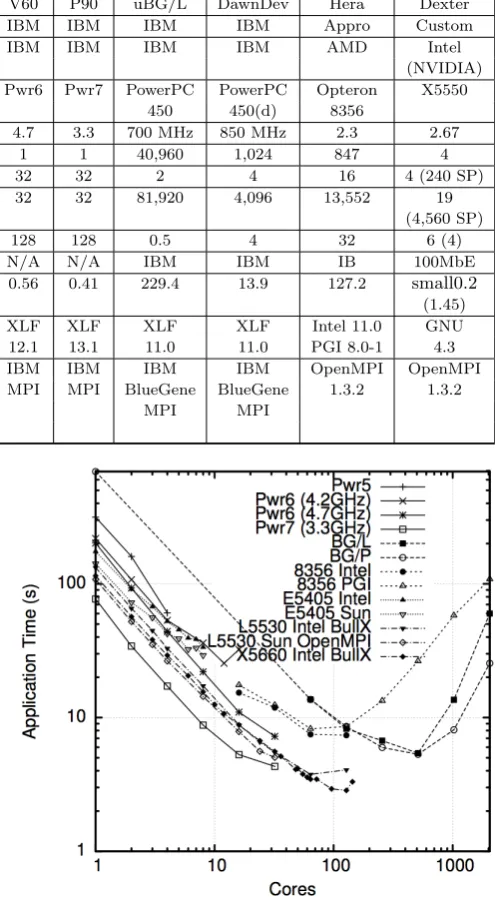
[image:4.595.51.294.194.279.2]Table 3: HPC Platform Summary
Willow Blackthorn Gollum Milano V60 P90 uBG/L DawnDev Hera Dexter
Integrator BULL BULL IBM IBM IBM IBM IBM IBM Appro Custom
Chip Intel Intel IBM IBM IBM IBM IBM IBM AMD Intel
Manufacurer (NVIDIA)
Processor L5530 X5660 Pwr5 Pwr6 Pwr6 Pwr7 PowerPC PowerPC Opteron X5550
Type 450 450(d) 8356
Clock (GHz) 2.4 2.8 1.65 4.2 4.7 3.3 700 MHz 850 MHz 2.3 2.67
Compute Nodes 486 1,080 1 1 1 1 40,960 1,024 847 4
Cores/Node 8 12 4 8 32 32 2 4 16 4 (240 SP)
Total 3,744 12,960 4 8 32 32 81,920 4,096 13,552 19
Cores (4,560 SP)
Mem/Node (GB) 24 48 16 16 128 128 0.5 4 32 6 (4)
Interconnect IB IB N/A N/A N/A N/A IBM IBM IB 100MbE
Theoretical 35.94 145.1 0.03 0.13 0.56 0.41 229.4 13.9 127.2 small0.2
Peak (TF/s) (1.45)
Compilers Intel 11.0 Intel XLF XLF XLF XLF XLF XLF Intel 11.0 GNU Sun 12u1 11.0 13.1 12.1 12.1 13.1 11.0 11.0 PGI 8.0-1 4.3
BullX MPI BullX IBM IBM IBM IBM IBM IBM OpenMPI OpenMPI
MPI 1.0.1 MPI MPI MPI MPI MPI BlueGene BlueGene 1.3.2 1.3.2
Open MPI 1.0.2 MPI MPI
1.4.1
is AIX 5.3 ML10, and the XL Fortran compiler is Version 12.1.0.4. Both POWER6-based architectures have two-way simultaneous multithreading (SMT) enabled. These are de-notedPwr6 (4.2GHz)andPwr6 (4.7GHz)respectively. One POWER7 755 server was benchmarked. Named ‘p90’ it contains four POWER7 chips, with a clock speed of 3.3 GHz and 128 GB of accessible memory. The system has 4-way SMT enabled by default. This is denoted asPwr7 (3.3GHz)throughout the remainder of this paper. For all the POWER platforms, MPI is provided via IBM MPI.
From IBM’s BlueGene architecture series, access was avail-able to both the first and second generations of the hard-ware: BG/L and BG/P. BG/L hardware was available via ‘uBG/L’ (BG/L) based at the Lawrence Livermore Na-tional Laboratory (LLNL). uBG/L’s building block is the 700 MHz, 32-bit PowerPC (450). 40,960 dual core com-pute nodes combine to provide 81,920 cores, each with 256 MB / core. This gives ‘uBG/L’ a peak performance of 229.4 TFlops. Fortran is provided by XL Fortran 10.1.0.4. ‘DawnDev’ (BG/P), is a BG/P architecture, again based at LLNL. BG/P is built from the 850 MHz 32-bit PowerPC (450d) processor, with four cores per node, and 1 GB/core. As a test system, DawnDev contains 1,024 nodes, giving a peak of 13.9 TFlops. Fortran is provided by XL Fortran 11.1.0.5. For both BlueGene systems, IBM BlueGene MPI is the MPI implementation.
‘Hera’ is an Appro [19] integrated cluster based at LLNL. Consisting of 790 nodes of AMD quad-core Opteron 8356 (Barcelona) processors, it contains 13,824 cores, with a clock speed of 2.3 GHz, and 32 GB/node, or 2 GB/core. Hera’s peak performance equates to 127.2 TFs. MPI is provided by a build of OpenMPI 1.3.2 A choice of Fortran compilers are Intel 11.1 and PGI 8.0-1. These are denoted in the text as8356 Inteland8356 PGI. Each HPC platform is summarised in Table 3.
4.
HPC PERFORMANCE
The problem set which was executed locally on the E5405 workstation was run on the HPC architectures and
com-Figure 3: Comparative runtimes for Shamrock sod-square 10242
piler/MPI configurations as detailed in Section 3.2. As with the local builds, to ensure equality of results, restrictions were applied to the compilations. Again, Table 1 can be referred to for compiler specific details.
4.1
Platform Comparisons
Figure 3 shows the runtimes, on a logarithmic scale, for all of the systems previously described. A number of observations can be deduced from this chart:
The improvement seen, on the E5405, for the SunStudio compiler over that of the Intel compiler, carries over to the Nehalem L5530. With runtimes for single coreL5530 Intel BullX18.8% slower than theL5530 Sun OpenMPI.
[image:5.595.310.558.76.525.2]en-Table 4: Relative Number of Cores and Power Con-sumption, for Equal Time to Solution
Equivalent Architecture Power
#Cores Consumption (kW) 10 POWER-7 0.61 20 Nehalem 0.72 20 Westmere 0.59 30 POWER-6 4.79 64 Barcelona 3.52 160 BG/P 1.23
abling the SMT, but only utilising a sub-set of the total SMT threads, a factor speedup of 1.42 over 8 threads on 12, is close to a 1.5 maximum.
Of most interest to the science end-user, is the fastest time to solution for the problem. In the case of all the architectures benchmarked in this study, this is achieved for the X5660 Intel BullX Westmere, on 128 cores for the 10242 problem size.
To enable additional platform comparisons a time to so-lution of 8.24 seconds was selected. This matches the exe-cution time on 64 cores running on the8356 Intel. Hence, it can be inferred from Figure 2 the equivalent number of cores required from each of the architectures benchmarked, to match this 8.24 second turnaround. This is captured in Table 3, along with the respective power consumption for that number of cores on a given architecture.
The power consumption figures given are extrapolations based on full system runs of LINPACK [20] for the systems specified in the Top500. In the case of the POWER-7, as no systems as yet make the list, this figure is based on the maximum possible power draw for a system, as specified in IBM’s p755 Redbook specification [21]. This figure will most certainly be higher than an equivalent LINPACK run.
The power consumption figures clearly show an improve-ment from those architectures of the previous generation (POWER-6 and AMD’s Barcelona) to today’s latest hard-ware (POWER-7, Nehalem and Westmere). The BlueGene solution is between these two ranges, although the imminent arrival of BG/Q is expected to greatly reduce this figure.
4.2
GPU Comparisons
AWE has a modest GPU test bed architecture, codenamed ‘Dexter’. Consisting of four nodes: one master, and three compute. The master node contains two quad core Nehalem X5550 [22] 2.67 GHz processors, and four NVIDIA Tesla C1060 [23] GPUs. Where each C1060 contains 240 stream-ing processor cores with a frequency of 1.3 GHz. The com-pute nodes consist of one quad core X5550, two of the three with four NVIDIA GeForce GTX 285 [24] GPUs and the third with three GTX 285’s and one ATI Radeon HD5870. For the purposes of this study, only the NVIDIA cards were considered, and the C1060 and GTX 285’s treated as one. Dexter is running OpenSUSE as its operating system and the GNU compiler with OpenMPI to provide the Fortran and MPI environments respectively.
To enable a port of the Shamrock benchmark to the GPU, compute intense sections of the code were identified and sub-sequently turned into kernels. In total eight kernels were identified, accounting for approximately 95% of compute time.
[image:6.595.341.531.53.172.2]The method deployed for creating the kernels, was to
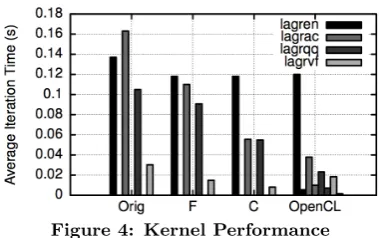
Figure 4: Kernel Performance
take the initial Fortran 90 subroutines, and simplify. Re-moving a number of Fortran 90 features, such as derived types, resulted in less elegant Fortran coding, but in cases provided greater performance than the original. The next step used the National Oceanic and Atmospheric Adminis-trations (NOAA)’s F2C-ACC [25] utility, from their Earth System Research Laboratory, which translated the simpli-fied Fortran routines in to C. Finally, by use of AWE’s Acrylic wrapper code parser, data management and place-holder code for the ported C routines were generated, allow-ing fast utilisation of the OpenCL (Open Computallow-ing Lan-guage) [26] framework, to create GPU executable kernels from the C routines.
At the time of this study, four of these possible kernels have been developed: lagren calculates adiabatic heating on a cell, based on the volume change in the cell and its pressure, using a predictor/corrector method; lagrac cal-culates nodal accelerations due to pressure gradients and subsequently updates the nodal velocities;lagrqqcalculates an artificial viscous pressure around shock waves to smooth out discontinuities and reduce oscillations; and the volume fluxes across cell faces, which are later used to carry out the advective remap, are calculated by the lagrvf kernel. These account for 13.55%, 8.06%, 10.78%, and 1.5% of to-tal compute respectively. Although this gives 33.89% of the code resident on the CPU, there are some caveats which restrict claiming a fully distributed GPU enabled version of the code. Currently, for each kernel call, all data asso-ciated with the kernel is transferred to and from the ac-celerator device. Although, logic has been added enabling data to be shared between kernels there still is a significant overhead from the data copies. Additionally, a number of boundary conditions are assumed for GPU execution, this severely restricts the problem range that Shamrock is capa-ble of running. However, due to careful procapa-blem selection, the test case described in Section 2, and later analysed is unaffected by this restriction. Hence some direct compar-isons between non-accelerated and accelerated runs of the code can be made.
[image:6.595.63.282.82.170.2]Figure 5: Comparison, including GPUs, of runtimes for Shamrock sodsquare 10242
Table 5: Data Bandwidths for Shamrock Transfer Sizes
Cores Transfer Size Host to Device Device to Host (MBs) (MB/s) (MB/s) 1 460.80 4370.7 3362.7 2 230.40 4373.8 3086.0 4 115.20 4545.8 3064.3 8 57.60 4518.0 3030.4 15 30.72 4459.9 3016.7
this OpenCL kernel compute only against the original, yields an average increases in performance of 18.97, with x25.24, x16.53, x14.63, and x19.47 speedups for lagren, lagrac, la-grqq, andlagrvf respectively.
The benchmark was run MPI distributed, in a non-acceler-ated and accelernon-acceler-ated mode (including the current transfer (CT) scheme) on Dexter, using the GNU compiler. These figures were then normalised to the performance figures seen for the Intel compiler, as captured in Section 3.1. The resul-tant figures are captured in Figure 5 asX5550 and X5550 Acc, CT. These show no gain from using the OpenCL ker-nels, and indeed performance is worse for the GPU runs when greater than 8 GPUs are deployed. This is not unex-pected; as previously stated, the data copies, to and from the device each time a kernel is called, begin to dominate. When the remaining four kernels are ported, the current data transfer will be negated and replaced with a one-off initial copy to (and final copy from) the device. A worst case overhead for such a copy can be calculated. The to-tal amount of data necessary for the entire test case stands at 0.45GB/N per processing core, whereN is the number of processing cores used. This is well within the memory constraints of today’s devices: NVIDIA’s Tesla C2070 has 5.25GB of user available memory.4 The memory bandwidth test, oclBandwithTest, which is shipped with NVIDIA’s CUDA Toolkit [27] can be executed to measure the data transfer speeds for a range of transfer sizes. Table 5 shows these transfer speeds, using direct access and paged memory5
av-eraged over ten runs.
Using these bandwidth figures, an estimate of the data transfer overheads can be made for the code if the data transfer per kernel is replaced with an inital copy to, and
4The C2070 has 6GB in total, however 0.75GB is reserved
for error checking and correcting (ECC).
5It is possible to increased bandwidth using mapped access
[image:7.595.57.294.56.186.2]and pinned memory
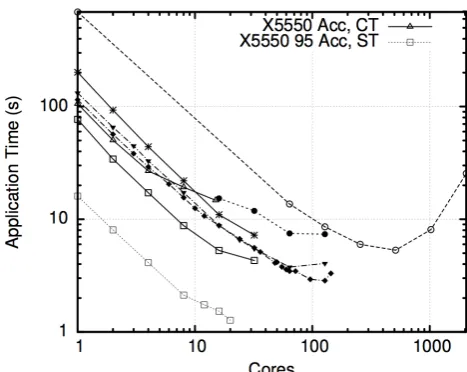
Figure 6: Comparison, including GPUs, of runtimes for Shamrock sodsquare 10242
final copy from, the device. X5550 Acc, ST, in Figure 5, shows the estimated distributed runtime for the benchmark with this change of data transfer from the current transfer (CT) scheme, to a single transfer (ST) scheme.
The four kernels already ported to the GPU, accounting for 33.89% of the total code compute time, and their average speedup, over the original coding, is a factor of 18.97. If it is assumed the remaining 61.11% of compute, contained in the remaining four kernels, achieves a similar average perfor-mance gain, Amdahl’s law can be used to calculate an esti-mated speedup for a distributed, 95% GPU resident, version of the benchmark. Taking the 5% of the application which is not accelerated, each of the kernels with their percentage of compute and performance gains, and the estimated gain for the remaining 61.11%, an overall speedup of a 0.1006 is calculated.
0.05 1 +
0.1355 25.24 +
0.0806 16.53 +
0.1078 14.63 +
0.015 19.47+
0.6111
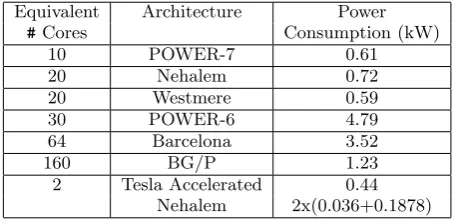
18.97 = 0.1006, This gives an estimated order of magnitude gain over a non-accelerated x5550 run. Figure 6 shows a subset of those runs depicted in Figure 4. Additionally, runtimes of the benchmark with the four OpenCL kernels and the CT scheme,X5550 Acc, CT, and estimated runtimes of the benchmark with 95% resident and the ST scheme, are also plotted. This shows that for an equal time to solution of 8.24 seconds, could be theoretically achieved using two X5550 cores, each accelerated with one Tesla C1060 GPU card. The resultant power consumption, as detailed in Table 5, shows savings compared to alternative platforms.
5.
CONCLUSIONS
[image:7.595.56.293.244.323.2]Table 6: Relative Number of Cores and Power Con-sumption, for Equal Time to Solution; Including GPU
Equivalent Architecture Power
#Cores Consumption (kW) 10 POWER-7 0.61 20 Nehalem 0.72 20 Westmere 0.59 30 POWER-6 4.79 64 Barcelona 3.52 160 BG/P 1.23 2 Tesla Accelerated 0.44
Nehalem 2x(0.036+0.1878)
footprint shows a significant overhead from the execution of the Intel compiled binary, with a runtime memory HMW 36.84% greater than PGI equivalent. For MPI implemen-tation OpenMPI outperforms MPICH2 for the benchmark, although both are default builds and both would need to be tuned for the particular hardware in question.
SMT shows some merit when implemented on POWER6, if a restricted number of threads are utilised. A factor of 1.42 was gained over 8 threads, using 12 of a possible 16 was observed. This prompts future investigations into 4-way SMT on POWER7 and 2-4-way Intel’s SMT on Nehalem architectures.
This paper also presents comparisons of Nehalem, West-mere, POWER-5, POWER-6, POWER-7, BlueGene/L, Blue-Gene/P, and Barcelona hardware, showing that the fastest time to solution for the benchmark code was achieved on 128 Westmere cores. Taking a set time to solution of 8.24s, the POWER7 achieved this with the fewest core count, and a relatively low power consumption figure.
An OpenCL port to a Tesla C1060 accelerated Nehalem based cluster was described for four of eight possible kernels within the benchmark, accounting for 33.89% of the total code compute time. Running with the accelerated kernels in a distributed mode, and comparing with the non-accelerated distributed code, experimental data showed increasing over-heads due to the data transfer to and from the device. Re-moving the current data transfer scheme, and replacing with a larger, single data transfer scheme, and additionally ap-plying an average speedup factor of 18.97 on the remaining four kernels (based on the average speedup observed for the ported kernels) predicted execution time of a distributed, 95% resident version of the benchmark was given. This yields an equal time to solution of 8.24s is achievable with two C1060 accelerated Nehalem cores.
Future publications will document how close these predic-tions are met, once the remaining kernels are accelerated. Early tests on NVIDIA’s Tesla C2050 (‘Fermi’) GPU have given approximate factors of three on the kernels compute, over the C1060. Further comparisons will be made once the current C1060s are augmented with C2050s and C2070s [28] in the ‘Dexter’ cluster. An additional approach is to consider, and compare against the OpenCL kernels, the use of directive based pragmas [29] to achieve accelerated code. Ultimately, Shamrock’s AMR mode will be enabled, and a similar hardware benchmarking study will be performed.
6.
ACKNOWLEDGMENTS
The authors are gratetful to Mark Roberts for access to
development platforms at AWE; Scott Futral for access to uBG/L, DawnDev, and Hera at LLNL. Special thanks to Peter Mayes of IBM for his time and access to a range of IBM test systems.
7.
REFERENCES
[1] Top 500 Supercomputer Sites.
www.top500.org/list/2010/11, Nov. 2010. [2] NCSA, University of Illinois.
www.ncsa.illinois.edu/
[3] F.H. McMahon.Livermore Fortran Kernels: A computer test of numerical performance range
UCRL-53745, LLNL, CA., USA. December 1986. [4] X. WuPerformance Evaluation, Prediction and
Validation of Parallel Systems. p144Springer (1999) [5] D. Kerbysonet al..Predictive Performance and
Scalability Modelling of a Large-Scale Application. SC01. Denver, 2001.
[6] J.A. Daviset al..Predictive Analysis of a Hydrodynamics Application on Large-Scale CMP clusters. Research Report, DCS, U. Warwick, UK. [7] T. Hahnet al..GPU accelerated scientific computing:
Fluid and particulate flows with CUDA
[8] P. Kestener, F. Chateau, R. Teyssier.Accelerating Euler equations numerical solver on graphics processing units.
[9] IntelRXeonRProcessor E5405 [10] Oracle Solaris Studio
http://www.oracle.com/technetwork/server-storage/ solarisstudio/documentation/ss12u1-241645.html. [11] The Portland Group Fortran Compiler
http://www.pgroup.com/resources.
[12] The Intel Fortran Compilersoftware.intel.com. [13] GNU Fortranhttp://gcc.gnu.org/fortran/. [14] Argonne National Laboratory: MPICH2
http://www.mcs.anl.gov/research/projects/mpich2/. [15] OpenMPI: OpenSource High Performance Computing.
http://www.open-mpi.org/.
[16] IEEE Computer Society (1985), IEEE Standard for Binary Floating-Point Arithmetic, IEEE Std 754. [17] IntelRXeonRProcessor L5530
[18] IntelRXeonRProcessor X5660
[19] Appro Supercomputer Solutions.www.appro.com/. [20] A. Petitetet al..The NVIDIA Compute Unified
Device Architecture.ICL, U. of Tennessee.
[21] S. Vetteret al. IBM Power 750 and 755 Technical Overview and Introduction.REDP-4638-00, 2010 [22] IntelRXeonRProcessor X5550
[23] The NVIDIARTeslaTMC1060 [24] The NVIDIA GeForce GTX 285
[25] M. Govett et al.The Fortran-to-Cuda Compiler.
NOAA,esrl.noaa.gov/gsd/ab/ac/F2C-ACC.html
[26] OpenCL - The Open Standard for Parallel Programming of Heterogeneous Systems.
www.khronos.org/opencl
[27] The NVIDIA Compute Unified Device Architecture.
www.nvidia.com/cuda
[28] The NVIDIARTeslaTMC2050 / C2070 GPU