ISSN Print: 2327-5219
DOI: 10.4236/jcc.2018.610006 Oct. 31, 2018 63 Journal of Computer and Communications
An Efficient Arrhythmia Detection Using
Autocorrelation and Statistical Approach
Mohamad Sabri Bin Sinal, Eiji Kamioka
Graduate School of Engineering and Science, Shibaura Institute of Technology, Tokyo, Japan
Abstract
Computational electrocardiogram (ECG) analysis is one of the most crucial topics in cardiovascular research domain especially in identifying abnormali-ties of heart condition through cardiac arrhythmia symptom. There are many existing works focusing on recognizing the abnormalities condition through arrhythmia symptom, however, the detection rate is still unsatisfied. Arr-hythmia consists of more than 14 various types of symptoms. Therefore, most of the existing research found it difficult to classify the entire symptom and maintain the overall accuracy especially in long hour data. In this study, a new mechanism to overcome this issue is proposed: A combination between Autocorrelation methods with K-Nearest Neighbor (KNN) classifier method is introduced to accurately and robustly detect 14 types of Arrhythmia symp-tom regardless of the origin of the sympsymp-tom in a long hour data. Moreover, variability analysis based on periodic autocorrelation result is proposed and used for classification procedure. 1 minute and 12 hours duration data was chosen to compare and signify the most suitable time duration to detect Arr-hythmia symptom. In addition, an analytical result and discussion is done to provide justification behind each tendency of Arrhythmia and Normal Sinus symptom in autocorrelation result. As the result of proposed method perfor-mance evaluation, it was revealed that the accuracy of 95.5% in discriminat-ing Arrhythmia from Normal Sinus data is achieved. Furthermore, it was confirmed that utilizing autocorrelation result in long hour data can help to generalize abnormalities characteristic of heart condition like Arrhythmia symptom. It is concluded that the proposed method can be useful to diagnose abnormalities of heart condition at any stage.
Keywords
Autocorrelation Analysis, Arrhythmia Diagnosis, KNN Classifier, Autocorrelation Function, Heart Disease Diagnosis, Computational Heart Disease Diagnosis
How to cite this paper: Sinal, M.S.B. and Kamioka, E. (2018) An Efficient Arrhyth-mia Detection Using Autocorrelation and Statistical Approach. Journal of Computer and Communications, 6, 63-81.
https://doi.org/10.4236/jcc.2018.610006
Received: September 9, 2018 Accepted: October 28, 2018 Published: October 31, 2018
Copyright © 2018 by authors and Scientific Research Publishing Inc. This work is licensed under the Creative Commons Attribution International License (CC BY 4.0).
DOI: 10.4236/jcc.2018.610006 64 Journal of Computer and Communications
1. Introduction
Electrocardiography (ECG) is a recording process of the heart electrical activities over a period of time. It is a non-invasive examination that is used to diagnose underlying heart conditions using electrodes placed on the skin. The analysis of the electrocardiographic signals provides detailed information on cardiac health status. There are various types of irregular heart rhythms associated with cha-racteristic electrocardiogram (ECG) patterns. One of the types is Cardiac Arr-hythmia. Cardiac Arrhythmia is a group of conditions in which the heartbeat is irregularly faster or slower than normal conditions. Cardiac Arrhythmia is clas-sified into two major categories. One is Morphological Arrhythmia formed by a single irregular heartbeat. The other is Rhythmic Arrhythmia formed by a set of irregular heartbeats. The ECG data including Cardiac Arrhythmia symptoms is characterized by the disappearance of P wave, by irregular R to R interval or by fast heart rate (e.g. 250 - 400 beats per minute). Cardiac Arrhythmia is accom-panied with a various degrees of atrial ventricular [1].
The procedure to detect Arrhythmia symptoms is complicated since the anal-ysis of heartbeats of ECG data requires Holter monitor for hours or even for a day. Normally, ECG data may include various types of human errors and mea-surement errors. Therefore, it is challenging to identify Arrhythmia symptoms when signal noise and disease symptoms are mixed in one data. As an alternative solution to overcome this issue, a computational based approach is proposed in this paper.
Diagnosis of cardiac abnormalities from ECG signals has been proposed by many researchers. Conventionally, an automatic heart disease classification ap-proach consists of 4 processes, which are: 1) ECG signal processing, 2) heartbeat segmentation, 3) feature extraction, and 4) classification. The main conventional features used in the feature extraction process are higher order statistical feature [2] [3], morphological features [4] [5] [6], independent component analysis and wavelet features [7] [8] [9] [10]. In the classification process, artificial neural network [7] [11], linear discrimination analysis (LDA), ensemble method [6], support vector machine [3] [8] [10] and self-organizing map are commonly used in this research area. However, there are two concerns for this study. The first one is the feature extraction process to extract Arrhythmia and abnormalities symptom in long hour data. Second one is the mechanism to analyze and classify the disease itself. Considering the mechanism of Arrhythmia, the symptoms seen in ECG data can be divided into two segments in heart cycle, which are atrial segment and ventricular segment. Most of the works take into consideration ei-ther abnormality in atrial segment or in ventricular segment of ECG signals [12]
[13] [14] [15] [16]. Since Arrhythmia is the most well-known symptom leading
insuffi-DOI: 10.4236/jcc.2018.610006 65 Journal of Computer and Communications cient and inaccurate diagnosis. Additionally, automatic disease classification sys-tems should have a capability to classify the abnormalities from the normal con-dition with high accuracy, less complexity and low computational cost.
To overcome the issues addressed above, in this paper, a new mechanism, which accurately and robustly detects Arrhythmia symptoms from 12 hours ECG data regardless the origin of Arrhythmia symptoms, will be proposed. The new mechanism can mainly be divided into two steps. First, an autocorrelation technique is used to investigate the cyclic nature of a time series ECG data. The result provides the abnormalities in terms of periodicity. Moreover, it computa-tionally simplifies the abnormalities detection process which enhances the detec-tion efficiency. Second, Arrhythmia symptoms are accurately detected based on the features of autocorrelation result such as cyclic peak value and its time length of the first slope. This achieves the classification of Arrhythmia symptoms from Normal Sinus rhythm quantitatively with K-Nearest Neighbors (KNN). Note that Normal Sinus rhythm represents the characteristic of healthy human heart condition and it is used as a reference to identify the Arrhythmia symp-toms.
The remainder of this paper is organized as follows: Section 2 will intro-duce Normal Sinus and Arrhythmia Rhythms, showing their characteristic wave-forms in ECG data. Section 3 will discuss the related works to clarify the issues of existing methods in detecting heart cycle and Arrhythmia symptoms in ECG data. Section 4 will describe the methodology of the proposed mechanism which elaborately detects characteristic wave-forms in ECG data and identifies the Arrhythmia. In Section 5, the evaluation result of the proposed mechanism will be shown based on the two techniques, autocorrelation and statistical ap-proach. In Section 6, the conclusion will be made with discussions on possible future study.
2. Principle of Electrocardiogram
DOI: 10.4236/jcc.2018.610006 66 Journal of Computer and Communications
2.1. Normal Sinus
Sinus rhythm is the set of heart’s normal regular rhythms where the pacemaker is in the sinoatrial node and the conduction is going through the atria ventricu-lar node, and the ventricles are unimpaired. It is a reflection of a normally func-tioning conduction system in the body. The electrical current is following in the normal conduction pathway without interference from other factors such as bo-dily system or disease processes [17].
2.2. Arrhythmia
Arrhythmia refers to any irregular change from the normal sequence of electrical impulses of the heart, that is to say, the electrical impulses could be too fast, too slowly or erratic. If the heartbeat is too fast, it is called tachycardia, while the heartbeat is too slow, it is called bradycardia. Arrhythmia consists of more than 10 various types of abnormality symptoms. For each symptom, it consists of its own unique identification characterization.
2.3. P, Q, R, S, T Wave Morphology
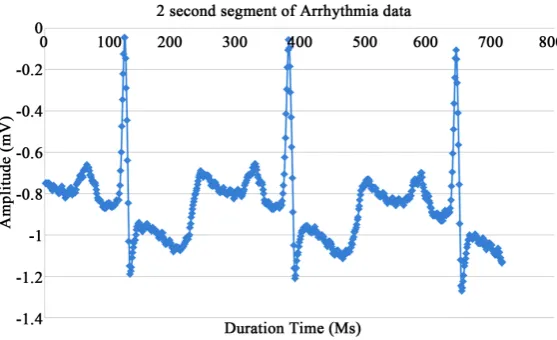
Atrial and ventricular depolarization and repolarization are represented on the ECG as a series of waves: P wave is followed by QRS complex and T wave. The first deflection is the P wave which is associated with the right and the left atrial depolarization. The second wave is the QRS complex. By convention, if the first deflection in the complex is negative, it is called Q wave. The first deflection in the complex is positive, it is called R wave. A negative deflection after the R wave is called S wave. The T wave represents ventricular repolarization. The polarity of this wave normally follows that of the main QRS deflection. The ventricles are electrically unstable during the period of repolarization extending from the peak of the T wave to its initial downslope. A normal ECG signal is considered as a periodic signal. If there are irregularities in these waves, they could be signs of a heart problem. Figure 1 and Figure 2 represent Normal Sinus and Arrhythmia waveforms, respectively. Both waveforms show a huge difference in many ways as shown in Figure 1 and Figure 2. In this research, the behavior within the range of a heart cycle and the interval between each heart cycles are the main focuses. The analysis of autocorrelation result to identify and classify the diseases is the main concern for this study.
3. Related Works
DOI: 10.4236/jcc.2018.610006 67 Journal of Computer and Communications
Figure 1. ECG data with normal sinus symptoms.
Figure 2. ECG data with arrhythmia symptoms.
respectively, has been achieved. However, this method relies on two class multi stage classifications. The complexities in classification become the main disad-vantage for this study because it requires to separate the ECG segment into two parts for further step in abnormalities analysis. Therefore, this characterization of abnormalities under Arrhythmia symptom is less efficient and may consume more computational cost to reach the purpose.
[image:5.595.233.512.267.437.2]tech-DOI: 10.4236/jcc.2018.610006 68 Journal of Computer and Communications nique with tangential contrast function shows a high accuracy of 99.3% to clas-sify Arrhythmia. However, most of these approaches are mainly required a huge amount of time even for low dimensional mapping. Moreover, most of them in this study are complex in terms of implementation. Therefore, in this paper, it is expected that the number of parameters should be minimal with a high accuracy in detecting Arrhythmia symptoms.
Likewise, Chia et al.[19] proposed hybrid adaptive feature selection mechan-ism for detection of Arrhythmia in ECG data. A combination of k-mean clus-tering and support vector machine was introduced and tested with more than 100,000 samples of Arrhythmia symptoms. The accuracy of 98.92% was achieved to detect Arrhythmia. However, the accuracy of the proposed method is relies on three feature extraction processes such as screening feature sample, partitioning the right sample and lastly balancing the number of sample before the classifica-tion in order to maintain a high detecclassifica-tion rate. Most of the existing researches have shown that the characterization of abnormalities through Arrhythmia symptoms is very complex even with a computational method. The degree of complexity can be seen from the initial stage of preparing the sample feature un-til characterizing the abnormalities itself. Therefore, an autonomous and simple approach with a high detection accuracy, which adaptively identifies various types of abnormalities of heart condition through Arrhythmia symptoms, will be the main focus for this study.
4. Detection of Arrhythmia Symptoms Using Autocorrelation
and KNN Classifier
me-DOI: 10.4236/jcc.2018.610006 69 Journal of Computer and Communications chanism by relying on variability behavior of large group data from two symp-toms only. The details of procedure for autocorrelation, KNN and the analysis will be stated in Sections 4.1 and 4.2.
4.1. Autocorrelation Coefficient
Autocorrelation also known as “serial correlation” or “lagged correlation” is a statistical method that measures dependency of variables arranged in time. There are three tools for assessing the autocorrelation of a time series data which are time series plot, the lagged scatter plot and the autocorrelation function. In this study, autocorrelation function will be used to measure variability level of long hour serial correlation of ECG data. Here in this section, an autocorrelation coefficient function will be explained in detail.
Let yi (i = 1, n) be a time series data at the data point i, and let α be the average value of all the data.
The autocorrelation function at lag k is defined as:
(
)(
)
(
)
1
2 1
n k
i i k
i
k n
i i
y y
r
y
α α
α
−
+ =
=
− −
=
−
∑
∑
(1)As the autocorrelation function shows, rk describes the correlation between the two data which are located with the lag k each other. The score ranges from −1.0 (perfect negative relation) to +1.0 (perfect positive relation). If there is no correlation between the two variables, the score is zero.
Next, the procedure to classify the two symptoms is mentioned below and shown in Figure 3.
1) Perform an autocorrelation to 12 hours ECG data and describe the score with lag k as the autocorrelation result.
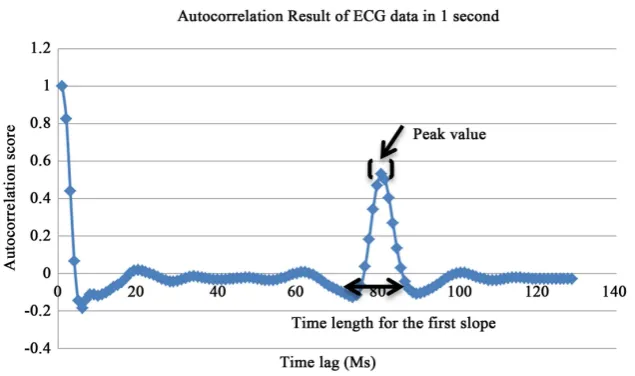
2) Investigate the first periodic slope segment in autocorrelation result based on two parameters.
[image:7.595.215.533.518.706.2]The two parameters are:
DOI: 10.4236/jcc.2018.610006 70 Journal of Computer and Communications a) Peak values of the first periodic slope.
b) Time length of the first periodic slope as shown in Figure 4.
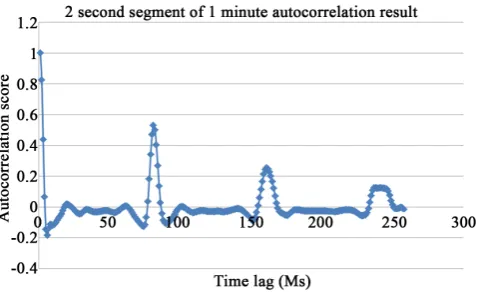
Figure 5 represent 2 second segment of Normal Sinus autocorrelation result
and Figure 6 represent 2 second segment of Arrhythmia autocorrelation result
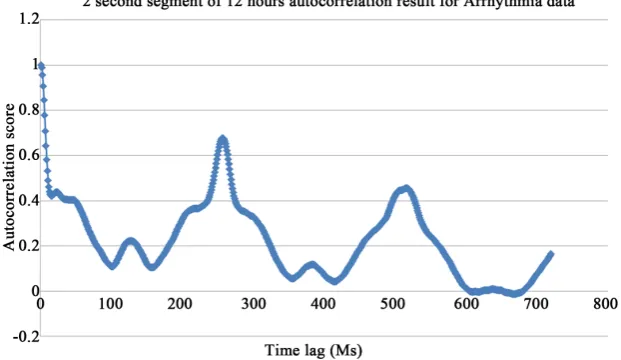
[image:8.595.243.505.249.333.2]in 1 minute duration. For Figure 7, it represent 2 second segment of Normal Sinus autocorrelation result in 12 hours duration while Figure 8 represent Arr-hythmia autocorrelation result with the same duration. In these figures, the ho-rizontal axis indicates the time lag of time series data while the vertical axis in-dicates the autocorrelation score of serial correlation output. Note that the first periodic slope peak value of autocorrelation result for Normal Sinus is much lower than the one for Arrhythmia.
Figure 4. Two important parameters for classification at the first periodic slope.
Figure 5. Example of 2 second segment in 1 minute autocorrelation result with
[image:8.595.254.495.365.511.2]normal sinus symptoms.
Figure 6. Example of 2 second segment in 1 minute autocorrelation result with
[image:8.595.253.494.556.695.2]DOI: 10.4236/jcc.2018.610006 71 Journal of Computer and Communications
Figure 7. Example of 2 second segment in 12 hours autocorrelation result with normal
sinus symptoms.
Figure 8. Example of 2 second segment in 12 hours autocorrelation result with
arrhyth-mia symptoms.
4.2. Discrimination of Arrhythmia from Normal Sinus with
Supervised Machine Learning Classifier
[image:9.595.218.529.303.483.2]DOI: 10.4236/jcc.2018.610006 72 Journal of Computer and Communications
5. Performance Evaluation
In this section, the performance of the proposed method to discriminate Arr-hythmia symptoms from Normal Sinus symptom is evaluated. In the following subsections, the database used for the evaluation experiment and the analytical results are discussed.
5.1. Database for Evaluation
[image:10.595.158.535.376.747.2]Two types of database were introduced in this study, which are “MIT-BIH Arr-hythmia” and “MIT-BIH Normal Sinus”. They have been provided by Physionet [20]. Physionet is an open source database which provided a large number of recorded physiological data and the related open-source software.48 records from MIT-BIH Arrhythmia and 17 records from MIT-BIH Normal Sinus were selected to evaluate the performance of the proposed mechanism. MIT-BIH Arrhythmia includes 14 types of abnormalities as shown in Table 1. The sam-pling frequency for each record is 360 Hz. MIT-BIH Normal Sinus consists of ECG data with healthy heart condition. The sampling frequency for each record is 129 Hz. The amplitude range of typical ECG signal is from −5 mV to 5 mV. The time duration for each record is approximately 12 hours.
Table 1. Detail of information for MIT-BIH arrhythmia database.
MIT-BIH Arrhythmias Database Detail Information
Heartbeat Type Total
Normal rhythm 74,607
Left bundle branch block 8069
Right bundle branch block 7250
Atrial premature contraction 2514
Premature ventricular contraction 7127
Paced beat 7020
Aberrated atrial premature beat 150
Ventricular flutter wave 472
Fusion of ventricular and normal beat 802 Non-conducted P-wave (Blocked APC) 193
Nodal (Junctional) escape beat 229
Fusion of paced and normal beat 986
Ventricular escape beat 106
Nodal (Junctional) escape beat 83
Atrial escape beat 16
Unclassified beat 35
DOI: 10.4236/jcc.2018.610006 73 Journal of Computer and Communications As mention in Section 1, the autocorrelation was performed for all the ECG data; MIT-BIH Arrhythmia and MIT-BIH Normal Sinus, selected from the ab-ovementioned database. The input parameters for KNN classifier were the au-tocorrelation score and the time length of the first periodic slope for each ECG data. Since there are various types of Arrhythmia symptoms covered in this re-search, the effectiveness of the proposed mechanism was evaluated based on the capability to detect the symptom regardless the origin and classifying accuracy.
5.2. Result of Experiment
Quantitative analyses were performed to evaluate the proposed method. To demonstrate the performance improvement with the proposed Arrhythmia de-tection mechanism, the performance evaluation was divided into two sections: 1) Accuracy, sensitivity and specificity of the proposed method to discriminated Arrhythmia from Normal Sinus, 2) Statistical analysis of the proposed approach.
Accuracy, Sensitivity and Specificity Evaluation
To evaluate the classification performances of the proposed mechanism, “Accu-racy”, “Sensitivity” and “Specificity” were selected as the evaluation metrics. The sensitivity and specificity are considered as the best paired performance metrics to evaluate the classification accuracy of heart disease [21]. The true positive rate of sensitivity represents the proportion of actual positives correctly identified as Arrhythmia data as having the Arrhythmia [22]. On the other hand, the true negative rate of specificity represents the proportion of actual negatives correctly identified as Normal Sinus and not having the Arrhythmia condition [22]. Ac-curacy rate represent the overall ratio of the proposed method to differentiate Normal Sinus and Arrhythmia correctly [22]. The discrimination accuracy, sen-sitivity and specificity are defined as follows:
Sensitivity = True positives/(True positive + False negative) Specificity = True negatives/(True negative + False positives)
Accuracy =(True negatives + True positive)/(True negatives + True positive + False negative + False positive)
where,
True positive: The number of Arrhythmia data correctly identified as
Arr-hythmia data.
False negative: The number of Arrhythmia data incorrectly identified as NS
data.
False positive: The number of NS data incorrectly identified as Arrhythmia
data.
True negative: The number of NS data correctly identified as NS data.
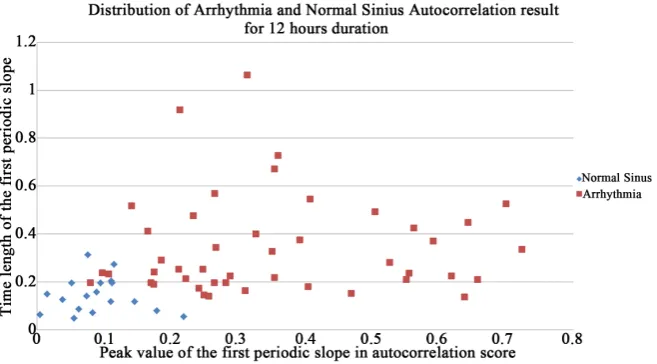
Figure 9 and Figure 10 represent the distribution of the peak value and the
DOI: 10.4236/jcc.2018.610006 74 Journal of Computer and Communications
Figure 9. Distribution of autocorrelation result based on first periodic slope peak value
with time length for 1 minute data.
Figure 10. Distribution of autocorrelation result based on first periodic slope peak value
with time length for 12 hours data.
without overlapping the Normal Sinus data. Only three Arrhythmia data are overlapped with the region of Normal Sinus data. In order to classify these two symptoms computationally, a KNN classifier was used.
[image:12.595.211.540.304.486.2]DOI: 10.4236/jcc.2018.610006 75 Journal of Computer and Communications In order to compare the KNN classifier used here with others in the proposed method, other 17 types of supervised machine learning classifiers were selected and evaluated. Table 3 represent the performance comparison using 17 type of classifier using same dataset with 1 minute duration while Table 4 is focusing on the performance comparison using 17 type of classifier with 12 hours duration.
Figure 11 and Figure 12 represent the overall performance of 1 minute and 12
[image:13.595.209.540.253.343.2]hours data based on 17 various types of classifier in histogram plot. The evalua-tion metrics for the performance comparison are accuracy, sensitivity and speci-ficity.
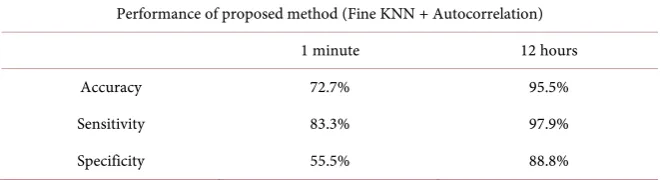
Table 2. Sensitivity, specificity and accuracy of Arrhythmia and normal sinus symptom
detection using KNN with the proposed method.
Performance of proposed method (Fine KNN + Autocorrelation)
1 minute 12 hours
Accuracy 72.7% 95.5%
Sensitivity 83.3% 97.9%
Specificity 55.5% 88.8%
Table 3. Performance comparison using 17 types of classifiers using the same dataset
with 1 minute duration.
Overall performance of 17 various classifier
Classifier Name Accuracy (%) Sensitivity (%) Specificity (%)
Linear SVM 78.8 89.5 50
Quadratic SVM 75.8 85.4 55.5
Cubic SVM 80.3 91.6 72.2
Fine Gaussian SVM 78.8 77.0 55.5
Medium Gaussian SVM 75.8 85.4 50
Coarse Gaussian SVM 72.7 100 0
Fine KNN (Proposed method) 72.7 83.3 55.5
Medium KNN 81.8 89.5 61.1
Coarse KNN 72.7 100 0
Cosine KNN 74.2 83.3 50
Cubic KNN 83.3 89.5 66.6
Weighted KNN 78.8 87.5 55.5
Linear Discrimination 78.8 91.6 44.4
Quadratic Discrimination 81.8 83.3 77.7
Complex Tree 80.3 81.25 77.7
Medium Tree 80.3 81.25 77.7
[image:13.595.194.538.391.743.2]DOI: 10.4236/jcc.2018.610006 76 Journal of Computer and Communications
Figure 11. Sensitivity, specificity and accuracy detection rate of arrhythmia and normal sinus symptoms for 1 minute’s duration
based on 17 various type of classifier.
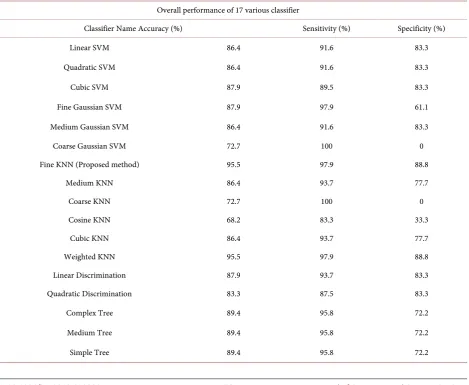
Table 4. Performance comparison using 17 types of classifiers using the same dataset with 12 hours duration.
Overall performance of 17 various classifier
Classifier Name Accuracy (%) Sensitivity (%) Specificity (%)
Linear SVM 86.4 91.6 83.3
Quadratic SVM 86.4 91.6 83.3
Cubic SVM 87.9 89.5 83.3
Fine Gaussian SVM 87.9 97.9 61.1
Medium Gaussian SVM 86.4 91.6 83.3
Coarse Gaussian SVM 72.7 100 0
Fine KNN (Proposed method) 95.5 97.9 88.8
Medium KNN 86.4 93.7 77.7
Coarse KNN 72.7 100 0
Cosine KNN 68.2 83.3 33.3
Cubic KNN 86.4 93.7 77.7
Weighted KNN 95.5 97.9 88.8
Linear Discrimination 87.9 93.7 83.3
Quadratic Discrimination 83.3 87.5 83.3
Complex Tree 89.4 95.8 72.2
Medium Tree 89.4 95.8 72.2
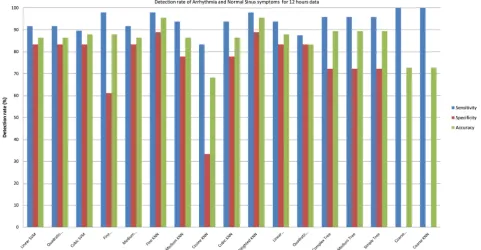
[image:14.595.69.539.359.744.2]DOI: 10.4236/jcc.2018.610006 77 Journal of Computer and Communications
Figure 12. Sensitivity, specificity and accuracy detection rate of arrhythmia and normal sinus symptoms for 12 hours duration
based on 17 various type of classifier.
5.3. Discussion
To complete this study, an analytical result and discussion was conducted. Based on the result with 12 hours duration data, the distributions pattern of the first periodic slope peak value with the time length are very identical for both symp-toms. Correlation coefficient peak value of the first periodic slope in Arrhythmia shows higher score tendency compared to Normal Sinus. Although correlation is conventionally being interpret based on the score size of the relationship, but it is very important to understand the influential factor affecting the size of the score before interpreting it. First, the nature of raw data itself and second is the implementation mechanism of autocorrelation method towards the data. Based on related finding have shown that there are 6 factors that can influence the cor-relation coefficient score [23]. For this study, there are three factors are corre-lated with the finding especially on why autocorrelation score for the first peri-odic slope are much higher with Arrhythmia compared to Normal Sinus. Those factors are amount of variability in the dataset [23] [24], the size of the sample [23] [24] [25] and the characteristic of the sample data itself [23] [24] [25] [26].
DOI: 10.4236/jcc.2018.610006 78 Journal of Computer and Communications the nature of Arrhythmia symptom itself. Hence, the presence of an outlier in a dataset can only influencing the correlation score based on the two factors [23]. First, the location of the outlier itself and second, the size of the sample is small enough. In this experiment, each record consists of approximately more than 700,000 data point. Even if there is a small group of outliers included in Normal Sinus data, the overall autocorrelation score will not be affected by it. In this study, it is confirmed that the time length of the data is considered as the biggest influential factor towards the overall classification performance. Due to fact that Arrhythmia randomly appear in time series domain, longer duration is required to accurately detect the disease. In summary, the longer the ECG data is used, the more explicit the behavior of the data can be seen. For that, high accuracy of detecting Arrhythmia can be achieved.
To compare the discrimination performance of the proposed method, Table 5 shows the result of sensitivity and specificity of related studies with the same fo-cus with this research using the same database. Most of the related works are focusing on specific segment in ECG data to classify the symptom. Without re-lying on any specific feature like the proposed method, the possibilities to dis-criminate Arrhythmia from Normal Sinus can be done accurately. Best of our knowledge, there is no existing work has proposed as simple method as this study to detect and classify arrhythmia with high accuracy. It is revealed that the proposed mechanism has overcome the other studies in term of simplicity of the mechanism to identify Arrhythmia and abnormalities symptoms regardless the origin of the symptom, and the proposed approach to classify the two symptoms with high accuracy.
Table 5. Overall performance evaluation result comparing this research with other
stu-dies.
Ventricular Arrhythmia Analysis
Method Sensitivity (%) Specificity (%)
Parham et al. [27] 99.5 99.66
Yun-Chi et al. [16] 98.28 -
Shing et al. [28] 98.75 99
Yun-Chi Yeh et al. [29] 98.28 -
Joo S. Lim [30] 99.02 96.67
Uday Maji et al. [12] 99.3 99.2
Atrial Arrhythmia Analysis
Jinseok Lee et al. [31] 94.7 94.4
Uday Maji et al. [12] 99.8 98.4
Arrhythmia Analysis at Both Segment
[image:16.595.201.541.482.738.2]DOI: 10.4236/jcc.2018.610006 79 Journal of Computer and Communications
6. Conclusion
In this paper, a novel approach, which statistically detects abnormalities of heart condition based on Arrhythmia symptoms using autocorrelation functions and KNN classifier, was proposed. A variability analysis based on periodic cycle in autocorrelation result was done. It is based on two parameters at first periodic slope of autocorrelation result. In order to discriminate the two symptoms, KNN classifier was used. The effectiveness of the proposed method was evaluated based on 3 performance evaluations metric which are accuracy, sensitivity and specificity. From the result, the overall accuracy was 95.5%, sensitivity of detect-ing Arrhythmia was 97.5% and the specificity of detectdetect-ing Normal Sinus was 88.8%. The comparison approach between this research and other studies shows that the proposed mechanism is robust, flexible and less complexity in detecting abnormalities symptoms like Arrhythmia. In this study, 17 different types of su-pervised machine learning classifier were used to compare with the proposed classifier. It is proven that fine KNN has outperformed other classifiers for 12 hours duration segment. 14 types of symptoms had cover in this study and there is no dependency towards any specific characteristic and feature segment in ECG data to identify each Arrhythmia symptom. It is justified the robustness of the proposed method in discriminating abnormalities of heart condition. It is confirmed based on this study that the time length of data is considering the biggest influential factor towards overall classification performance. Therefore, the longer time duration of ECG data is used, the higher accuracy the classifier can be achieved. It is concluded that this research finding can contribute to the medical field to identify Arrhythmia symptom with less complexity procedure in long hour duration.
Conflicts of Interest
The authors declare no conflicts of interest regarding the publication of this pa-per.
References
[1] Ettinger, S.J. (2018) Cardiac Arrhythmias—Diagnosis and Treatment. Cardiology.
https://www.vin.com/apputil/content/defaultadv1.aspx?id=3852129&pid=11181&&
print=1
[2] Lannoy, G.D., Francois, D., Delbeke, J. and Verleysen, M. (2012) Weighted Condi-tional Random Fields for Supervised Interpatient Heartbeat Classification. IEEE Transactions on Biomedical Engineering, 59, 241-247.
https://doi.org/10.1109/TBME.2011.2171037
[3] Osowski, S., Hoai, L. and Markiewicz, T. (2004) Support Vector Machine-Based Expert System for Reliable Heartbeat Recognition. IEEE Transactions on Biomedi-cal Engineering, 51, 582-589. https://doi.org/10.1109/TBME.2004.824138
[4] Dechazal, P., Odwyer, M. and Reilly, R. (2004) Automatic Classification of Heart-beats Using ECG Morphology and Heartbeat Interval Features. IEEE Transactions on Biomedical Engineering, 51, 1196-1206.
DOI: 10.4236/jcc.2018.610006 80 Journal of Computer and Communications
[5] Oliveira, L.S.C.D., Andreao, R.V. and Sarcinelli-Filho, M. (2011) Premature Ven-tricular Beat Classification Using a Dynamic Bayesian Network. 2011 Annual In-ternational Conference of the IEEE Engineering in Medicine and Biology Society, Boston, 30 August-3 September 2011.
[6] Zeng, X.D., Chao, S. and Wong, F. (2011) Ensemble Learning on Heartbeat Type Classification. Proceedings 2011 International Conference on System Science and Engineering, Macao, 8-10 June 2011.
[7] Ince, T., Kiranyaz, S. and Gabbouj, M. (2009) A Generic and Robust System for Automated Patient-Specific Classification of ECG Signals. IEEE Transactions on Biomedical Engineering, 56, 1415-1426.
https://doi.org/10.1109/TBME.2009.2013934
[8] Jiang, X., Zhang, L., Zhao, Q. and Albayrak, S. (2006) ECG Arrhythmias Recogni-tion System Based on Independent Component Analysis Feature ExtracRecogni-tion. 2006
IEEE Region 10 Conference, Hong Kong, 14-17 November 2006.
[9] Yang, S. and Shen, H. (2013) Heartbeat Classification Using Discrete Wavelet Transform and Kernel Principal Component Analysis. IEEE 2013 Tencon-Spring, Sydney, 17-19 April 2013.
[10] Ye, C., Kumar, B.V.K.V. and Coimbra, M.T. (2012) Heartbeat Classification Using Morphological and Dynamic Features of ECG Signals. IEEE Transactions on Bio-medical Engineering, 59, 2930-2941. https://doi.org/10.1109/TBME.2012.2213253
[11] Jiang, W. and Kong, G.S. (2007) Block-Based Neural Networks for Personalized ECG Signal Classification. IEEE Transactions on Neural Networks, 18, 1750-1761.
https://doi.org/10.1109/TNN.2007.900239
[12] Maji, U., Mitra, M. and Pal, S. (2017) Characterization of Cardiac Arrhythmias by Variational Mode Decomposition Technique. Biocybernetics and Biomedical Engi-neering, 37, 578-589. https://doi.org/10.1016/j.bbe.2017.04.007
[13] Giraldo, B., Laguna, P., Jane, R. and Caminal, P. (1995) Automatic Detection of Atrial Fibrillation and Flutter Using the Differentiated ECG Signal. Computers in Cardiology 1995, Vienna, 10-13 September 1995.
[14] Hoppe, B.L., Kahn, A.M., Feld, G.K., Hassankhani, A. and Narayan, S.M. (2005) Separating Atrial Flutter From Atrial Fibrillation with Apparent Electrocardio-graphic Organization Using Dominant and Narrow F-Wave Spectra. Journal of the American College of Cardiology, 46, 2079-2087.
https://doi.org/10.1016/j.jacc.2005.08.048
[15] Christov, I., Bortolan, G. and Daskalov, I. (2001) Sequential Analysis for Automatic Detection of Atrial Fibrillation and Flutter. Computers in Cardiology, Rotterdam, 23-26 September 2001. https://doi.org/10.1109/CIC.2001.977650
[16] Yeh, Y.-C. and Lin, H.-J. (2010) Cardiac Arrhythmia Diagnosis Method Using Fuzzy C-Means Algorithm on ECG Signals. 2010 International Symposium on Computer, Communication, Control and Automation (3CA), Tainan, 5-7 May 2010, 272-275. https://doi.org/10.1109/3CA.2010.5533831
[17] Uchida, S., Mori, A., Kurazume, R., Taniguchi, R.-I. and Hasegawa, T. (2007) Logi-cal DP Matching for Detecting Similar Subsequence. Computer Vision—ACCV
2007: 8th Asian Conference on Computer Vision, Tokyo, 18-22 November 2007, 628-637.
[18] Rajagopal, R. and Ranganathan, V. (2017) Evaluation of Effect of Unsupervised Dimensionality Reduction Techniques on Automated Arrhythmia Classification.
Biomedical Signal Processing and Control, 34, 1-8.
DOI: 10.4236/jcc.2018.610006 81 Journal of Computer and Communications
[19] Shen, C.-P., Kao, W.-C., Yang, Y.-Y., Hsu, M.-C., Wu, Y.-T. and Lai, F. (2012) De-tection of Cardiac Arrhythmia in Electrocardiograms Using Adaptive Feature Ex-traction and Modified Support Vector Machines. Expert Systems with Applications, 39, 7845-7852. https://doi.org/10.1016/j.eswa.2012.01.093
[20] PhysioNet (2018) Detrended Fluctuation Analysis (DFA).
http://www.physionet.org/
[21] Vijaya, G., Kumar, V. and Verma, H.K. (1998) ANN-Based QRS-Complex Analysis of ECG. Journal of Medical Engineering & Technology, 22, 160-167.
https://doi.org/10.3109/03091909809032534
[22] Florkowski, C.M. (2008) Sensitivity, Specificity, Receiver-Operating Characteristic (ROC) Curves and Likelihood Ratios: Communicating the Performance of Diag-nostic Tests. The Clinical Biochemist Reviews, 29, S83-S87.
[23] Goodwin, L.D. and Leech, N.L. (2006) Understanding Correlation: Factors That Affect the Size of r. The Journal of Experimental Education, 74, 249-266.
https://doi.org/10.3200/JEXE.74.3.249-266
[24] Glass, G.V. and Hopkins, K.D. (2008) Statistical Methods in Education and Psy-chology. Allyn & Bacon, Boston.
[25] Lockhart, R.S. (1998) Introduction to Statistics and Data Analysis for the Behavioral Sciences. W.H. Freeman, New York.
[26] Sprinthall, R.C. (2014) Basic Statistical Analysis. Pearson, London.
[27] Ghorbanian, P., Ghaffari, A., Jalali, A. and Nataraj, C. (2010) Heart Arrhythmia Detection Using Continuous Wavelet Transform and Principal Component Analy-sis with Neural Network Classifier. Computing in Cardiology, Belfast, 26-29 Sep-tember 2010, 669-672.
[28] Pan, S.-T., Chiou, Y.-J., Hong, T.-P. and Chen, H.-C. (2013) Automatic Recognition for Arrhythmias with the Assistance of Hidden Markov Model. 2013 9th Interna-tional Conference on Information, Communications & Signal Processing, Tainan, 10-13 December 2013, 1-5.
[29] Yeh, Y.-C. (2009) An Analysis of ECG Beats by Using the Mahalanobis Distance Method. 2009 Fourth International Conference on Innovative Computing, Infor-mation and Control (ICICIC), Kaohsiung, 7-9 December 2009, 1460-1463.
https://doi.org/10.1109/ICICIC.2009.75
[30] Shyu, L.-Y., Wu, Y.-H. and Hu, W. (2004) Using Wavelet Transform and Fuzzy Neural Network for VPC Detection from the Holter ECG. IEEE Transactions on Biomedical Engineering, 51, 1269-1273. https://doi.org/10.1109/TBME.2004.824131