Microwave Drying of Green Bean Slices: Drying Kinetics
and Physical Quality
Ibrahim DOYMAZ, Azmi Seyhun KIPCAK and Sabriye PISKIN
Department of Chemical Engineering, Yildiz Technical University, Esenler, Istanbul, Turkey
Abstract
Doymaz I., Kipcak A.S., Piskin S. (2015): Microwave drying of green bean slices: drying kinetics and physi-cal quality. Czech J. Food Sci., 33: 367–376.
Several microwave power settings were applied to green beans in order to determine the effect on the drying kinetics along with the rehydration ratio and colour values. In the experiments, several microwave power settings were studied as 180, 360, 600, and 800 W. From the results, it is seen that the level of microwave power affected the drying kinetics, rehydration ratio, and colour of the beans slightly. The nine best known thin-layer drying models that were used in literature were applied to the experimental data and the results showed that Midilli et al. model best fits the experimental data for the drying kinetics of green bean slices. Effective moisture diffusivity was found to be between 1.387 × 10⁻⁸ and 3.724 × 10⁻⁸ m2/s. Using modi-fied Arrhenius type equation the activation energy was found as 19.185 kW/kg. The rehydration ratio of samples dried at 800 W was higher than those of samples at other power settings. It was observed that an increase in the microwave power increased the brightness and yellowness, on the contrary, it decreased the greenness of the dried samples.
Keywords: Phaseolus vulgaris; effective diffusivity; drying; mathematical modelling; rehydration; colour
List of abbreviations
a, b, c – empirical constants in drying models; D0 – pre-exponential factor of Arrhenius equation (m2/s); D
eff – effective moisture diffusivity (m2/s); E
a – activation energy (W/kg); g, k – empirical coefficients indrying models (1/s); K – slope;
L – half-thickness of slices (m); MR – moisture ratio (dimensionless); Me – equilibrium moisture content (kg water/kg dry matter – DM); M0 – initial moisture content (kg water/kg DM); Mt – moisture content at any time (kg water/kg DM);
Mt+Δt – moisture content at t+Δt (kg water/kg DM); N – number of observations; n – positive integer, empirical constant; P – microwave power (W); P – probability; R – universal gas constant (kJ/(mol.K)); R2 – coefficient of determination;
RR – rehydration ratio; RMSE – root mean square error; T – temperature (°C); t – drying time (min, s); W1 – weight of dried matter (g); W2 – weight of moisture in the material (g); z – number of constants; c2 – reduced chi-square
The bean (Phaseolus vulgaris), which contains car-bohydrates, proteins, dietary fibre (insoluble fibre), vitamins (thiamine, riboflavin, niacin, pyridoxine, and folic acid) as a major amount and minerals of calcium, iron, copper, zinc, phosphorus, potassium, and magnesium as a minor amount and flavonoids, which act as antioxidants and can be found in the hull part of bean, is a gramineous plant that belongs to the family Leguminosae (Ulloa et al. 2013). In 2012 the worldwide production of bean was 20 742 857 t and the six major producer countries were China, Indonesia, India, Turkey, Thailand, and Egypt, from higher to lower rank. In Turkey the green bean pro-duction was 614 965 t in 2012 on the area of 74 000 ha.
In order to extend the storage life of green beans, drying is an important process after harvest because green beans are very sensitive to spoilage due to their high content of moisture.
(Secmeler 2003) because major disadvantages of hot air drying of agricultural products are low energy efficiency, quality loss and long drying time during the falling rate period (Boudrioua et al. 2003).
Nowadays, the aim of modern drying is come upon by reducing energy consumption and providing high quality with a minimal increase in economic inputs, which has been of increasing attraction to applica-tions in the drying process (Raghavan & Silveira 2001; Kahyaoglu et al. 2012; Darvishi et al. 2013). For the last 20 years microwave drying has been of interest in the area of water removal from agricul-tural products, for short drying time that leads to lower energy consumption and better quality of the dried food (Sanga et al. 2000). One of the primary advantages in using the microwave heating is that the temperature and moisture gradients are in the same direction, and hence aid each other as opposed to conventional heating where moisture must move out of the material against the gradient of temperature. Thus drying time is shortened due to quick absorption of energy by water molecules, causes rapid evaporation of water, resulting in high drying rates of the food. However, there are some problems with the microwave drying technique. Because of non-uniform heating, the uneven distribution of microwave field can occur. Also, overheating and quality deterioration can take place. To overcome these problems, the microwave drying technique has been combined with other dry-ing methods (Puligundla et al. 2013).
Recently, microwave drying has attracted popular-ity as an alternative method for drying several food products such as fruits, vegetables, and dairy prod-ucts were also studied. By researchers, cranberries (Yongsawatdigul & Gunasekaran 1996), carrot slices (Lin et al. 1998), potatoes (Bouraout et al.
1994; Bondaruk et al. 2007), grapes (Tulasidas et al. 1996), apples (Funebo & Ohlsson 1998; Prothon
et al. 2001; Bilbao-Sáinz et al. 2006), mushrooms (Funebo & Ohlsson 1998; Giri & Prasad 2007), ginseng roots (Ren & Chen 1998), blueberries (Feng
et al. 1999), pistachios (Kouchakzadeh & Shafeei 2010), tomato pomace (Al-Harahsheh et al. 2009), kiwifruits (Maskan 2001), garlic (Sharma & Prasad 2006), spinach (Alibas Ozkan et al. 2007), and green peas (Zielinska et al. 2013) were studied along by a microwave method. As it is given in the literature stud-ies, there is no data available about microwave drying of green bean. For the contribution to the literature, the drying, rehydration and colour characteristics of green beans in a microwave oven were investigated.
Furthermore, the mathematical modelling by using nine thin-layer drying models available in the literature was performed and the values of effective moisture diffusivity and activation energy were calculated.
MATERIAL AND METHODS
Sampling. The fresh green beans (Phaseolus
vul-garis L.) were obtained from a local grocery store in Istanbul on March 2014. The beans were washed and sliced at an average length and thickness of 2 cm and 0.6 cm, respectively. Then sliced beans were put into low-density polyethylene plastic bags. Packed beans were kept in a refrigerator (Arcelik 1050T; Arcelik, Eskisehir, Turkey) working at a temperature of 4°C. Before experiments the beans were taken out of the refrigerator and waited to equalise with the room temperature. Using the AOAC method (AOAC 1990), the initial moisture content of the beans was deter-mined as 9.89 ± 0.05 kg water/kg dry matter (DM).
Drying procedure. Drying experiments were
car-ried out in a Robert Bosch Hausgerate GmbH (Mu-nich, Germany) model microwave oven which has a maximum output of 800 W working at 2450 MHz. In the microwave drying process, the samples were separated evenly and homogeneously over the en-tire pan. The drying processes were carried out at microwave powers of 180, 360, 600, and 800 W. The sample mass (approximately 12 ± 0.2 g) was selected during 60 s intervals with a digital balance (Precisa, model XB220A; Precisa Instruments AG, Dietikon, Switzerland) with an accuracy of 0.001 g. Drying was finished when the moisture content of samples was approximately 0.08 kg water/kg dry matter. The dried product was cooled in a desiccator and packed in low-density polyethylene bags that were heat-sealed. The experiments were triplicated and average values of the moisture content were used for drawing the drying curves.
Mathematical modelling. In Table 1, nine
thin-layer drying models, which were used on the drying data obtained at different microwave powers, are shown. Using Eq. (1), the sample moisture ratio (MR) was calculated as follows:
MR = Mt – Me (1)
M0 – Me
where: Mt–moisture content (kg water/kg DM) at any
spe-cific time; M0 – initial moisture content; Me– equilibrium
The values of Me are considered relatively small compared to Mt or M0, especially for microwave dry-ing. Thus, Eq. (1) can be simplified to MR = Mt/M0
(Balbay & Sahin 2012; Chayjan & Shadidi 2014; Calín-Sánchez et al. 2014).
The drying rate (DR) was calculated by the fol-lowing formula:
DR = Mt – Mt+Δt (2)
Δt
where: Mt+Δt – moisture content at t+Δt (kg water/kg DM);
t – time (min)
Determination of effective moisture diffusivity.
Fick’s second law of diffusion equation, symbolised as a mass-diffusion equation for drying of agricultural products in a falling rate period, is shown in Eq. (3):
∂M = ∇[D
eff (∇M)] (3)
∂t
Fick’s second law of unsteady state diffusion given in Eq. (3) can be used to determine the moisture ratio in Eq. (4). The solution of diffusion equation for an infinite slab was given by Crank (1975), and uniform initial moisture distribution, negligible ex-ternal resistance, constant diffusivity, and negligible shrinkage were supposed (Doymaz et al. 2015):
MR = 8
∑
∞
1 exp
(
–(2n + 1)2 π2Deff t)
(4)π2 n=0 (2n + 1)2 4L2
where: Deff – effective moisture diffusivity (m2/s); t – time (s);
L – half-thickness of samples (m); n – positive integer
For long drying times, only the first term in Eq. (4) is significant and the equation simplifies to:
MR = 8 exp
(
– π2Deff t)
(5)π2 4L2
Equation (5) can be written in a logarithmic form as follows:
ln(MR) = ln
(
8)
–(
π2Deff t)
(6)π2 4L2
The values of effective moisture diffusivity were determined by plotting experimental drying data in terms of ln (MR) versus drying time in Eq. (6). The plot produces a straight line with the slope as follows:
Slope =
(
π2Deff)
(7)4L2
Computation of activation energy.
Tempera-ture is not a directly measurable quantity in the microwave oven for a drying process. Hence the
activation energy can be calculated by the modified form of Arrhenius equation as given by Dadali et al. (2007), where it shows the relationship between the effective moisture diffusivity and the microwave power to sample weight instead of temperature. The equation is given as follows:
Deff = D0 exp
(
–Ea m)
(8)P
where: D0 – pre-exponential factor of Arrhenius equation
(m2/s); E
a – activation energy (W/kg); P – microwave power
(W); m – sample weight (kg)
Rehydration experiments. Rehydration is a
pro-cess of refreshing the dried material in water. Three grams of dried sample were placed in glass beakers containing water (at 23°C) at a ratio of 1: 100 (w/w). At specified time such as 5 h, the samples were then removed from glass beakers, blotted with tissue paper to eliminate excess water on the surface, and weighed. The rehydration ratio (RR) was calculated using the following formula:
RR = W2 – W1 (9)
W1
where: W1 – weight of dried matter (kg); W2 – weight of
moisture in the material (kg); all experiments were con-ducted in duplicates.
Colour determination. The colour of the fresh and
dried green bean samples was recorded by tristimulus colorimetry using a Konica Minolta CR 400 (Minolta, Osaka, Japan). The colour brightness coordinate L* measures the whiteness value of a colour and ranges from black at 0 to white at 100. The chromaticity coordinate a* measures red when positive and green when negative, and the chromaticity coordinate b* measures yellow when positive and blue when nega-tive. Five readings were performed for each sample, and the mean values were calculated.
Statistical analysis. The models in Table 1 were
evaluated using the nonlinear regression procedure of Statistica v. 8.0 (StatSoft Inc., Tulsa, USA). The statistical parameters used to determine the model that describes in the best way the variation in the moisture ratio values of dried green beans was the coefficient of determination (R2), reduced chi-square
(χ2), and root mean square error (RMSE). The lower
the χ2 and RMSE values and the higher the R2 value,
the better the goodness of fit (Falade & Ogunwolu 2014; Vega-Gálvez et al. 2014). The χ2 and RMSE
c2 = N
∑
(MRexp.i – MRpre.i)2(10) i=1 N – z
RMSE =
[
1N
∑
(MRpre.i – MRexp.i)2]
1/2 (11)Ni=1
where: MRexp,i, MRpre,i– experimental and predicted
dimen-sionless moisture ratios, respectively; N – number of
obser-vations; z – number of constants
One-way analysis of variance (ANOVA) and multi-ple comparisons (post-hoc LSD) were used to evalu-ate significant differences in the data at P < 0.05 of rehydration and colour results.
RESULTS AND DISCUSSION
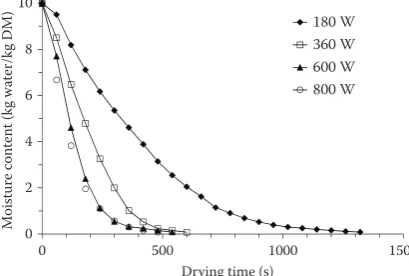
Drying curves. Drying curves of green beans
dur-ing drydur-ing by various microwave powers are shown in Figure 1. The initial average moisture content of
bean slices was 9.89 kg water/kg DM, which was reduced to 0.08 kg water/kg DM after drying. The obtained drying curves seemed similar to those in the studies that involve fruits and vegetables in the literature. It is apparent that the moisture content decreased steadily with drying time and decreased faster at higher microwave power in all cases. The drying times required to reach the final moisture content of samples were 1320, 600, 540, and 480 s at the microwave power of 180, 360, 600, and 800 W, respectively. The average drying rate of samples increased 2.75 times, as the microwave power in-creased from 180 W to 800 W. As expected at higher microwave power, the higher heat absorption resulted in higher product temperature, higher mass transfer driving force, faster drying rate and consequently shorter drying time. The results were in agreement with the studies of Abano et al. (2012) for tomato slices, Karaaslan and Tuncer (2008) for spinach, and Bal et al. (2010) for bamboo shoot slices.
0 2 4 6 8 10
0 500 1000 1500
M
oi
st
ur
e
co
nt
en
t (
kg
w
at
er/
kg
DM
)
Drying time (s)
180 W 360 W 600 W 800 W
0.00 0.01 0.02 0.03 0.04 0.05 0.06
0 2 4 6 8 10
D
ry
ing r
at
e (kg
w
at
er/kg DM)
Moisture content (kg water/kg DM) 180 W
[image:4.595.65.531.124.278.2]360 W 600 W 800 W
Figure 1. Drying curves of bean slices at different
[image:4.595.320.525.591.729.2]micro-wave powers Figure 2. Drying rate curves of green bean slices at diffe-rent microwave powers Table 1.Models employed for fitting of experimental data
Models Equation Reference
Lewis MR = exp(–kt) Hossain et al. (2007) Henderson and Pabis MR = a exp(–kt) Chinenye et al. (2010) Logarithmic MR = a exp(–kt) + c Akpinar & Bicer (2008) Verma et al. MR = a exp(–kt) + (1 – a)exp(–gt) Verma et al. (1985) Page MR = a exp(–ktn) Aghbashlo et al. (2011)
Midilli et al. MR = a exp(–ktn) + b
1 Krishna Murthy & Manohar (2012) Parabolic MR = a + bt + ct2 Tunde-Akintunde & Ogunlakin (2013). Wang and Singh MR = 1 + bt + ct2 Mujić et al. (2014)
Weibull MR = exp
(
–(
t)
a)
b Corzo et al. (2008)
[image:4.595.69.274.592.730.2]Drying rate. The values of the drying rate of green bean slices were calculated using Eq. (2). Figure 2 depicts the drying rate variation versus the drying time of green bean slices under different microwave power. The constant drying rate period is absent in the microwave drying of bean slices and the drying process took place in the falling rate period. Results of the present study were similar to the previous find-ings for different foodstuffs (Kayisoglu & Ertekin 2011; Balbay & Sahin 2012; Krishna Murthy & Manohar 2012). From Figure 2, the drying rates increased with the increasing microwave power. This means that the heat and mass transfer at high power is higher and the water loss is rather excessive. During the drying process, drying rates were higher at the beginning of the process, and after that they decreased with a decrease of moisture content in the samples. The reason for a reduction of drying rate might be due to a reduction in the porosity of samples due to shrinkage with advancement, which increased the resistance to water movement leading
to a further fall in drying rates (Singh et al. 2006; Doymaz et al. 2015).
Effective moisture diffusivity. The variation of
ln (MR) against drying time for bean slices dried at 180, 360, 600, and 800 W is shown in Figure 3. The determined values of the effective moisture diffusiv-ity are shown in Figure 4 and were found to range between 1.387 × 10⁻⁸ and 3.724 × 10⁻⁸ m2/s at
mi-crowave power of 180–800 W. It can be seen that Deff
values increased greatly with increasing microwave power. This can be so because the increase in micro-wave power caused a rapid rise in the temperature of samples, which in turn increased the vapour pressure. Drying at 800 W has the highest value of effective moisture diffusivity and the lowest value was obtained at 180 W. The calculated effective diffusivity values are within the general range of 10–12 to 10–8 m2/s for
drying of agricultural products (Zogzas et al. 1996). These values are in fact consistent with those in lit-erature, for example 1.26 × 10⁻⁹ to 3.32 × 10⁻⁹ m/s
for hot-air drying of bean slices (Senadeera et al. 6.172 ±0.015
7.297 ±0.017 7.457 ±0.016
8.551 ±0.013
0 2 4 6 8 10
180 W 360 W 600 W 800 W
Reh
ydra
tion ra
tio
(kg
w
at
er/kg
DM)
[image:5.595.308.530.105.252.2]Microwave power
Figure 3. Rehydration ratio values of samples at different microwave powers
56.25 ±0.05
44.08 ±0.04 44.40±0.04 45.57 ± 0.05 47.62 ±0.06
–11.37 ±0.03
–0.27± 0.01 –0.78 ±0.02 –1.37 ± 0.01–4.01±0.053
18.13 ±0.04
10.86 ± 0.03 12.15±0.03 12.82±0.03 14.15±0.04
–20 –10 0 10 20 30 40 50 60
Fresh 180 360 600 800
Colour
v
alu
es
Microwave power (W)
[image:5.595.66.284.112.249.2]L* a* b*
Figure 4. Colour values of samples at different microwave powers
0.0 0.2 0.4 0.6 0.8 1.0 1.2
0.0 0.2 0.4 0.6 0.8 1.0 1.2
Pr
edic
te
d
MR
Experimental MR
180 W 360 W 600 W 800 W
–6 –5 –4 –3 –2 –1 0 1
0 500 1000 1500
ln (
MR
)
Drying time (s)
180 W 360 W 600 W 800 W
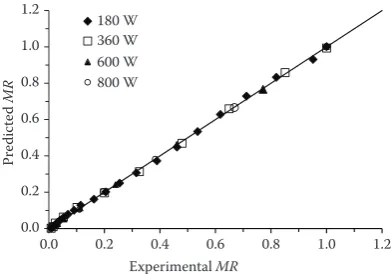
Figure 6. Comparison of experimental and predicted moisture ratio for green bean slices drying using the Midilli et al. model Figure 5. Variation of ln (MR) versus drying time for the
[image:5.595.309.525.591.730.2] [image:5.595.72.268.594.731.2]2003), 9.3 × 10⁻¹¹ to 1.06 × 10⁻⁹ m/s for convective
drying of Lima bean (Da Silva et al. 2009), 0.35 × 10⁻¹⁰ to 1.01 × 10⁻¹⁰ m/s for hot-air drying of bean
slices (Rossello et al. 1997), 3.04 × 10⁻⁹ to 2.64 ×
10–8 m2/s for fixed and semi-fluidised drying of faba
bean (Chayjan & Shadidi 2014), and 2.8 × 10⁻¹¹
to 8.7 × 10⁻¹¹ m/s for hot-air drying of fresh green
bean (Abbasi Souraki & Mowla 2008). The effect of microwave power on effective moisture diffusivity is defined by the following equation:
Deff = 3 × 10–11 P – 1 × 10⁻⁸
(R2 = 0.7871) (12)
Activation energy. The activation energy can be
determined from the slope of Arrhenius plot, ln (Deff) versus m/P(Eq. 9). The ln (Deff) as a function of the sample weight/microwave power was plotted in Fig-ure 5. The slope of the line is (–Ea) and the intercept equals to ln (D0). The results show a linear relationship due to Arrhenius type dependence. Eq. (13) shows the effect of sample weight/microwave power on Deff
of samples with the following coefficients:
Deff = 5.189 × 10⁻⁸ exp
(
–19185 m)
(R2 = 0.9662) (13) P
The estimated values of D0 and Ea from modified Arrhenius type exponential Eq. (13) are 5.189 ×
10–8 m2/s and 19.185 kW/kg, respectively.
Rehydration characteristics. One of the quality
indicators was the rehydration ability of dried bean slices. The drying process causes some changes in the material structure, and thus influences the renewed absorption of water. Rehydration, as a reverse process to drying, shows the degree of structural damage of the dried material (Kowalski & Szadzińska 2014). The results for the rehydration ratio were calculated from Eq. (9) and plotted against microwave power, as shown in Figure 6. The value of the rehydration
ratio was found to increase slightly with an increase in microwave power. The rehydration ratio of samples dried at 800 W was higher than those of samples at the other power settings. It may be due to a short drying time at this power output, which implies that this microwave power causes lower structural damage of the tissue. Thus, the green beans dried at this micro-wave power retained a higher amount of water than those of dried at the other microwave power settings.
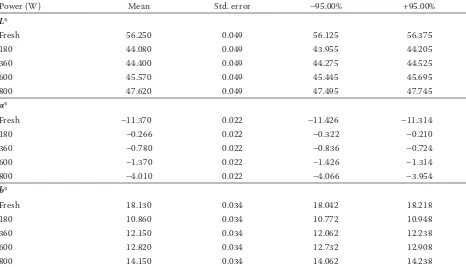
Colour values. Colour change is a quality criterion for assessing the quality of dried products. The results of the colour parameters in fresh beans and obtained from the microwave drying process are presented in Figure 7 for L*, a*, and b*. The chromatic param-eters L*, a*, and b* of green beans were L* 56.250;
a* –11.370; b* 18.130, respectively. The L* and b* values of all dried samples decreased significantly in comparison with the fresh green beans. On the contrary, a* values increased. The L* values, which show the lightness of the product, ranged between 56.250 and 44.080. The lowest L* value was evaluated for a dried product at 180 W because of the Maillard reaction caused by a long drying time. The differ-ences in L* values between the different settings of drying power were found statistically significant. For microwave drying, the highest –a* value (less degradation in –a* value) was observed at 800 W drying. It may be due to a short drying time at this power output, hence the greenness colour of green beans is preserved. The b* values were found between 18.130 and 14.130 for fresh and dried samples at 800 W, respectively.
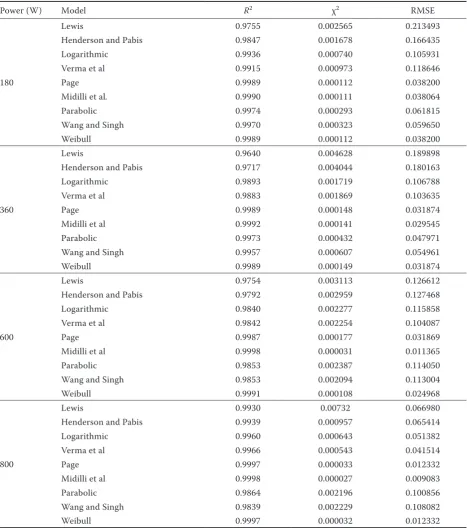
Models evaluation and results of statistical
analysis. The experimental moisture loss was
fit-ted to nine thin-layer models as shown in Table 1. The best model was selected based on the high-est R2 and the lowest χ2, and RMSE values. The
y= 3E-11x+ 1E-08
R² = 0.7871
0.00E+00 1.00E-08 2.00E-08 3.00E-08 4.00E-08
0 200 400 600 800 1000
Deff
(m
2/s)
Microwave power (W)
y= –19185x– 16.774
R² = 0.9662
–19.0 –18.6 –18.2 –17.8 –17.4 –17.0
0 0.00002 0.00004 0.00006 0.00008
ln
(
Deff
)
[image:6.595.65.286.91.233.2]m/p (kg/W)
Figure 7. Effective moisture diffusivity versus microwave powers
[image:6.595.314.521.107.233.2]performance of these models is shown in Table 2. The R2 values ranged from 0.9640 to 0.9998, and χ2
and RMSE values from 0.000027 to 0.004628 and 0.009083 to 0.213493, respectively. The Midilli et al. model was found to represent the drying kinet-ics of green bean slices with high R2 values and low
χ2, and RMSEvalues for all microwave powers. To
validate the selected model, plots of experimental
MR and predicted MR by Midilli et al. model are shown in Figure 8. Obviously, a good agreement was observed between experimental and predicted
[image:7.595.64.532.234.763.2]MR values. It means that the data points generally banded around a 45° straight line on the plots. This trend provides extra evidence for the suitability of
Table 2. Statistical results obtained from the selected drying models
Power (W) Model R2 χ2 RMSE
180
Lewis 0.9755 0.002565 0.213493
Henderson and Pabis 0.9847 0.001678 0.166435
Logarithmic 0.9936 0.000740 0.105931
Verma et al 0.9915 0.000973 0.118646
Page 0.9989 0.000112 0.038200
Midilli et al. 0.9990 0.000111 0.038064
Parabolic 0.9974 0.000293 0.061815
Wang and Singh 0.9970 0.000323 0.059650
Weibull 0.9989 0.000112 0.038200
360
Lewis 0.9640 0.004628 0.189898
Henderson and Pabis 0.9717 0.004044 0.180163
Logarithmic 0.9893 0.001719 0.106788
Verma et al 0.9883 0.001869 0.103635
Page 0.9989 0.000148 0.031874
Midilli et al 0.9992 0.000141 0.029545
Parabolic 0.9973 0.000432 0.047971
Wang and Singh 0.9957 0.000607 0.054961
Weibull 0.9989 0.000149 0.031874
600
Lewis 0.9754 0.003113 0.126612
Henderson and Pabis 0.9792 0.002959 0.127468
Logarithmic 0.9840 0.002277 0.115858
Verma et al 0.9842 0.002254 0.104087
Page 0.9987 0.000177 0.031869
Midilli et al 0.9998 0.000031 0.011365
Parabolic 0.9853 0.002387 0.114050
Wang and Singh 0.9853 0.002094 0.113004
Weibull 0.9991 0.000108 0.024968
800
Lewis 0.9930 0.00732 0.066980
Henderson and Pabis 0.9939 0.000957 0.065414
Logarithmic 0.9960 0.000643 0.051382
Verma et al 0.9966 0.000543 0.041514
Page 0.9997 0.000033 0.012332
Midilli et al 0.9998 0.000027 0.009083
Parabolic 0.9864 0.002196 0.100856
Wang and Singh 0.9839 0.002229 0.108082
the model to forecast the drying characteristics of green bean slices (Doymaz et al. 2015).
The rehydration ratio and the results of colour statistical analysis conducted by one-way ANOVA are shown in Table 3 and 4, respectively.
CONCLUSIONS
In this study, the drying characteristics of green beans were investigated in a microwave oven at differ-ent microwave powers. The drying process took place in the falling-rate period. The drying time decreased with an increase in the microwave power. The Midilli et al. model gave the best results and showed good agreement with experimental data obtained from the experiments. The effective moisture diffusivity varied between 1.387 × 10⁻⁸ and 3.724 × 10⁻⁸ m2/s
over the microwave power range. Activation energy was found to be 19.185 kW/kg. It was observed that
an increase in the microwave power increased the brightness and yellowness of the dried samples. The greenness of the samples dried at various micro-wave power settings decreased with increasing the microwave power.
References
Abano E.E., Ma H., Qu W. (2012): Influence of combined mi-crowave-vacuum drying on drying kinetics and quality of dried tomato slices. Journal of Food Quality, 35: 159–168. Abbasi Souraki B., Mowla D. (2008): Drying behavior of
fresh green beans in an inert medium fluidized bed. Jour-nal of Food Processing and Preservation, 32: 697–718. Aghbashlo M., Kianmehr M.H., Khani S., Ghasemi M.
(2011): Modelling the carrot thin-layer drying in a semi-industrial continuous band dryer. Czech Journal of Food Sciences, 29: 528–538.
[image:8.595.64.530.124.197.2]Akpinar A.K., Bicer Y. (2008): Mathematical modeling of thin layer drying process of long green pepper in solar Table 3.Rehydration ratio (RR) and statistical analysis conducted by one-way ANOVA
Power (W) Mean Std. error –95.00% +95.00%
180 6.172 0.018 6.124 6.221
360 7.297 0.018 7.249 7.346
600 7.457 0.018 7.409 7.506
800 8.551 0.018 8.503 8.600
Table 4.Statistical analysis conducted by one-way ANOVA
Power (W) Mean Std. error –95.00% +95.00%
L*
Fresh 56.250 0.049 56.125 56.375
180 44.080 0.049 43.955 44.205
360 44.400 0.049 44.275 44.525
600 45.570 0.049 45.445 45.695
800 47.620 0.049 47.495 47.745
a*
Fresh –11.370 0.022 –11.426 –11.314
180 –0.266 0.022 –0.322 –0.210
360 –0.780 0.022 –0.836 –0.724
600 –1.370 0.022 –1.426 –1.314
800 –4.010 0.022 –4.066 –3.954
b*
Fresh 18.130 0.034 18.042 18.218
180 10.860 0.034 10.772 10.948
360 12.150 0.034 12.062 12.238
600 12.820 0.034 12.732 12.908
[image:8.595.65.531.226.493.2]dryer and under open sun. Energy Conversion and Man-agement, 49: 1367–1375.
Al-Harahsheh M., Al-Muhtaseb A.H., Magee T.R.A. (2009): Microwave drying kinetics of tomato pomace: Effect of osmotic dehydration. Chemical Engineering and Process-ing, 48: 524–531.
Alibas Ozkan I., Akbudak B., Akbudak N. (2007): Micro-wave drying characteristics of spinach. Journal of Food Engineering, 78: 577–583.
AOAC (1990): Official method of analysis. Arlington, As-sociation of Official Analytical Chemists.
Balbay A., Sahin O. (2012): Microwave drying kinetics of a thin-layer liquorice root. Drying Technology, 30: 859–864.
Bal L.M., Kar A., Satya S., Naik S.N. (2010): Drying kinetics and effective moisture diffusivity of bamboo shoot slices undergoing microwave drying. International Journal of Food Science and Technology, 45: 2321–2328.
Bilbao-Sáinz C., Andrés A., Chiralt A., Fito P. (2006): Mi-crowaves phenomena during drying of apple cylinders. Journal of Food Engineering, 74: 160–167.
Bondaruk J., Markowski M., Błaszczak W. (2007): Effect of dry-ing conditions on the quality of vacuum-microwave dried potato cubes. Journal of Food Engineering, 81: 306–312. Boudhrioua N., Giampaoli P., Bonazzi C. (2003): Changes in
aromatic components of banana during ripening and air-drying. LWT-Food Science and Technology, 36: 633–642. Bouraout M., Richard P., Durance T. (1994): Microwave
and convective drying of potato slices. Journal of Food Process Engineering, 17: 353–363.
Calín-Sánchez A., Figiel A., Wojdylo A., Szaryez M., Car-bonell-Barrachina A.A. (2014): Drying of garlic slices using convective pre-drying and vacuum-microwave finishing drying: Kinetics, energy consumption, and qual-ity studies. Food and Bioprocess Technology, 7: 398–408. Chayjan R.A., Shadidi B. (2014): Modeling high-moisture
Faba bean drying in fixed and semi-fluidized bed condi-tions. Journal of Food Processing and Preservation, 38: 200–211.
Chinenye N.M., Ogunlowo A.S., Olukunle O.J. (2010): Co-coa bean (Theobroma cacao L.) drying kinetics. Chilean Journal of Agricultural Research, 70: 633–639.
Corzo O., Bracho N., Pereira A., Vásquez A. (2008): Weibull distribution for modelling air drying of coroba slices. LWT-Food Science and Technology, 41: 2023–2028. Crank J. (1975): The Mathematics of Diffusion. London,
Oxford University Press.
da Silva W.P., Precker J.W., de Lima A.G.B. (2009): Drying kinetics of Lima bean (Phaseolus lunatis L.) experimen-tal determination and prediction by diffusion models. International Journal of Food Engineering, 5(3): Article 9.
Dadali G., Apar D.K., Ozbek B. (2007): Estimation of effective moisture diffusivity of okra for microwave drying. Drying Technology, 43: 1443–1451.
Darvishi H., Azadbakht M., Rezaeiasl A., Farhang A. (2013): Drying characteristics of sardine fish dried with microwave heating. Journal of the Saudi Society of Agricultural Sci-ences, 12: 121–127.
Doymaz I., Ismail O. (2011): Drying characteristics of sweet cherry. Food and Bioproducts Processing, 89: 31–38. Doymaz I., Kipcak A.S., Piskin S. (2015): Characteristics of
thin-layer infrared drying of green bean. Czech Journal of Food Sciences, 33: 83–90.
Falade K., Ogunwolu O.S. (2014): Modeling of drying patterns of fresh and osmotically pretreated cooking banana and plantain slices. Journal of Food Processing and Preserva-tion, 38: 373–388.
Feng H., Tang J., Mattinson D.S., Fellman J.K. (1999): Micro-wave and spouted bed drying of frozen blueberries: the effect of drying and pretreatment methods on physical properties and retention of flavor volatiles. Journal of Food Processing and Preservation, 23: 463–479.
Funebo T., Ohlsson T. (1998): Microwave-assisted air dehydra-tion of apple and mushroom. Journal of Food Engineering, 38: 353–367.
Giri S.K., Prasad S. (1998): Drying kinetics and rehydration characteristics of microwave-vacuum and convective hot-air dried mushrooms. Journal of Food Engineering,78: 512–521.
Hossain M.E., Woods J.L., Bala B.K. (2007): Single-layer drying characteristics and colour kinetics of red chilli. International Journal of Food Science and Technology, 42: 1367–1375. Kahyaoglu L.N., Sahin S., Sumnu G. (2012): Spouted bed and
microwave-assisted spouted bed drying of parboiled wheat. Food & Bioproducts Processing, 90: 301–308.
Karaaslan S.N., Tuncer I.K. (2008): Development of a drying model for combined microwave-fan-assisted convection drying of spinach. Biosystems Engineering, 100: 44–52. Kayisoglu S., Ertekin C. (2011): Vacuum drying kinetics of
barbunya bean (Phaseolusvulgaris L. elipticus Mart.). The Philippine Agricultural Scientist, 94: 285–291.
Kouchakzadeh A., Shafeei S. (2010): Modeling of microwave-convective drying of pistachios. Energy Conversion and Management, 51: 2012–2015.
Kowalski S.J., Szadzińska J. (2014): Kinetics and quality aspects of beetroots dried in non-stationary conditions. Drying Technology, 32: 1310–1318.
Lin T.M., Durance T.D., Scaman C.H. (1998): Characteri-zation of vacuum microwave air and freeze dried carrot slices. Food Research International, 4: 111–117. Maskan M. (2001): Drying, shrinkage and rehydration
char-acteristics of kiwifruits during hot air and microwave drying. Journal of Food Engineering, 48: 177–182. Mujić I., Kralj M.B., Jokić S., Jug T., Šubarić D., Vidović S.,
Živković J., Jarni K. (2014): Characterisation of volatiles in dried white varieties figs (Ficuscarica L.). Journal of Food Science and Technology, 51: 1837–1846.
Prothon F., Ahrne L.M., Funebo T., Kidman S., Langton M., Sjoholm I. (2001): Effects of combined osmotic and mi-crowave dehydration of apple on texture, microstructure and rehydration characteristics. LWT-Food Science and Technology, 34: 95–101.
Pulıgundla P., Abdullah S.A., Choı W., Jun S., Oh S.E., Ko S. (2013). Potentials of microwave heating technology for select food processing applications – a brief overview and update. Journal of Food Processing & Technology, 4: 278. Raghavan G.S.V., Silveira A.M. (2001): Shrinkage char-acteristics of strawberries osmotically dehydrated in combination with microwave drying. Drying Technology, 19: 405–414.
Ren G., Chen F. (1998): Drying of American ginseng panax quinquefolium roots by microwave-hot air combination. Journal of Food Engineering, 35: 433–443.
Rossello C., Simal S., Sanjuan N., Mulet A. (1997): Noniso-tropic mass transfer model for green bean drying. Journal of Agricultural and Food Chemistry, 45: 337–342. Sanga E., Mujumdar A.S., Raghavan G.S.V. (2000):
Princi-ples and application of microwave drying. In: Mujumdar A.S. (ed.): Drying Technology in Agriculture and Food Sciences. Enfield, Science Publishers.
Secmeler O. (2003): Comparison of microwave drying and microwave mixed-bed drying of red peppers. [M.Sc. Thesis.] Ankara, Middle East Technical University. Senadeera W., Bhandari B., Young G., Wijesinghe B. (2000):
Physical properties and fluidization behaviour of fresh green bean particulates during fluidized bed drying. Food and Bioproducts Processing, 78: 43–47.
Sharma G.P., Prasad S. (2006): Optimization of process parameters for microwave drying of garlic cloves. Journal of Food Engineering, 75: 441–446.
Singh B., Panesar P.S., Nanda V. (2006): Utilization of car-rot pomace for the preparation of a value added product. World Journal of Dairy & Food Sciences, 1: 22–27. Tulasidas T.N., Raghavan G.S.V., Norris E.R. (1996): Effects
of dipping and washing pre-treatments on microwave drying of gapes. Journal of Food Process Engineering, 19: 15–25.
Tunde-Akintunde T.Y., Ogunlakin G.O. (2013): Mathematical modeling of drying of pretreated and untreated pumpkin. Journal of Food Science and Technology, 50: 705–713. Ulloa J.A., Bonilla-Sánchez C.R., Ortíz-Jiménez M.A.,
Ro-sas-Ulloa P., Ramírez-Ramírez J.C., Ulloa-Rangel B.E. (2013): Rehydration properties of precooked whole beans (Phaseolus vulgaris) dehydrated at room temperature. CyTA – Journal of Food, 11: 94–99.
Vega-Gálvez A., Puente-Díaz L., Lemus-Mondaca R., Mi-randa M., Torrres M.J. (2014): Mathematical modelling of thin-layer drying kinetics of Cape gooseberry (Physalis peruviana L.). Journal of Food Processing and Preserva-tion, 38: 728–736.
Verma L.R., Bucklin R.A., Endan J.B., Wratten F.T. (1985): Effects of drying air parameters on rice drying models. Transaction of the ASAE, 28: 296–301.
Vijayavenkataraman S., Iniyan S., Goic R. (2012): A review of solar drying technologies. Renewable & Sustainable Energy Review, 16: 2652–2670.
Yongsawatdigul J., Gunasekaran S.F. (1996): Microwave-vacuum drying of cranberries: Part II. Quality evalua-tion. Journal of Food Processing and Preservation, 20: 145–156.
Zielinska M., Zapotoczny P., Alves-Filho O., Eikevik T.M., Blaszczak W. (2013): A multi-stage combined heat pump and microwave vacuum drying of green peas. Journal of Food Engineering, 115: 347–356.
Zogzas N.P., Maroulis Z.B., Marinos-Kouris D. (1996): Moisture diffusivity data compilation in foodstuffs. Dry-ing Technology, 14: 2225–2253.
Received: 2014–09–29 Accepted after corrections: 2014–11–20
Corresponding author: