The increasing concentration of CO2 in atmos-phere is caused by anthropogenic emission and human activities (Houghton et al. 2001). The
in-crease in CO2 was about 64 ppm (Krull et al. 2005)
during the last fifty years (1953 to 2003) and it has affected the plant growth and photosynthesis. Most of the relevant studies focused on the effects of
CO2 enrichment on biomass accumulation in plants
(Drake et al. 1997). Kimball (1983, 1986), Kimball
et al. (2002) and Poorter (1993) on the basis of their evaluation of several hundreds of studies of this kind showed an average increment in biomass production
in C3 plants more in response to a doubling of CO2
concentrations. Cure (1985) and Cure and Acock (1986) conducted a literature survey and tabulated
the results of a doubling of CO2 on the response of
10 major agricultural crops under 550 µmol/mol
CO2 and they reported yield increase of wheat, rice,
cotton and potato by 19, 8, 113 and 28%, respectively.
Because of the economic importance, over the past century there were numerous observations on the
effects of elevated CO2 and yield of agricultural
crops (Kimball 1986). However, with impending global change and the need to secure food supplies
for the future, several CO2 enrichment experiments
have concentrated on agricultural crops, with yield serving as an important economic parameter.
The pulse crops showed a better response to
elevated CO2 levels. Earlier studies with cowpea
grown in controlled environmental chambers showed positive growth responses to elevated
CO2 (Mbikayi et al. 1983). Greengram grown under
CO2 enrichment was taller and attained a greater
leaf area along with dry matter than ambient CO2
grown plants at initial growth stages (Srivastava
et al. 2001). Under elevated CO2 (600 ppm) and
well-watered conditions the response of blackgram at initial growth stages was higher than sorghum
Effect of elevated atmospheric CO
2
concentrations
on growth and yield of blackgram (
Vigna mungo
L. Hepper)
– a rainfed pulse crop
M. Vanaja, P. Raghuram Reddy, N. Jyothi Lakshmi, M. Maheswari, P. Vagheera,
P. Ratnakumar, M. Jyothi, S.K. Yadav, B. Venkateswarlu
Central Research Institute for Dryland Agriculture, Santhoshnagar, Hyderdabad, India
ABSTRACT
The response of blackgram (Vigna mungo L. Hepper) to two levels of elevated carbon dioxide (550 and 700 ppm) in terms of growth and yield was investigated and compared with ambient CO2 level (365 ppm) using open-top chambers. The growth parametersviz., length and weight of root and shoot, root:shoot ratio, leaf area and weight significantly increased at 700 ppm CO2 when compared with 550 ppm. The percentage increase in total biomass at 700 and 550 ppm CO2 was 65.4% and 39%, respectively compared to the ambient (chamber) control. The increase in total seed yield at 700 ppm (129%) was due to an increase in number of pods per plant and 100 seed weight, where-as at 550 ppm (88.7%) it wwhere-as due to an increwhere-ased number of pods/plant and seeds/pod. The results indicate variable responsive effects at different levels of CO2 emphasizing the pertinence of research on elevated CO2 in various ag-roecological inhabitations all over the world. The indication of higher responses for root and leaf at initial growth stages at the higher elevated level of CO2 (700 ppm), which leads to better root establishment, achieving early pho-tosynthetic efficiency and also better biomass production, and its improved partitioning can be reckoned as a posi-tive aspect of increasing concentrations of CO2 in atmosphere. The harvest index increased significantly to 35.7 and 38.4% at 550 and 700 ppm, respectively; it is a very important phenomenon in pulses for breaking the yield barrier.
Keywords: elevatedcarbon dioxide; blackgram; growth; yield; open-top chambers
and sunflower (Vanaja et al. 2006b). Blackgram [Vigna mungo (L.) Hepper] is an important source of protein and is cultivated as short duration rainfed crop in semiarid areas of South Asian countries. An attempt was made in this paper to quantify the
response of blackgram to two enhanced CO2 levels
(550 and 700 ppm) in terms of growth and yield.
MATERIAL AND METHODS
Experimental conditions and plant material
The seeds of blackgram cv. T-9 were sown in six open-top chambers (OTCs) lined with transparent PVC sheet each having 3 m × 3 m with 3 m height. The seeds were sown directly in the soil (Alfisol) to study the plant growth and yield responses to
two elevated CO2 levels, i.e. 550 ppm and 700 ppm
and ambient (365 ppm) level. Each chamber had four 1 m × 1 m plots with five rows and minimally ten plants in each row were maintained. The ex-perimental site was sandy loam in texture, neutral in pH (6.8), low in available nitrogen (225 kg/ha), phosphorus (10 kg/ha) and medium to high in
available potassium (300 kg K2O/ha).
To maintain the elevated levels of CO2
concen-tration in OTCs to 550 ppm and 700 ppm at crop
canopy level, continuous injecting of 100% CO2
into plenum of OTCs was done where it was mixed with air from air compressor before entering into the chamber. The air sample from each chamber was drawn from the center point of OTC at three-minute interval into a non – dispersive infrared
(NDIR) CO2 analyzer (California Analytical) and the
set level of CO2 concentration was maintained with
the help of solenoid valves, rotameters, Program Logic Control (PLC) and Supervisory Control and Data Acquisition (SCADA) software. Throughout the experimental period continuous measurements of relative humidity and temperature were possible with the sensors fitted inside the chambers (Vanaja et al. 2006a). The temperature of the chambers
with elevated CO2 remained the same as in the
ambient air chambers but 1–2°C higher than in the outside field. The light intensity in the chambers was 80–85% of the outside field; however gentle washing of polythene cover was frequently required to maintain transparency. Plants were maintained stress-free by irrigation and by application of recommended doses of fertilizers.
For each treatment two OTCs were maintained, i.e. two OTCs at 550 ppm and two OTCs at 700 ppm.
The elevated levels of CO2 were maintained 24 h
a day from the sowing to final sampling. Two OTCs
were at ambient CO2 level (365 ppm) without
any external CO2 supply and served as chamber
control (Ch-control).
Plant growth measurements
The plant growth observations were recorded at 7, 14, 21, 28, 45 and 60 days after sowing (DAS), two replications from each chamber consisting of three plants for each replication, i.e. four replica-tions with twelve plants for each treatment were harvested by uprooting the plants carefully. The roots were made free from soil particles by gentle washing with water and the plants were separated into roots, stems and leaves. The length of root and shoot was recorded and root volume of plant roots (as ml of water displaced) was expressed as ml/10 plants. The total leaf area at different time intervals was measured with photo-electronic leaf area meter (LI-3100, LI-COR) and expressed
as cm2/10 plants. Dry weights of stem, root and
leaf were recorded after drying the plant parts at 80°C for 48 hours in an oven till constant weights were attained. Specific leaf weight and root:shoot ratio were calculated with the recorded values. The percentage increment of each parameter at different growth stages was calculated for 700 ppm and 550 ppm over chamber control and also for
the differences in response to an increase of CO2
level from 550 to 700 ppm.
Final harvest and yield
Yield measurements were made after final har-vest at 90 DAS and ten plants per replication were harvested to record the yield and yield components of each treatment. Number of pods, pod weight and seed weight were recorded and expressed as g/10 plants. The data were statistically analyzed using a two-way analysis of variance (ANOVA) to test the significance of treatments, conditions and their interactions.
RESULTS
Plant growth analysis
Blackgram showed a positive growth response to
elevated CO2 levels in terms of root length, shoot
was also observed that the response to enhanced
CO2 level was higher at 700 ppm than at 550 ppm
for all the characters studied.
The ANOVA for shoot length, root length and root shoot ratio was significant for time intervals and conditions, whereas for leaf area, leaf dry weight, shoot dry weight, root dry weight and total dry weight the conditions, time intervals and their interaction were found highly signifi-cant (Table 1).
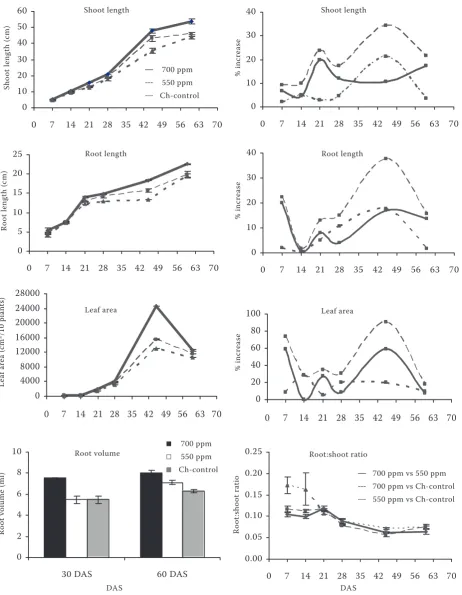
Shoot length recorded significant increase with
enhanced CO2 levels and the values at 700 ppm
were higher than at 550 ppm. The increment in
shoot length varied from 9 to 34% with 700 ppm, 2 to 21% with 550 ppm at different growth stages when compared with the chamber control and the maximum response was recorded at 45 DAS
for both elevated CO2 concentrations (Figure 1).
The increased response of shoot length due to
CO2 level enhanced from 550 ppm to 700 ppm
showed a different trend, and the response was highest at 21 DAS (19.9%). The stem dry weight increased about 4 to 23% under 550 ppm and
about 7 to 80% with 700 ppm of CO2 level at
dif-ferent growth stages above the chamber control values (Figure 2) and the maximum response was at 28 DAS at 700 ppm, 550 ppm and also in case
of the increment in CO2 level from 550 ppm to
700 ppm (46%).
The response of root length, root dry weight and root volume was positive and significant at
550 ppm and 700 ppm levels of CO2, as well. The
percentage increment of root length varied from 2 to 18% with 550 ppm between 7 and 60 DAS, whereas it was 22.5 to 38% under 700 ppm with a maximum response at 45 DAS (Figure 1). The
improved response due to CO2 concentration
in-creased from 550 to 700 ppm was more significant at initial growth stages (7 DAS). The root volume was measured at 30 and 60 DAS and the increase in root volume under 700 ppm was 39.5 and 23%, respectively; however, with 550 ppm the higher response was observed only at 60 DAS (10.8%)
and with the increase in CO2 from 550 to 700 ppm
the root volume increased by 37.5 and 13% during these days of observation. The root dry weight at 700 ppm was 9 to 61% higher than the chamber control at different growth stages, whereas the increment at 550 ppm was 3 to 30% (Figure 2). The maximum response was at 28 DAS for root dry weight in all the treatments.
The biggest leaf area was recorded at 45 DAS in all the treatments and the response was strong-est at 700 ppm followed by 550 ppm. The per-centage increase in leaf area ranged from 18 to 90% during 7 to 60 DAS at 700 ppm, whereas it was 5.4 to 28.6% at 550 ppm. The response
of leaf area to the increase in CO2 from 550 to
700 ppm was high at early stage of germination (59.4%) and also at 45 DAS (58.7%). The leaf dry weight response followed the trend of leaf area and at 45 DAS it reached the maximum in all the treatments. The response of leaf dry weight
to different levels of enhanced CO2 over
cham-ber control showed a different trend. At initial growth stages (up to 14 DAS) the response was
very high to both enhanced CO2 levels hence the
difference between 700 and 550 ppm CO2 level
[image:3.595.64.533.580.742.2]was not so significant. The trend was reversed after 28 DAS; a decreasing tendency showed at 550 ppm compared to Ch-control, whereas an upward trend was observed at 700 ppm.
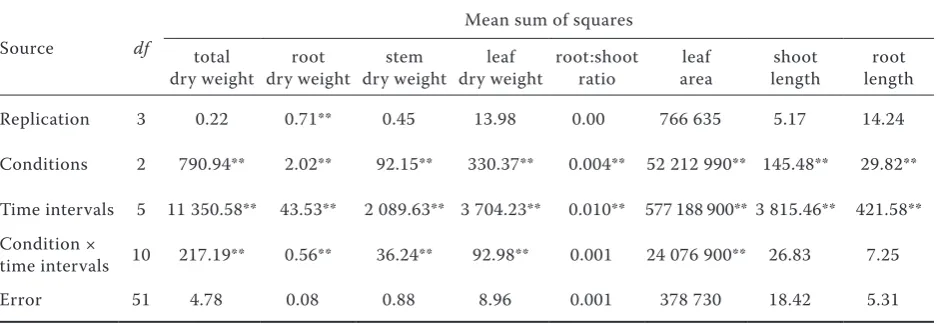
Table 1. ANOVA for various growth characters of blackgram and their response to elevated CO2 levels (550 and 700 ppm) and chamber control (365 ppm) at 60 DAS
Source df
Mean sum of squares total
dry weight dry weightroot dry weightstem dry weightleaf root:shoot ratio arealeaf lengthshoot lengthroot
Replication 3 0.22 0.71** 0.45 13.98 0.00 766 635 5.17 14.24
Conditions 2 790.94** 2.02** 92.15** 330.37** 0.004** 52 212 990** 145.48** 29.82**
Time intervals 5 11 350.58** 43.53** 2 089.63** 3 704.23** 0.010** 577 188 900** 3 815.46** 421.58** Condition ×
time intervals 10 217.19** 0.56** 36.24** 92.98** 0.001 24 076 900** 26.83 7.25
Error 51 4.78 0.08 0.88 8.96 0.001 378 730 18.42 5.31
0 4000 8000 12000 16000 20000 24000 28000
0 7 14 21 28 35 42 49 56 63 70
0 20 40 60 80 100
0 7 14 21 28 35 42 49 56 63 70
0 2 4 6 8 10
30 DAS 60 DAS
0.00 0.05 0.10 0.15 0.20 0.25
0 7 14 21 28 35 42 49 56 63 70
0 5 10 15 20 25
0 7 14 21 28 35 42 49 56 63 70
0 10 20 30 40
[image:4.595.70.533.56.652.2]0 7 14 21 28 35 42 49 56 63 70
Figure 1. The stem and root length, leaf area, root volume and root:shoot ratio of blackgram at different growth stages under elevated CO2 (700 ppm and 550 ppm) and ambient (365 ppm) conditions
The root:shoot ratio showed a different ten-dency. Under Ch-control condition the ratios were significantly higher at initial growth stages (up to 14 DAS), however the difference between treatments narrowed at later stages.
The total biomass showed a significant and posi-tive response at all the growth stages under
en-hanced levels of CO2, with much higher response
under 700 ppm (Figure 2). The percentage incre-ment in total biomass ranged from 2 to 31% at
Sh oo t l en gt h (c m ) Root length Ro ot le ng th (c m ) Leaf area Le af a re a (c m 2/1 0 pl an ts ) Ro ot v ol um e (m l)
Root volume Root:shoot ratio
% in cr ea se % in cr ea se Ro ot :s ho ot r at io DAS DAS Root length Leaf area
─ 700 ppm vs 550 ppm
┄ 700 ppm vs Ch-control
┈ 550 ppm vs Ch-control 0
10 20 30 40
0 7 14 21 28 35 42 49 56 63 70 0 10 20 30 40 50 60
0 7 14 21 28 35 42 49 56 63 70
Shoot length % in cr ea se Shoot length
─ 700 ppm
┄ 550 ppm
┈ Ch-control
■ 700 ppm
□ 550 ppm
550 ppm and from 28 to 70% at 700 ppm, and the highest response was recorded at 28 DAS for both
levels of CO2, whereas the response continued to
be high up to 45 DAS in the case of the increase
of the CO2 level from 550 to 700 ppm.
Yield and harvest index
All the yield parameters recorded a significant
increment at 550 and 700 ppm CO2 over chamber
control and also in the case of the increment in
CO2 concentration from 550 to 700 ppm. The
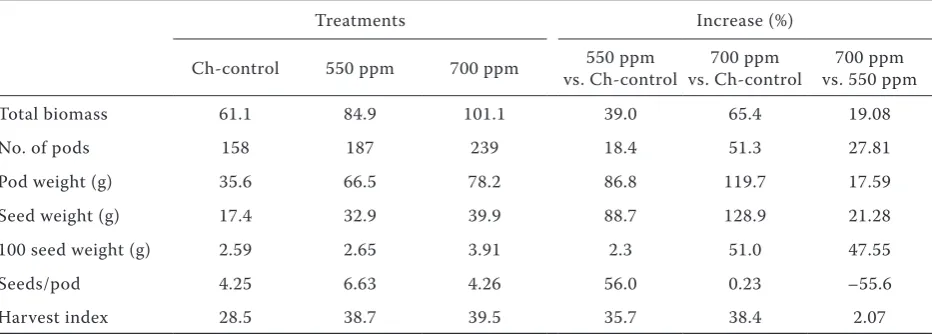
yield parameters viz., number of pods (18.4, 51.3, 27.8%), pod weight (86.8, 119.7, 17.6%), seed weight (88.7, 128.9, 21.3%) and 100 seed weight (2.3, 51,
47.6%) were increased under elevated CO2 levels
(550 ppm and 700 ppm) compared to the chamber control, as well as to the concentration increase of
CO2 from 550 to 700 ppm (Table 2). The number
of seeds/pods (56, 0.23, –55.6) showed a differ-ent response, as higher values were recorded at 550 ppm than at 700 ppm.
The total biomass and harvest index also
in-creased under elevated CO2 levels. The percentage
increase of biomass was 65% at 700 ppm and 39% at 550 ppm, whereas the harvest index recorded an increase of 38.7 and 39.5% at 550 ppm and 700 ppm, respectively, compared with the chamber control. However, the harvest index improved by
2% with 150 ppm increment in CO2 level above
550 ppm.
DISCUSSION
The growth and yield response of blackgram to
two elevated CO2 levels (550 and 700 ppm) was
found positively significant. The increased root length, root mass and root volume under elevated
CO2 levels implies the probability of deeper soil
penetration and spread to more volume of soil, which would be an advantage in a drier climate.
CO2 enrichment in general strongly enhanced the
root growth by increasing its length, volume and weight. Root volume was also increased under
elevated CO2 conditions due to more lateral roots
and root hair formation. The response level of these parameters at different growth stages varied as the crop growth progressed. At 700 ppm the high response was observed during germination stage (7 DAS) and also at 45 DAS; this was not the same at 550 ppm. This clearly indicates that
the increment in CO2 levels from 550 to 700 ppm
will be different and a shift in the response may be expected.
The shoot length also increased with enhanced
levels of CO2. The response with 550 and 700 ppm
CO2 showed a different pattern at different growth
stages. A high response was recorded in blackgram at 21 and 45 DAS with 700 ppm with a higher magnitude, whereas with 550 ppm it was only at 45 DAS. The stem dry weight showed increased
values at both levels of enhanced CO2 with a
simi-lar response pattern showing a high response at 28 DAS. The magnitude was very high with 700 ppm and there was more than 40% increase
in response to increasing CO2 level from 550 to
700 ppm.
The response of leaf area and leaf weight to two
levels of CO2 showed a different pattern even
though both enhanced CO2 levels recorded higher
values when compared with ambient level of Ch-control conditions. In case of the increment
of CO2 by 150 ppm from 550 to 700 ppm, a clear
shift in response pattern was observed. As it was noticed with root length, there was a significantly higher response of leaf area to 700 ppm at germina-tion level and also at 45 DAS, which was missing at 550 ppm. The response of leaf weight to both levels followed the same trend up to 28 DAS and thereafter it showed a reverse tendency. The in-crement in leaf area and leaf dry weight at higher
levels of CO2 could result from the level of CO2 at
later growth stage increased over 550 ppm, which significantly enlarged not only leaf area but also leaf weight.
The response of total biomass at both levels followed the same trend showing the maximum response at 28 DAS, which is coinciding with flower initiation. The magnitude of the response was maintained high till the end of the growth
period with 30 to 40% higher response to CO2
level increased from 550 to 700 ppm. The increase
in both stem and leaf growth with elevated CO2
caused an overall increase in total biomass in blackgram at initial stages of growth under irrigated conditions (Vanaja et al. 2006b). Similar reports
with Vigna radiata L. also showed an increase
in total biomass under elevated CO2 conditions
(Srivastava et al. 2001). The root:shoot ratios were
higher under ambient conditions compared with
elevated CO2 levels in blackgram and resulted
from a stronger response of shoot weight than root weight response.
The increased CO2 level in atmosphere not only
0 1 2 3 4 5 6
0 7 14 21 28 35 42 49 56 63 70 0 10 20 30 40 50 60 70
0 7 14 21 28 35 42 49 56 63 70
0 20 40 60 80 100
0 7 14 21 28 35 42 49 56 63 70
0 20 40 60 80
0 7 14 21 28 35 42 49 56 63 70
0 20 40 60 80 100
0 7 14 21 28 35 42 49 56 63 70
0 10 20 30 40 50
0 7 14 21 28 35 42 49 56 63 70
0 10 20 30 40 50
0 7 14 21 28 35 42 49 56 63 70
0 20 40 60 80 100
0 7 14 21 28 35 42 49 56 63 70
Figure 2. The stem, root, leaf dry weight and total biomass of blackgram at different growth stages under elevated CO2 (700 ppm and 550 ppm) and ambient (365 ppm) conditions
of soybean increased with CO2 enrichment as
re-ported by Heinemann et al. (2006). In the present study, the improvement in pod number, pod weight
and seed size was observed under CO2 enrichment.
It is interesting that the increased pod number
and number of seeds per pod at 550 ppm were caused by increased seed yield, whereas it was due to pod number and seed size at 700 ppm. Rogers and Dahlman (1993) have compiled a synopsis of dry matter production and yield increase of the
Sh oo t d ry w ei gh t ( g/ 10 p la nt
s) Stem dry weight
DAS Root dry weight
Ro ot d ry w ei gh t ( g/ 10 p la nt s) Le af d ry w ei gh t ( g/ 10 p la nt s) Total biomass To ta l b io m as s (g /1 0 pl an ts ) DAS % in cr ea se % in cr ea se % in cr ea se
Stem dry weight
Root dry weight
Leaf dry weight
Total biomass
─ 700 ppm
┄ 550 ppm
┈ Ch-control
─ 700 ppm vs 550 ppm
┄ 700 ppm vs Ch-control
┈ 550 ppm vs Ch-control
Leaf dry weight
%
in
cr
ea
ten most important crop species in response to
el-evated CO2. Their work shows that in some species
there was a relative increase in total biomass and in other studies it was economic yield which was greater. Prasad et al. (2002) reported that elevated
CO2 increased seed yield up to 24% in kidney bean
(Phaseolus vulgaris). The results obtained from the present study showed an increase in the dry mat-ter production as well as economic yield both at 550 and 700 ppm. The seed yield improved by 21%
with 150 ppm increase in CO2 from 550 to 700 ppm,
whereas the harvest index (HI) increased only by
2%. This clearly shows that the CO2 levels increased
above 550 ppm improve both biomass and economic yield. Thus it may be concluded that blackgram is
positively responding to increasing CO2 not only
for biomass but also for economic yield.
Acknowledgments
The authors acknowledge the encouragement and support of Dr. Y.S. Ramakrishna (Director, CRIDA).
REFERENCES
Cure J.D. (1985): Carbon dioxide doubling responses: a crop survey. In:Strain B.R., Cure J.D. (eds.):Direct Effect of Increasing Carbon dioxide on Vegetation, DOE/ER-0238. United States, Department of Energy, Washington, D.C: 99–116.
Cure J.D., Acock B. (1986): Crop responses to carbon di-oxide doubling: a literature survey. Agr. For. Meteorol., 38: 127–145.
Drake B.G., Gonzalez-Meler M.A., Long S.P. (1997): More efficient plants: a consequence of rising at-mospheric CO2? Ann. Rev. Plant Physiol. Plant Mol. Biol., 48: 609–639.
Heinemann A.B., Maia A.d.H.N., Dourado-Neto D., In-gram K.T., Hoogenboom G. (2006): Soybean [Glycine max (L.) Merr.] growth and development response to CO2 enrichment under different temperature regimes. Eur. J. Agron., 24: 52–61.
Houghton J.T., Ding Y., Griggs D.J., Noguer M., Van der Linden P.J., Xiaosu D. (eds.) (2001): Intergov-ernmental Panel on Climate Change. In: Climate Change 2001: the Scientific Basis. Cambridge Univ. Press.
IPCC (1996): Climate Change 1995: Summary for Pol-icy Makers and Technical Summary of the Working Group I. In: Houghton J.T., Meria Filho L.G., Cal-lander B.A., Harris N., Kattenburg A., Maskell K. (eds.): Intergovernmental Panel on Climate Change. Cambridge University press, Cambridge, UK. Kimball B.A. (1983): Carbon dioxide and agricultural
yield: An assemblage and analysis of 430 prior ob-servations. Agron. J., 75: 779–788.
Kimball B.A. (1986): Influence of elevated CO2 on crop yield. In: Enoch H.Z., Kimball B.A. (eds.): Carbon dioxide environment of green house crops. Vol. 2. Physiology Yield and Economics. CRC Press, Boca Raton, FL: 105–115.
Kimball B.A., Kobayashi K., Bindi M. (2002): Responses of agricultural crops to free- air CO2 enrichment. Adv. Agron., 77: 293–368.
[image:7.595.65.533.92.259.2]Krull E.S., Skjemstad J.O., Burrows W.H., Bray S.G., Wynn J.G., Bol R., Spouncer L., Harms B. (2005): Recent vegetation changes in central Queensland, Australia: Evidence from δ13C and 14C analyses of soil organic matter. Geoderma., 126: 241–259. Table 2. Yield parameters of blackgram (for 10 plants) under elevated CO2 levels of 550 and 700 ppm over the chamber control (365 ppm)
Treatments Increase (%)
Ch-control 550 ppm 700 ppm vs. Ch-control550 ppm vs. Ch-control700 ppm vs. 550 ppm700 ppm
Total biomass 61.1 84.9 101.1 39.0 65.4 19.08
No. of pods 158 187 239 18.4 51.3 27.81
Pod weight (g) 35.6 66.5 78.2 86.8 119.7 17.59
Seed weight (g) 17.4 32.9 39.9 88.7 128.9 21.28
100 seed weight (g) 2.59 2.65 3.91 2.3 51.0 47.55
Seeds/pod 4.25 6.63 4.26 56.0 0.23 –55.6
Mbikayi N.T., Hileman D.R., Bhattacharya N.C., Ghosh P.P., Biswas P.K. (1983): Effect of CO2 enrichment on physiology and biomass production in cowpea (Vigna unguiculata L.) grown in open top chambers. In: Proc. Int. Congr. Plant Physiology, New Delhi: 640–645. Poorter H. (1993): Interspecific variation in the growth
response of plants to an elevated ambient CO2 concen-tration. In: Rozema J., Lambers H., Van De Geiji S.C., Cambridge M.L. (eds.): CO2 and Biosphere. Kluwer Acad. Publ., Dordrecht, Netherlands: 77–97.
Prasad P.V.V., Kenneth J.B., Allen J.R.H., Thomas M.G.J. (2002): Effects of elevated temperature and carbon di-oxide on seed-set and yield of kidney bean (Phaseolus vulgaris L.). Global Change Biol., 8: 710–721. Rogers H.H., Dahlman R.C. (1993): Crop responses
to CO2 enrichment. In: Rozema J., Lambers H., Van De Geiji S.C., Cambridge M.L. (eds.): CO2 and
Bio-sphere. Kluwer Acad. Publ., Dortrecht, Netherlands: 117–132.
Srivastava G.C., Pal M., Das M., Sengupta U.K. (2001): Growth, CO2 exchange rate and dry matter partition-ing in mungbean (Vigna radiata L.) grown under elevated CO2. Indian J. Exp. Biol., 39: 572–577. Vanaja M., Maheswari M., Ratnakumar P., Ramakrishna
Y.S. (2006a): Monitoring and controlling of CO2 con-centrations in open top chambers for better under-standing of plants response to elevated CO2 levels. Indian J. Radio Space Phys., 35: 193–197.
Vanaja M., Vagheera P., Ratnakumar P., Jyothi Laksh-mi N., Raghuram Reddy P., Yadav S.K., Maheswari M., Venkateswarulu B. (2006b): Evaluation of certain rainfed food and oil seed crops for their response to elevated CO2 at vegetative stage. Plant Soil Environ., 52: 164–170.
Received on August 25, 2006
Corresponding author:
Dr. M. Vanaja, Central Research Institute for Dryland Agriculture, Crop Science Division, Santoshnagar, 500 059 Hyderabad, India