REVIEW
Machine vision methods for analyzing social interactions
Alice A. Robie*, Kelly M. Seagraves*, S. E. Roian Egnor‡and Kristin Branson‡ABSTRACT
Recent developments in machine vision methods for automatic, quantitative analysis of social behavior have immensely improved both the scale and level of resolution with which we can dissect interactions between members of the same species. In this paper, we review these methods, with a particular focus on how biologists can apply them to their own work. We discuss several components of machine vision-based analyses: methods to record high-quality video for automated analyses, video-based tracking algorithms for estimating the positions of interacting animals, and machine learning methods for recognizing patterns of interactions. These methods are extremely general in their applicability, and we review a subset of successful applications of them to biological questions in several model systems with very different types of social behaviors.
KEY WORDS: Animal behavior, Computer vision, Machine learning, Social behavior
Introduction
Interactions between conspecifics are some of the most critical in an
individual’s life: behaviors such as mating, parental care and territorial
defense all have fitness consequences (Clutton-Brock, 2007; Darwin, 1888; Hamilton, 1964). However, the complexity of social behavior, which usually involves multiple animals, makes quantitative study of these interactions difficult. Because of this, research on social behavior has benefited enormously from advances in automated measurement and quantification of social interactions. These benefits include: (1) increased throughput, allowing the collection and analysis of vast numbers of interactions, (2) standardization of measures across labs, (3) reduction in human bias and (4) the ability to observe patterns that may be too subtle for a human observer, including changes at very short and very long time scales.
Social behaviors occur over multiple spatial and temporal scales, and vary in complexity, plasticity and stereotypy. Definitions of social behavior also vary, from all behaviors that occur when more than one animal is present (Altmann, 1974), to only behaviors in which one conspecific influences the behavior of another (Sokolowski, 2010). Regardless of the definition used or the specific social behavior of interest, automated analyses of social
behaviors share common features–the need to record the behavior,
to track the positions (and often body parts) of the participants, to recognize individuals across time and space, and to recognize and quantify patterns of interactions.
In this review, we discuss each of these common components of automated social behavior analysis. We focus primarily on two genetic model organisms, fruit flies and mice, and on the
video-based tools and techniques that have been developed to describe social behaviors in these species. We begin by discussing the technical issues to consider when recording video of social behavior to simplify all other components of automated analysis
(see ‘How do you record social behavior?’). Next, we discuss
computer vision algorithms for tracking the positions of
interacting animals throughout a video (see ‘Tracking’). We then
survey automated behavior classification methods, which assign
categorical labels to patterns of interactions (see ‘Behavior
classification’), and discuss what kinds of analyses have been
performed on both raw position information and behavioral labels
(see ‘Making sense of automated measures of behavior’). We
finish by highlighting open questions and challenges in automated behavior analysis and some promising future directions (see
‘Conclusions and future directions’).
How do you record social behavior?
It can be challenging to create a laboratory environment that allows animals to readily perform naturalistic social behaviors, while simultaneously permitting the collection of high-quality video for computer vision analysis. Fortunately, genetic model organisms like mice and fruit flies readily perform at least the minimal social behaviors required for reproduction in captivity. As a result, it can be tempting to record animals behaving in readily available laboratory equipment such as food vials, Petri dishes or home cages. However, an initial investment in optimizing video quality can both make automated analysis possible and improve the quality of that analysis. Important characteristics of high-quality video for computer vision analysis include uniform and sufficient lighting (Fig. 1A), high contrast in color or intensity between animals and background (Fig. 1B), lack of occlusions and reflections (Fig. 1C,D), continuously visible animals (Fig. 1E) and constant conditions within trials, across trials and across days. In this section, we discuss how to optimize a
video-recording rig’s lighting, layout and camera(s) to achieve these
properties. We also discuss methods for marking animals to maintain individual identities over time.
Lighting
Collecting video with uniform and sufficient lighting can minimize the complexity required of tracking algorithms, as discussed in
‘Tracking’, below. Using multiple light sources and diffusers to
avoid hotspots can greatly improve illumination uniformity across the entire field, and this uniformity can be checked for by examining a camera image in pseudocolor (Fig. 1A). Uniform illumination facilitates collecting video in which animal pixels can easily be separated from background pixels (Fig. 1B). Light levels should also be controlled across time. Powering light sources using alternating current can result in light-level oscillations, which can be avoided by using direct current. In cases in which high frame rates or high-intensity illumination is required, light pulses synchronized with the camera shutter can be used to generate more light without overheating. Recording video in non-visible wavelengths allows, for example, day/night cycling for the animals
Howard Hughes Medical Institute, Janelia Research Campus, 19700 Helix Drive, Ashburn, VA 20147, USA.
*These authors are co-first authors
‡Authors for correspondence ([email protected]; [email protected])
S.E.R.E., 0000-0003-0992-6240; K.B., 0000-0002-5567-2512
Journal
of
Experimental
while providing constant illumination to the camera. Near-infrared (IR) LEDs are often used for video illumination, because they are inexpensive, imperceptible to flies and mice and generate less heat. Visible wavelength cameras often have detection efficiency in the near-IR, and IR-pass filters that remove shorter wavelengths from the video are readily available.
Reflections are challenging for automated tracking programs to differentiate from actual animal images (Fig. 1C). Preventing reflections in the recording chamber is often much easier and can avoid the need to discard data near the reflective surface. Backlighting and imaging transmitted light can completely prevent reflections, but this also reduces animal detail as it results in imaging a shadow of the animal. Attention to light placement, and use of less-reflective materials in chamber construction, diffusers and indirect front lighting can all reduce reflections in front-lighting designs.
Avoiding occlusions
Accurately determining animal positions and identities requires the animals to be continuously visible to the camera, as occlusions by chamber elements or other animals can negatively impact tracking accuracy (Fig. 1D). To avoid occlusion from environmental elements such as mouse shelters, these objects can be constructed using IR-transparent material, providing a visually opaque object through which the animal is still visible to the camera, as illustrated
in Fig. 1E (Ohayon et al., 2013). To prevent animal–animal
occlusions, animals can be restricted to a planar environment by using walls and/or lids they cannot climb (Mersch et al., 2013; Neunuebel et al., 2015; Simon and Dickinson, 2010), thereby
removing occlusions due to visually overlapping positions on different surfaces (e.g. one animal on the ceiling and one under it on the floor). When using lids, care must be taken to provide enough headroom for behaviors with vertical components like rearing, mounting and wing extensions. However, social interactions such as
tussling or mounting may cause animal–animal occlusions that
cannot be avoided. In such cases, the ambiguity caused by the occlusions can be resolved with tracking software that uses innate or artificial identifiers to maintain identity at least before and after such
events (see‘Marking individuals’and‘Tracking’sections below).
Three-dimensional (3D) tracking can also disambiguate occlusions by providing multiple views (Ardekani et al., 2013; Hong et al., 2015), but is a more technically challenging solution requiring additional equipment, synchronization and registration of cameras, and 3D tracking software.
Optimizing for high-quality behavior
Eliciting naturalistic social interactions can require, or be facilitated by, particular environmental conditions, such as the presence of a food resource in the case of fly aggression. With creative engineering, these environmental factors can be added to recording chambers without degrading video quality, for example by using a translucent food substrate to enable uniform backlighting in aggression chambers (Hoopfer et al., 2015).
To better understand social interactions, it can also be important to capture non-visible social behaviors, such as acoustic signals. Optimizing chambers for behavior production, automated video analysis and acoustic recording presents additional challenges and
Infrared light Chamber Animal
Background
Grayscale Pseudocolor Grayscale Pseudocolor
Reflection
Visible light
Foreground
A
B
C
D
E
0 50 100 150 200 250 0 50 100 150 200 250
Pixel intensity
Fraction of pixels
0 0.2 0.4
[image:2.612.146.466.59.293.2]0 0.2 0.4
Fig. 1. Illustration of chamber design considerations.(A) Uniform lighting of video recording chambers simplifies the tracking task by making it easier to separate foreground and background pixels throughout the chamber. Visualization of lighting illumination can be done by examining the chamber using a color map that emphasizes differences in pixel intensity. Grayscale versus pseudocolor visualizations of an evenly (left) and unevenly (right) illuminated chamber. (B) Distinguishing animal pixels (foreground) from chamber pixels (background) is an important step in tracking algorithms, and good separation between the intensity or color of these pixels improves the quality of tracking. Top left, an example of a chamber with easily tracked flies that has well-separated foreground and background pixel intensity, as seen in the normalized histogram of pixel intensity (bottom left). Top right, an example of a chamber with mice that are difficult to track by automated algorithms, where there is overlap between the intensity of foreground and background pixels, as seen in the normalized histogram (bottom right). (C) Reflections (blue ellipse) can be removed by specifying a region of interest (ROI; dashed red line); however, if animals can cross the ROI boundary, errors in tracking (light blue ellipses) such as truncation can occur. (D) Occlusions caused by chamber elements (left) or animal superposition (right) can also cause errors in tracking and identification of errors or swaps. (E) Careful consideration of chamber design can prevent tracking errors and facilitate naturalistic animal behavior. Providing shelters to mice that are opaque in visible light (left) and transparent in infrared light (right) enables continuous animal tracking while allowing mice to exhibit species-typical hiding behavior.
Journal
of
Experimental
can require trade-offs. Consideration should be given to microphone placement, which is particularly challenging in the case of recording fruit fly courtship song because it is a near-field sound. Successful analysis of synchronized video and audio recordings has been achieved by using the microphone surface as the chamber floor and illuminating with front lighting (Coen et al., 2014). As with lighting, avoiding reflections of the audio signal is good practice, which can be achieved by careful choice of chamber material (e.g. Neunuebel et al., 2015).
Camera choice
An important consideration in a recording apparatus is camera choice. Sufficient spatial and temporal resolutions are essential for tracking animals and capturing behaviors that include rapid
movements. The Nyquist–Shannon sampling theorem from digital
signal processing produces a useful rule of thumb for the minimum sampling rate required: double the rate of the maximum frequency of a signal (Shannon, 1949). Consider lunging behavior in the fly, in which the complete sequence of rearing, snapping and grabbing the
opponent takes∼100 ms (Hoyer et al., 2008). To sample at least
once during a lunge event, one would need to sample at one frame every 50 ms. However, to accurately determine the timing of the
start or end, or to detect the ‘snapping’, which can take <10 ms,
much higher frame rates are required. The revolution in low-cost, high-quality image sensors, driven by demand for better smart phone cameras, has benefited research equipment and provided a huge range of cameras to choose from. Currently, cameras fall into three general categories: streaming cameras with standard interfaces such as FireWire, USB3 or GigE, streaming cameras with specialized interfaces such as Camera Link, and cameras with onboard storage for high-speed applications. If we consider a 1 megapixel image, the recording rates of these cameras translate to
frame rates ranging from∼25 to∼7000 frames s−1, with equipment
costs ranging from hundreds to tens of thousands of dollars (Table 1). Thus, an important factor in choosing a frame rate and resolution is the size of the generated files: the cost of storing video data can now quickly dwarf the initial cost of equipment. Therefore, there is a balance between collecting data at sufficiently high spatial and temporal rates and not collecting, storing and analyzing unnecessarily large data sets. Compression and dimensionality reduction of video data by both general-purpose video-compression algorithms and specialized methods such as tracking can help reduce storage demands. Important trade-offs to consider when selecting a video compression method are the loss of video quality and the effects of this loss on downstream computer vision-based analyses, the decrease in file size, the speed of compression and decompression, and the compatibility of the video codec with other parts of the analysis pipeline.
Marking individuals
For automated behavior analyses in which individual identity is important, a method to reliably identify individuals throughout experiments is required to assign behaviors to the correct individual. With video-based analysis, the most straightforward strategy is to distinguish individuals visually. Naturally occurring differences such as sexual dimorphisms (Branson et al., 2009; Dankert et al., 2009), coat color (Hong et al., 2015) or unique natural markings (Perez-Escudero et al., 2014) can be leveraged as indicators of identity. In cases in which a naturally occurring feature cannot be used, artificial identifiers can be used instead. An ideal identifier would be continuously visible to the camera, but have no effect on the behavior of the animals because of either pre-recording handling or the manipulation itself. Reciprocal experimental design can help to rule out such effects if the manipulation is only made to one animal in a given experiment. Current methods for visually marking animals include applying identifying marks or fiducial markers with barcode-based identifiers (Certel and Kravitz, 2012; Dow and von Schilcher, 1975; Mersch et al., 2013), genetically encoding fluorescence (Ramdya et al., 2012), and dyeing fur with individual patterns (Ohayon et al., 2013) or fluorescent colors (Shemesh et al., 2013). Unfortunately, these methods are all limited in the number of unique markings available relative to realistic experimental animal numbers, with the exception of fiducial markers. However, such barcoded tags, while excellent identifiers, are of limited usefulness for flies because of size limitations imposed by current printer resolutions (i.e. they are too big for a fruit fly), and for mice because they cannot be securely attached to fur. An alternative to visible markers are radio-frequency identification (RFID) tags, which also have large numbers of unique identifiers. The spatial resolution of RFID tag data is determined by the antenna array design, and is lower than that of video. Nevertheless, RFID tags have been used to reliably identify individuals in combination with video data (Weissbrod et al., 2013). Additionally, while RFID alone does not provide sufficient spatial resolution to identify social behaviors, it does provide a method to collect long-term information (with much lower storage costs than video) about animal position (Freund et al., 2013, 2015; Perony et al., 2012). However, the smallest RFID tags currently available, 1 mm×8 mm and 30 mg, are still very large relative to insect model systems.
[image:3.612.50.568.623.698.2]The optimal rig design for any given situation is dependent upon the scientific question of interest; here, we cite a few examples of well-designed rigs that facilitate tracking and subsequent behavioral analysis. For fly experiments, a backlight arena offers excellent contrast and uniform illumination as seen in Simon and Dickinson (2010). For long-term mouse experiments, the combination of video and RFID provides accurate long-term individual identity tracking, as well as behavioral analysis (Weissbrod et al., 2013).
Table 1. A range of currently available commercial monochromatic cameras
Camera make and model Interface
Resolution (pixels)
Frame rate (frames s−1)
Uncompressed data size for 5 min video (GB)
Point Grey Firefly USB 752×480 60 6
Basler Scout scA1300-32fm FireWire-b 1296×966 32 11
Point Grey Flea3 FL3-U3-13Y3M-C USB3 1280×1024 150 55
Teledyne Dalsa Falcon2 Camera Link 2432×1728 168 296
Photron> FASTCAM SA5 Onboard storage* 1024×1024 7000 2051*
For each camera we list: (1) the make and model, (2) the type of interface for data transfer in the case of streaming cameras, (3) the resolution of the camera, (4) the maximum frame rate of the camera at the resolution listed, and (5) the calculated size for an uncompressed 5 min movie at the listed resolution and frame rate.
*The Photron camera uses onboard storage and the video size is only hypothetical as the onboard storage is limited to 64 GB.
Journal
of
Experimental
Tracking
Once video is collected, each animal’s position or pose can be
estimated, or tracked, in every video frame. Almost all
animal-tracking systems estimate the (x,y) coordinate corresponding to each
animal’s centroid, and the majority also return some information
about the pose of each animal, such as the head direction or locations of body parts (e.g. wings, tail, legs).
Segmenting animals from background
In the laboratory setting, the animals’environment can be controlled
to make automatic tracking as easy and error-free as possible,
as discussed in‘How do you record social behavior?’, above. A
primary goal is to make it easy to distinguish pixels belonging to the animals (foreground) from pixels belonging to the background. Often, background subtraction is used for this classification: one estimates the appearance of the arena if no animals were present, subtracts this from the current frame, and thresholds the difference (Piccardi, 2004). This method relies on the rig being constructed so that the color or intensity of background pixels is different from that of animal pixels, so that there is no motion in the background, and so
that the animals are not occluded, as discussed in‘How do you
record social behavior?’.
Multi-target tracking
If the rig is constructed so that one can distinguish foreground and background pixels with no occlusions, then estimating the centroid of a single animal in a given frame is simple: one can compute the average location of all foreground pixels. This can be repeated in all frames, and the estimated poses in each frame can be linked unambiguously into a track. However, tracking multiple interacting and visually indistinguishable animals is a difficult, unsolved problem in computer vision, even in controlled laboratory settings. In this section, we describe the variety of algorithmic approaches to this problem, and some of the current research directions for improved algorithms. Multi-target tracking can be broken into two interdependent subproblems. First, the positions/poses of all animals (ignoring identity) in each frame must be identified. Second, the detected positions must be connected across frames into trajectories for each individual animal.
A common approach to the first subproblem, detecting the (identity-less) positions of the animals in a given frame, is to first segment the pixels in the frame into foreground and background, and then to cluster these pixels into spatially connected groups using clustering algorithms like Expectation-Maximization for Gaussian Mixture Models (Branson et al., 2009; Dankert et al., 2009; Ohayon et al., 2013; Perez-Escudero et al., 2014) or watershed segmentation (Fiaschi et al., 2014). However, if two animals are touching, or, worse, if one animal is occluding another, it can be difficult to tell where one animal ends and another begins based only on the shapes of blobs of foreground pixels.
One solution to the problem of touching or occluding animals is to also use the appearance of the foreground pixels. For example, one might be able to see edges between touching animals that suggest boundary locations (Branson and Belongie, 2005; de Chaumont et al., 2012). However, methods for incorporating such appearance information can be prohibitively slow (particularly for more than two animals). In addition, how best to use machine learning to learn what features of appearance to model is an open area of research (Girshick et al., 2016).
An alternative solution to the problem of touching or occluding animals is to use the assumption that animals move slowly and smoothly to guess where the animals are in the current frame based
on their estimated positions in other frames. This temporal context is particularly informative if, for example, the animals are touching in the current frame but not in the previous frame. Or, if the animals are touching in the current frame but not the next frame, it may be useful to use temporal context from the future. Ideally, one would use temporal context from both the past and the future, and estimate the
animals’positions in all frames simultaneously as part of a single,
large optimization problem, consisting of thousands to millions of unknowns (the positions of each animal in each frame) (Fiaschi et al., 2014). However, as optimization cost grows super-linearly in the number of unknowns, solving such a large problem can be too computationally expensive. Many approaches have been developed for improving the efficiency of these algorithms, including making greedy decisions to reduce the problem size and developing more efficient and/or approximate solvers (Lenz et al., 2015).
Given the detected, identity-less animal positions in each frame, one simple approach to the second subproblem, to assign identities, is to begin by initializing identities (arbitrarily) in the first video frame. Then, one can match identity-less detections in the second frame to positions in the first frame based on models of animal motion, such as assumptions that animals move short distances or at constant velocities between frames. One can continue in this iterative fashion until the last frame (Branson et al., 2009; de Chaumont et al., 2012; Gershow et al., 2012; Swierczek et al., 2011). This is a greedy, sequential solution, as it uses only information from the past to match identities, but, as discussed above, information from future frames may also be informative.
Depending on one’s assumptions, it can be computationally feasible
to instead find the globally optimal identity assignments in all frames simultaneously, using dynamic programming or Integer Linear Programming (Berclaz et al., 2011; Pirsiavash et al., 2011; Schiegg et al., 2013).
Even the most cutting-edge tracking algorithm will make mistakes and swap identities. If only assumptions about the
animals’motion are used to maintain identity assignments, then
these identity swaps will propagate to all subsequent frames. In some applications this can be acceptable, such as when analyzing social behavior at a population level. For example, identity-swap errors will not affect an estimate of the average inter-animal distance across the population. Suppose one maintains animal identities for
short time periods by using tracking to create short‘tracklets’, in
which it is certain that identity is preserved (and thus locomotion statistics are accurate), that last for tens to thousands of frames, but not the entire video (Gershow et al., 2012; Swierczek et al., 2011). From these tracklets, one can compute behavioral statistics that require temporal context, but there is no need to solve the difficult problem of maintaining individual identities over the entire video. However, care must be taken when using such techniques, as removing frames with questionable identity assignments from analysis (e.g. frames in which animals are touching) could bias derived statistics.
Incorporating individuals’appearances into tracking
Some experimental questions do require accurate knowledge of animal identity throughout the entire video. One solution to this problem is to mark the animals so that they are uniquely distinguishable (Ohayon et al., 2013; Shemesh et al., 2013), as
discussed in ‘How do you record social behavior?’, above.
Alternatively, in some situations, one can use computer vision to exploit subtle visual differences between individuals (Perez-Escudero et al., 2014). These computer vision approaches learn
models of each animal’s appearance from frames in which the
Journal
of
Experimental
animals are not interacting. These learned models can then be used to predict the identity of each detected animal in every frame, often with some measure of prediction confidence. These predictions can then be combined with the identity predictions based on the animal motion models described above to obtain accurate tracking.
Behavior classification
The trajectories (position of each animal as a function of time) that
result from tracking (discussed in ‘Tracking’, above) provide
information about how animals spend time at different locations in an environment. From trajectory data, it can be determined when the animals were near one another (Fig. 2A,B), which is used for
position-based analysis of interactions (discussed in‘Making sense
of automated measures of behavior’, below). However, it is often of
more interest to know what animals were doing at a particular time or place (Fig. 2C), and in the context of social behavior, how they were physically interacting with a social partner. This leads to the task of behavior annotation (also called behavior classification),
which is the labeling, or assignment, of an animal’s behavior at a
particular time. For example, a fly or mouse could be labeled as
‘walking’when it is moving slowly (Robie et al., 2010; Weissbrod
et al., 2013), or a fly could be labeled as ‘courting’ when it is
producing courtship song (Dankert et al., 2009). While behavior annotation was originally performed manually (Altmann, 1974), powerful methods of automatic behavior annotation have been developed. One common way to do this is by creating a classifier, as discussed below.
Training a behavior classifier
A classifier is a function that predicts a class, which in behavioral classification is the behavioral label. Binary classifiers predict
which of two classes the animal’s behavior is in (i.e. the animal is or
is not performing the behavior of interest), while multi-class
classifiers can classify an animal’s behavior as one of several
mutually exclusive classes. Annotating the data with a single classifier results in each frame having only one behavioral annotation. If multiple non-mutually exclusive behaviors are being annotated, then several binary classifiers can be applied to the same data. This can result in frames that have several behavior annotations.
The relationship between the data being studied (e.g. the raw
pixels or animal’s trajectory) and the predicted behavioral label is
quantified in terms of features – measurable properties, or
descriptors, of the data (Bishop, 2006). Examples of features that can be calculated from animal trajectories include the speed or
velocity of the animal’s centroid, or the length or width of the
animal when the trajectories include pose information (such as an
ellipse-fit of the animal’s body) (Kabra et al., 2013). From
trajectories, it is also possible to calculate features based on the
animal’s position relative to other environment elements, such as the
distance from the animal to the arena wall or nearest social partner (e.g. Coen et al., 2014). Features can also be derived directly from the raw video, such as how pixel intensities change over the image (e.g. Histogram of Oriented Gradient; Dalal and Triggs, 2005). Additional features can be constructed by summarizing features calculated from single frames over a window of frames (e.g. Kabra et al., 2013).
There are several ways to create a classifier based on features. If the features necessary for accurate classification of the behavior of interest are known, then they can be used to specify the classifier
directly. For example, a‘walk’classifier might only use the speed of
the animal (i.e. if the animal’s speed is within a specified range, then
the animal is classified as walking; Weissbrod et al., 2013). Alternatively, if the relevant features for accurately classifying a
Nurses Cleaners Foragers Queen Small ant Big ant
chase
Crabwalk
Stop Walk
720 740 760
A
B
Fraction of time
Open Z-wall
Water Feeder 1 Feeder 2
On small nest On large nest Block
In small nest In large nest
C
D
Courtship Aggression
1
Wing threat
4
Lunge 19
Chase Wing extension
10 Circling 8
Circling and wing extension 2 5
0.5
Sharpturn
Backup
Touch
[image:5.612.147.470.422.634.2]Time (s)
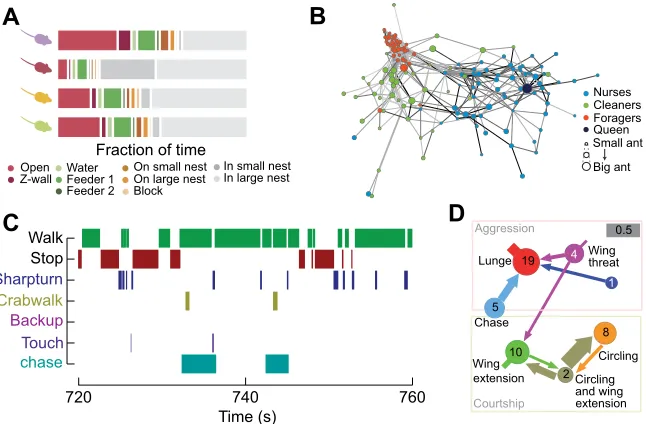
Fig. 2. Making sense of automated measures of behavior.(A) Simple thresholding of position as a function of time reveals differential use of space by mice in an enriched environment. Adapted with permission from Shemesh et al. (2013). (B) Analysis of pair-wise interactions betweenCamponotus fellahindividuals outlines the colony social network and reveals three groups with distinct behavioral repertoires. Edge line width is proportional to the number of interactions between pairs of nodes. The darkness of edges is proportional to the average duration of interactions. Adapted with permission from Mersch et al. (2013). (C) Machine learning-based behavior detectors automatically capture eight individual or social behaviors ofDrosophila melanogasteras a function of time. Note that some behaviors may occur simultaneously, while others are mutually exclusive. Adapted with permission from Branson et al. (2009). (D) Male Canton-S flies engage in both aggressive and courtship behaviors. Transition probabilities between behaviors can be computed for these behaviors and are represented by the thickness of the arrows (note that behavior can transition to‘no action’; gray bar, transition probability of 0.5). The arrow stumps represent transition to the same action. Circle diameters (scaled logarithmically) and numbers represent the average frequency of each action. Adapted with permission from Dankert
et al. (2009).
Journal
of
Experimental
behavior are not knowna priori, or if it is thought that the behavior predictions might be improved with information from a large combination of features, then a classifier can be learned (or optimized) based on examples of the behavior of interest.
In learning a classifier, a machine learning algorithm is essentially inferring the feature-rules that predict the behavior of interest from correctly labeled examples. There are three critical components to creating a classifier: (1) the labeling of training data, (2) the choice of feature representation and (3) the types of classifier functions considered.
To specify the first component, the labeled training data set, one must label some frames in the data set for which the correct behavior can be confidently assigned. From this labeled data set, the learning algorithm will infer rules that can reproduce these labels from the feature representation of the video. It is important that the labeled examples come from a variety of experiments/individuals and from varied instances of the behavior so that the learned model will generalize well, i.e. will be accurate when applied to videos that it was not trained on.
The second crucial component of learning a classifier is choosing an appropriate feature representation of the video (Bishop, 2006). With so many feature types to choose from, it may not be intuitive which ones will be useful for classifying the behaviors of interest. Thus, it is common to include a large number of features, some of which may be irrelevant or redundant. Supervised learning algorithms can learn to ignore such irrelevant features. The main downsides of this strategy are that computing these features and learning the classifier can be slow, and the amount of training data necessary to learn a classifier that generalizes well can be large.
Machine learning algorithms search a pre-specified (possibly infinite) set of classifier functions to find the function that can best reproduce the manually specified behavior labels. Thus, the third component of a learning algorithm is the types of classifier functions considered and the mathematical definition of which function is best (Bishop, 2006). For example, the classifier family could be all linear combinations of the features, all quadratic functions of the features, or any threshold on any feature. Machine learning algorithms differ in how complex and large this set of classifier functions is. Searching large classifier families can result in a more powerful classifier, but requires more training data to select a classifier that generalizes well and can take longer to train. Successful, general-purpose machine learning algorithms include Support Vector Machines, Random Forests, boosting and deep neural networks (Bishop, 2006). However, different learning algorithms will work better on different configurations of data and task; thus, it is necessary to carefully select the learning algorithm appropriate for the task at hand. Choosing the best learning algorithm for a given problem is not easy, and requires both trial-and-error (in conjunction with validation techniques, discussed next) and consideration of many factors, including the properties and dimensionality of the data set, the mathematical criterion optimized by the learning algorithm, the family of classifier functions searched, and the optimality and efficiency of the learning optimization algorithm.
Testing classifier accuracy
Regardless of how a classifier is created, it is important to measure its generalization error. In this process, the classifier is run on data that have been labeled by a researcher (groundtruthed)
but were not included in the training data set, and the classifier’s
predictions are compared with these human-generated labels. This measures how well the classifier will perform on new data.
Ideally, the training and groundtruth datasets will be large and
independent from one another, but this isn’t always practical.
Instead, in a process called cross-validation (Bishop, 2006), a labeled dataset is partitioned multiple times into different training and test sets, and the accuracy over the classifiers created from these divisions is averaged.
There are several reasons a classifier might not reach predefined accuracy standards. Poor classifier performance may be due to overfitting, meaning the training data set was too small and/or the training examples did not cover enough of the behavioral variability. In these cases, more data must be labeled. Poor performance may also be the result of inconsistent labeling ( perhaps due to a vague definition of the behavior of interest). Alternatively, it may be due to an insufficiently expressive feature representation. Finally, it may occur if the learning algorithm is not well suited to the task at hand. Each of these issues can be addressed by revisiting the corresponding part of the learning process. Thus, generation of a behavior classifier is often an iterative process. This iteration requires either interactive machine learning software (Kabra et al., 2015, 2013) or close interaction between biologists and computer scientists.
Using a behavior classifier
Once an automatic behavior classifier is sufficiently accurate, it can be used to automatically annotate behavior in new data sets collected under similar conditions (e.g. same rig, arena, animal type). This makes the generation of an automatic behavior classifier more time efficient than manual annotation, particularly when thousands or millions of video frames have been recorded, such as in large genetic screens (Hoopfer et al., 2015). Automatic behavior annotation is also subject to fewer biases, as a classifier cannot change its definition of a behavior over time, unlike human annotators. This makes the results of automatic annotation repeatable over time and across researchers.
Supervised, semi-supervised, unsupervised and interactive methods
The automatic behavior annotation methods described above are known as supervised methods, because they require manually labeled examples to train the classifier. There are other machine learning methods for automatic annotation that require fewer
(semi-supervised) or no (unsupervised) manually labeled
examples (Bishop, 2006). When using supervised methods, the researcher has a clear idea beforehand of the behavior(s) they want annotated. In contrast, unsupervised methods attempt to group (or cluster) data based on the similarity between data points, without inferring grouping rules from labeled examples (Berman et al., 2014; Vogelstein et al., 2014). Once processed, the researcher must examine these clusters to determine whether different behaviors have been well separated. Unsupervised methods rely on a carefully chosen feature representation of the data, as distance in this high-dimensional feature space defines what it means for two behaviors to be similar. Semi-supervised methods learn from both unlabeled and labeled data. To our knowledge, such algorithms have not been used in animal behavior classification, but have the potential of combining the best of both types of algorithms.
A relatively new subfield of machine learning is interactive machine learning, in which human annotators and learning algorithms work together to solve a problem, for example, to learn a behavior classifier. JAABA (Kabra et al., 2013) is an interactive machine learning system for training behavior classifiers
that allows the researcher to iteratively annotate behavior in a few
Journal
of
Experimental
frames, train a classifier, browse the results, then annotate more frames. Besides allowing classifiers to be trained from fewer labels, this interactive process allows the annotator to adapt their preconceived behavior definitions to the data.
Making sense of automated measures of behavior
Automated measures of behavior allow scientists to explore social behavior in unprecedented detail. In previous sections, we described two types of automated behavior measures: (1) animal position as a
function of time (‘Tracking’) and (2) classification of animal
behavior as a function of time (‘Behavior classification’). Next, we
discuss how these measures can provide insight into social behavior, and also touch on methods to test specific hypotheses. In social behavior analysis, automated methods have been primarily used to reduce user effort and bias. This has allowed the analysis of orders of magnitude more data (for example, Hoopfer et al., 2015,
analyzed over 2 billion frames of videos of ∼85,000 flies). This
increase in data set size alone may constitute a qualitative change in behavior description (Anderson, 1972). We are also optimistic that, in the near future, automated analyses will enable identification of new patterns of social behavior, as has been the case with locomotion behaviors in single animals (e.g. Tchernichovski and Golani, 1995). We stress that such automated behavior analyses do not replace the need for biologists to interact with and scrutinize their data, but instead shift the focus.
Extracting social networks from position
Much information about an animal’s social life can be learned from
observing who it interacts with (Brent et al., 2013). Social interactions can be extracted from trajectories by either identifying regions of interest (ROIs) within an arena and defining an interaction as two animals simultaneously in the same ROI (Shemesh et al., 2013), or by using thresholds on proximity, heading direction and behavior duration (Schneider et al., 2012). These extracted social interactions can be used to construct social networks, which can then be compared with model predictions. For
example, Schneider and colleagues (2012) found thatDrosophila
melanogaster form interaction networks that are distinct from random networks, while Perony and colleagues (2012) found that
mouse social interactions in a naturalistic enclosure were consistent with random interactions between social partners. Association patterns can also reveal behavioral subgroups, like the three distinct,
spatially restricted behavioral repertoires of the ant Camponotus
fellah(Mersch et al., 2013).
Summarizing behavioral labels
In contrast to trajectory data (animal position over time), the output of behavioral classifiers is a sequence of behavioral labels over time (Fig. 2A). There are many ways this information can be summarized to quantitatively describe behavior. Two common summary methods are time budgets (the fraction of time spent on each
behavior, also called ‘activity budgets’or ‘ethograms’; Fig. 2B)
(Branson et al., 2009; Jhuang et al., 2010) and the transition
probabilities between behaviors (also called‘kinematic diagrams’
or‘ethograms’; Fig. 2C) (Adamo and Hoy, 1995; Dankert et al.,
2009; Seeds et al., 2014; York et al., 2015). Both time budgets and transition probabilities can be compared across species (Petru et al., 2009), strains (de Chaumont et al., 2012; Kabra et al., 2013) or experimental conditions (Branson et al., 2009; Saka et al., 2004). More detailed analyses of labeled behavior can also be performed; for example, where or when a particular behavior occurs. Conversely, behavior labels can be used to analyze the sub-structure of how animals perform a behavior; for example, examining speed during all labeled bouts of walking.
Testing whether a behavior is truly social
A major advantage of automated behavior analyses is that large data sets provide sufficient statistical power to test whether a particular aspect of behavior is indeed social; that is, whether the behavior of multiple animals recorded together is different from that expected from single animals. For example, if time spent in proximity to
another animal (‘near’events) is being used as a proxy for social
[image:7.612.47.563.518.679.2]interactions, one can combine the trajectories of two animals behaving separately into a virtual social recording, and calculate the number and duration of the near events in the virtual recording (as in Schneider et al., 2012). By repeatedly creating these virtual social recordings, one can estimate the distribution of the number of near events in the absence of explicit social behavior. The number of near
Table 2. Multi-animal tracking software packages
Name Animal type
No. of animals
Tracking during interactions
Identity
maintained Availability Website
Ctrax Flies 1–50 Yes Minutes Free and open-source http://ctrax.sourceforge.net/ EthoVision Mice, flies, fish 1–16 Yes Minutes, with
markers
Commercial http://www.noldus.com/
idTracker Fish, flies, mice, ants
1–20 Yes Days Free but closed-source http://www.idtracker.es/
MAGAT-Analyzer Fly larvae 1–20 No Seconds Free and open-source https://github.com/samuellab/MAGATAnalyzer MiceProfiler Mice 2 Yes Minutes Free and open-source http://icy.bioimageanalysis.org/plugin/Mice_
Profiler_Tracker MOTR Mice 1–6 Yes Days, with markers Free and open-source http://motr.janelia.org/ Multi-Worm
Tracker
Worms, fly larvae 1–120 No Seconds Free and open-source https://sourceforge.net/projects/mwt/
Qtrak (CADABRA)
Flies 2 Yes Minutes, with
markers
Free but closed-source http://vision.caltech.edu/cadabra/
Multi-animal tracking software packages are listed that are available to biologists and have either been used by multiple labs or include documentation for new users: Ctrax (Branson et al., 2009), EthoVision (Noldus et al., 2001), idTracker (Perez-Escudero et al., 2014), MAGAT-Analyzer (Gershow et al., 2012), MiceProfiler (de Chaumont et al., 2012), MOTR (Ohayon et al., 2013), Multi-Worm Tracker (Swierczek et al., 2011) and Qtrak (CADABRA) (Dankert et al., 2009). For each package, we also describe the following: (1) the types of animals they were intended to be used for, (2) the number of animals in groups that they have previously tracked, (3) whether they can track animals while the animals are touching, (4) for how long they have been reported to maintain individual identities,
(5) whether they are free and open-source, and (6) where they can be obtained.
Journal
of
Experimental
events observed in a true social recording can be compared with this distribution to test for significant increases (seeking out) or decreases (avoiding) in the number of events. Another method of measuring the expected multiple-trajectory statistics resulting from non-social factors is to temporally shift trajectories from the same video relative to each other, using shift times longer than the length of the behavior of interest (Branson et al., 2009). This method is particularly useful when it is impractical, or impossible, to obtain data where only one individual is present in the experimental arena at a time.
Manipulating sensory experience to probe social behavior hypotheses
Hypotheses about social behavior can also be tested by experimental manipulation. Because social interactions depend on communication between animals, and therefore information transmission through sensory channels, a fruitful method for testing these hypotheses is to modify communication signals. One way to
do this is to alter an animal’s sensory abilities. For example, after
observing that variability in maleDrosophilacourtship song was
correlated with female motion, Coen et al. (2014) used blind flies to show that male flies use visual cues to detect the female and target their song to her. Another method for altering communication signals, particularly acoustic signals, is to record and manipulate them, play them back to subjects, and measure the effect of different
manipulations on the subject’s behavior. For example, playback
experiments in birds (Stoddard et al., 1991; Templeton et al., 2005), crickets (Libersat et al., 1994), primates (Cheney and Seyfarth, 1999) and frogs (Narins et al., 2005) have identified features of acoustic signals that carry information about male quality and predator type.
In many cases, however, multimodal communicative signals are important for a social interaction. Insight into how integration of sensory cues across modalities controls social behavior can be gained by testing the effect of individual cues or combinations of cues on the behavior of interest. For example, Seagraves et al. (2016) showed that, in mice, male vocal behavior elicited by female odor is potentiated by the presence of a male audience, but that single sensory cues indicating an audience (vocalizations, odors) do not elicit potentiation. In cases where it is necessary for a stimulus animal to be present, researchers can use a robotic replacement,
which allows control over the stimulus animal’s features. In one
example of this, Michelsen et al. (1989) used a robotic bee to discover that near-field acoustic signals are a crucial aspect of the
bee’s waggle dance, which communicates the location of a food
source to other bees. More recently, Agrawal and colleagues (2014) used a robotic fly to determine the relative contributions of visual and chemosensory cues to mate recognition behavior in male fruit flies. Using the robot, they were able to show that visual cues are important for approach decisions, while chemosensory cues govern how long a potential mate is pursued.
Neurobiology of social behavior
High-throughput, automated analyses have also accelerated studies of how the nervous system generates social behavior by enabling large-scale screens of the behavioral effects of neurochemical or neuronal activity manipulations, and by facilitating analysis of concurrently recorded behavior and neural activity. Courtship and aggression studies in mice and flies, aided by their distinct behavioral stages and the availability of genetic tools in these model organisms, have been particularly amenable to these approaches (Insel, 2010; Kravitz and Fernandez, 2015; Pavlou and Goodwin, 2013; Yamamoto and Koganezawa, 2013). In one example, Hoopfer et al. (2015) used a
large-scale thermogenetic neural activation screen, which required scoring over 2 billion video frames from 3000 genotypes, to identify a small cluster of cells that promotes both aggression and courtship behaviors in fruit flies. Such a large-scale effort would not have been possible without automated tracking and behavioral analysis (Dankert et al., 2009; Kabra et al., 2013).
Conclusions and future directions
Advances in hardware, software and algorithms have made automated analyses of social interactions increasingly powerful and available. These automated methods allow the collection and analysis of large numbers of interactions, promote standardization of measures across labs, reduce observer bias and have the potential to reveal patterns in social behavior that may not be evident with manual methods. Using these methods requires making trade-offs between the quality of social interactions and the quality of the automated analysis. As we discussed, careful attention to rig design and the environmental demands of the behavior of interest can produce both high-quality behavior and high-quality recordings. Nevertheless, there are still several unsolved problems that will require improved automatic methods, and we will finish by highlighting a few of them.
Tracking animals when they are far apart and show high contrast is relatively straightforward and many freely available software packages have been developed to do so for various animals (see Table 2). However, several aspects of tracking can be improved. First, tracking when animals are close together or in more naturalistic environments is an area of active investigation; the use of supervised machine learning to determine appearance and motion models has the potential to improve tracking in these challenging contexts. Second, many social behaviors depend on subtle movements of body parts (e.g. eyebrows, ears or tail) and improvements to body-part tracking methods are needed to accurately measure and quantify the contribution of these movements to social interactions. Finally, in many species, the details of social interactions are strongly dependent on the identity of the animal (because of differences due to sex, dominance status, age or experience), but maintaining individual identity, particularly in larger groups or during close interactions, is still largely unsolved, although there is promising work involving the use of differences in
individuals’appearances or multiple cameras.
An additional important open question is how to mine large annotated behavior data sets for biological insights. Automated behavior classifiers can now be used to label millions of frames of video, but it remains challenging to manually sift through the resulting complex patterns of behavior. Finally, several methods have been developed that allow recording from many, if not all, neurons in the brain, but in general these methods either require some kind of animal restraint (e.g. Ahrens et al., 2013) or have low temporal resolution (e.g. Kim et al., 2015). Advances that allow large-scale neuronal recordings while animals are performing unconstrained social behaviors will provide a more finely grained and mechanistic understanding of the neural circuits underlying social behavior.
Acknowledgements
We thank Bruno Afonso, Michael Reiser and Julie Simpson for helpful discussions.
Competing interests
The authors declare no competing or financial interests.
References
Adamo, S. A. and Hoy, R. R.(1995). Agonistic behaviour in male and female field crickets, Gryllus bimaculatus, and how behavioural context influences its
expression.Anim. Behav.49, 1491-1501.
Journal
of
Experimental
Agrawal, S., Safarik, S. and Dickinson, M.(2014). The relative roles of vision and chemosensation in mate recognition ofDrosophila melanogaster.J. Exp. Biol. 217, 2796-2805.
Ahrens, M. B., Orger, M. B., Robson, D. N., Li, J. M. and Keller, P. J.(2013). Whole-brain functional imaging at cellular resolution using light-sheet microscopy.
Nat. Methods10, 413-420.
Altmann, J.(1974). Observational study of behavior: sampling methods.Behaviour 49, 227-267.
Anderson, P. W.(1972). More is different.Science177, 393-396.
Ardekani, R., Biyani, A., Dalton, J. E., Saltz, J. B., Arbeitman, M. N., Tower, J., Nuzhdin, S. and Tavare, S.(2013). Three-dimensional tracking and behaviour monitoring of multiple fruit flies.J. R. Soc. Interface10, 20120547.
Berclaz, J., Fleuret, F., Turetken, E. and Fua, P.(2011). Multiple object tracking using K-shortest paths optimization.IEEE Trans. Pattern Anal. Mach. Intell.33, 1806-1819.
Berman, G. J., Choi, D. M., Bialek, W. and Shaevitz, J. W.(2014). Mapping the stereotyped behaviour of freely moving fruit flies. J. R. Soc. Interface 11, 20140672.
Bishop, C. M. (2006).Pattern Recognition and Machine Learning. New York: Springer.
Branson, K. and Belongie, S.(2005). Tracking multiple mouse contours (without too many samples). IEEE Computer Society Conference on Computer Vision and Pattern Recognition, 2005, Vol. 1, pp. 1039-1046.
Branson, K., Robie, A. A., Bender, J., Perona, P. and Dickinson, M. H.(2009). High-throughput ethomics in large groups of Drosophila. Nat. Methods 6, 451-457.
Brent, L. J. N., MacLarnon, A., Platt, M. L. and Semple, S.(2013). Seasonal changes in the structure of rhesus macaque social networks. Behav. Ecol. Sociobiol.67, 349-359.
Certel, S. J. and Kravitz, E. A.(2012). Scoring and analyzing aggression in
Drosophila.Cold Spring Harb. Protoc.2012, 319-325.
Cheney, D. L. and Seyfarth, R. M.(1999). Recognition of other individuals’social relationships by female baboons.Anim. Behav.58, 67-75.
Clutton-Brock, T.(2007). Sexual selection in males and females.Science318, 1882-1885.
Coen, P., Clemens, J., Weinstein, A. J., Pacheco, D. A., Deng, Y. and Murthy, M.
(2014). Dynamic sensory cues shape song structure inDrosophila.Nature507, 233-237.
Dalal, N. and Triggs, B.(2005). Histograms of oriented gradients for human detection. IEEE Computer Society Conference on Computer Vision and Pattern Recognition, 2005, Vol. 1, pp. 886-893.
Dankert, H., Wang, L., Hoopfer, E. D., Anderson, D. J. and Perona, P.(2009). Automated monitoring and analysis of social behavior inDrosophila.Nat. Methods 6, 297-303.
Darwin, C.(1888).The Descent of Man, and Selection in Relation to Sex. London: J. Murray.
de Chaumont, F., Coura, R. D.-S., Serreau, P., Cressant, A., Chabout, J., Granon, S. and Olivo-Marin, J.-C.(2012). Computerized video analysis of social interactions in mice.Nat. Methods9, 410-417.
Dow, M. A. and von Schilcher, F.(1975). Aggression and mating success in Drosophila melanogaster.Nature254, 511-512.
Fiaschi, L., Diego, F., Gregor, K., Schiegg, M., Koethe, U., Zlatic, M. and Hamprecht, F.(2014). Tracking indistinguishable translucent objects over time using weakly supervised structured learning. Proceedings of the IEEE Conference on Computer Vision and Pattern Recognition, pp. 2736-2743.
Freund, J., Brandmaier, A. M., Lewejohann, L., Kirste, I., Kritzler, M., Kruger, A., Sachser, N., Lindenberger, U. and Kempermann, G.(2013). Emergence of individuality in genetically identical mice.Science340, 756-759.
Freund, J., Brandmaier, A. M., Lewejohann, L., Kirste, I., Kritzler, M., Kruger, A., Sachser, N., Lindenberger, U. and Kempermann, G. (2015). Association between exploratory activity and social individuality in genetically identical mice living in the same enriched environment.Neuroscience309, 140-152.
Gershow, M., Berck, M., Mathew, D., Luo, L., Kane, E. A., Carlson, J. R. and Samuel, A. D. T. (2012). Controlling airborne cues to study small animal navigation.Nat. Methods9, 290-296.
Girshick, R., Donahue, J., Darrell, T. and Malik, J. (2016). Region-based convolutional networks for accurate object detection and segmentation.IEEE Trans. Pattern Anal. Mach. Intell.38, 142-158.
Hamilton, W. D.(1964). The genetical evolution of social behaviour. I.J. Theor. Biol. 7, 1-16.
Hong, W., Kennedy, A., Burgos-Artizzu, X. P., Zelikowsky, M., Navonne, S. G., Perona, P. and Anderson, D. J.(2015). Automated measurement of mouse social behaviors using depth sensing, video tracking, and machine learning.Proc. Natl. Acad. Sci. USA112, E5351-E5360.
Hoopfer, E. D., Jung, Y., Inagaki, H. K., Rubin, G. M. and Anderson, D. J.(2015). P1 interneurons promote a persistent internal state that enhances inter-male aggression inDrosophila.Elife4, e11346.
Hoyer, S. C., Eckart, A., Herrel, A., Zars, T., Fischer, S. A., Hardie, S. L. and Heisenberg, M.(2008). Octopamine in male aggression ofDrosophila.Curr. Biol. 18, 159-167.
Insel, T. R.(2010). The challenge of translation in social neuroscience: a review of oxytocin, vasopressin, and affiliative behavior.Neuron65, 768-779.
Jhuang, H., Garrote, E., Mutch, J., Yu, X., Khilnani, V., Poggio, T., Steele, A. D. and Serre, T.(2010). Automated home-cage behavioural phenotyping of mice.
Nat. Commun.1, 68.
Kabra, M., Robie, A. A., Rivera-Alba, M., Branson, S. and Branson, K.(2013). JAABA: interactive machine learning for automatic annotation of animal behavior.
Nat. Methods10, 64-67.
Kabra, M., Robie, A. and Branson, K.(2015). Understanding Classifier Errors by Examining Influential Neighbors. Proceedings of the IEEE Conference on Computer Vision and Pattern Recognition, pp. 3917-3925.
Kim, Y., Venkataraju, K. U., Pradhan, K., Mende, C., Taranda, J., Turaga, S. C., Arganda-Carreras, I., Ng, L., Hawrylycz, M. J., Rockland, K. S. et al.(2015). Mapping social behavior-induced brain activation at cellular resolution in the mouse.Cell Rep.10, 292-305.
Kravitz, E. A. and Fernandez, M. L.(2015). Aggression inDrosophila.Behav. Neurosci.129, 549-563.
Lenz, P., Geiger, A. and Urtasun, R.(2015). FollowMe: Efficient online min-cost flow tracking with bounded memory and computation. In Proceedings of the IEEE International Conference on Computer Vision, pp. 4364-4372.
Libersat, F., Murray, J. A. and Hoy, R. R.(1994). Frequency as a releaser in the courtship song of two crickets,Gryllus bimaculatus(de Geer) and Teleogryllus oceanicus: a neuroethological analysis.J. Comp. Physiol. A174, 485-494.
Mersch, D. P., Crespi, A. and Keller, L.(2013). Tracking individuals shows spatial fidelity is a key regulator of ant social organization.Science340, 1090-1093.
Michelsen, A., Andersen, B. B., Kirchner, W. H. and Lindauer, M.(1989). Honeybees can be recruited by a mechanical model of a dancing bee.
Naturwissenschaften76, 277-280.
Narins, P. M., Grabul, D. S., Soma, K. K., Gaucher, P. and Hödl, W.(2005). Cross-modal integration in a dart-poison frog. Proc. Natl. Acad. Sci. USA 102, 2425-2429.
Neunuebel, J. P., Taylor, A. L., Arthur, B. J. and Egnor, S. E. R.(2015). Female mice ultrasonically interact with males during courtship displays.Elife4, e06203.
Noldus, L. P. J. J., Spink, A. J. and Tegelenbosch, R. A. J.(2001). EthoVision: a versatile video tracking system for automation of behavioral experiments.Behav. Res. Methods Instrum. Comput.33, 398-414.
Ohayon, S., Avni, O., Taylor, A. L., Perona, P. and Egnor, S. E. R.(2013). Automated multi-day tracking of marked mice for the analysis of social behaviour.
J. Neurosci. Methods219, 10-19.
Pavlou, H. J. and Goodwin, S. F.(2013). Courtship behavior in Drosophila melanogaster: towards a ‘courtship connectome’.Curr. Opin. Neurobiol. 23, 76-83.
Perez-Escudero, A., Vicente-Page, J., Hinz, R. C., Arganda, S. and de Polavieja, G. G.(2014). idTracker: tracking individuals in a group by automatic identification of unmarked animals.Nat. Methods11, 743-748.
Perony, N., Tessone, C. J., Konig, B. and Schweitzer, F.(2012). How random is social behaviour? Disentangling social complexity through the study of a wild house mouse population.PLoS Comput. Biol.8, e1002786.
Petru, M., Spinka, M., Charvatova, V. and Lhota, S. (2009). Revisiting play elements and self-handicapping in play: a comparative ethogram of five Old World monkey species.J. Comp. Psychol.123, 250-263.
Piccardi, M. (2004). Background subtraction techniques: a review. IEEE International Conference on Systems, Man and Cybernetics, Vol. 4, pp. 3099-3104.
Pirsiavash, H., Ramanan, D. and Fowlkes, C. C.(2011). Globally-optimal greedy algorithms for tracking a variable number of objects. IEEE Conference on Computer Vision and Pattern Recognition, pp. 1201-1208.
Ramdya, P., Schaffter, T., Floreano, D. and Benton, R.(2012). Fluorescence behavioral imaging (FBI) tracks identity in heterogeneous groups ofDrosophila.
PLoS ONE7, e48381.
Robie, A. A., Straw, A. D. and Dickinson, M. H.(2010). Object preference by walking fruit flies, Drosophila melanogaster, is mediated by vision and graviperception.J. Exp. Biol.213, 2494-2506.
Saka, E., Goodrich, C., Harlan, P., Madras, B. K. and Graybiel, A. M.(2004). Repetitive behaviors in monkeys are linked to specific striatal activation patterns.
J. Neurosci.24, 7557-7565.
Schiegg, M., Hanslovsky, P., Kausler, B., Hufnagel, L. and Hamprecht, F.
(2013). Conservation tracking. Proceedings of the IEEE International Conference on Computer Vision, pp. 2928-2935.
Schneider, J., Dickinson, M. H. and Levine, J. D.(2012). Social structures depend on innate determinants and chemosensory processing inDrosophila.Proc. Natl. Acad. Sci. USA109Suppl. 2, 17174-17179.
Seagraves, K. M., Arthur, B. J. and Egnor, S. E. R.(2016). Evidence for an audience effect in mice: male social partners alter the male vocal response to female cues.J. Exp. Biol.219, 1437-1448.
Seeds, A. M., Ravbar, P., Chung, P., Hampel, S., Midgley, F. M., Jr, Mensh, B. D. and Simpson, J. H.(2014). A suppression hierarchy among competing motor programs drives sequential grooming inDrosophila.Elife3, e02951.
Shannon, C. E.(1949). Communication in the presence of noise.Proc. Inst. Radio
Eng.37, 10-21.
Journal
of
Experimental
Shemesh, Y., Sztainberg, Y., Forkosh, O., Shlapobersky, T., Chen, A. and Schneidman, E.(2013). High-order social interactions in groups of mice.Elife2, e00759.
Simon, J. C. and Dickinson, M. H.(2010). A new chamber for studying the behavior ofDrosophila.PLoS ONE5, e8793.
Sokolowski, M. B.(2010). Social interactions in“simple”model systems.Neuron 65, 780-794.
Stoddard, P. K., Beecher, M. D., Horning, C. L. and Campbell, S. E.(1991). Recognition of individual neighbors by song in the song sparrow, a species with song repertoires.Behav. Ecol. Sociobiol.29, 211-215.
Swierczek, N. A., Giles, A. C., Rankin, C. H. and Kerr, R. A.(2011). High-throughput behavioral analysis inC. elegans.Nat. Methods8, 592-598.
Tchernichovski, O. and Golani, I.(1995). A phase plane representation of rat exploratory behavior.J. Neurosci. Methods62, 21-27.
Templeton, C. N., Greene, E. and Davis, K.(2005). Allometry of alarm calls: black-capped chickadees encode information about predator size.Science308, 1934-1937.
Vogelstein, J. T., Park, Y., Ohyama, T., Kerr, R. A., Truman, J. W., Priebe, C. E. and Zlatic, M. (2014). Discovery of brainwide neural-behavioral maps via multiscale unsupervised structure learning.Science344, 386-392.
Weissbrod, A., Shapiro, A., Vasserman, G., Edry, L., Dayan, M., Yitzhaky, A., Hertzberg, L., Feinerman, O. and Kimchi, T.(2013). Automated long-term tracking and social behavioural phenotyping of animal colonies within a semi-natural environment.Nat. Commun.4, 2018.
Yamamoto, D. and Koganezawa, M.(2013). Genes and circuits of courtship behaviour inDrosophilamales.Nat. Rev. Neurosci.14, 681-692.
York, R. A., Patil, C., Hulsey, C. D., Streelman, J. T. and Fernald, R. D.(2015). Evolution of bower building in Lake Malawi cichlid fish: phylogeny, morphology, and behavior.Front. Ecol. Evol.3, 18.