SIMULTANEOUS METHOD DEVELOPMENT AND VALIDATION OF
CITICOLINE AND PIRACETAM IN BULK AND ITS TABLET
DOSAGE FORM
Y. Samatha*1, A. Sri Vidya A. Ajitha and V. Uma maheswararao
Department of Pharmaceutical Analysis, CMR College of Pharmacy, Kandlakoya, Medchal,
Hyderabad. 501401.
ABSTRACT
A rapid and precise reverse phase high performance liquid
chromatographic method has been developed for the validated of
Citicoline and piracetam, in its pure form as well as in tablet dosage
form. Chromatography was carried out on a XBridge C18 (4.6 x
250mm, 5µm) column using a mixture of Methanol and Phosphate
buffer pH3 (85:15 v/v) as the mobile phase at a flow rate of 1.0ml/min,
the detection was carried out at 229nm. The retention time of the
Citicoline & Piracetam was 1.933, 3.396 min respectively. The method
produce linear responses in the concentration range of Citicoline-
12.5-62.5, and 5-25mg/ml of piracetam. The method precision for the
determination of assay was below 2.0%RSD. The method is useful in
the quality control of bulk and pharmaceutical formulations.
KEYWORDS: Citicoline & piracetam, RP-HPLC, validation. ; Tablet Dosage forms.
INTRODUCTION
Citicoline The drug is chemically
5O-[hydroxy({hydroxy[2-(trimethylammonio)ethoxy]phosphoryl}oxy)phosphroyl]cytidine Figure 1. It is an amorphous, somewhat hygroscopic powder having molecular weight 489.332 g/mol and pKa
value of 4.4. It is soluble readily in water to form acidic solution, practically insoluble in
most organic solvents. It is a psychotherapeutic agent used as psychostimulant, nootropics
and neurotonics. It exerts its action by activating the biosynthesis of structural phospholipids
in the neuronal membrane, increases cerebral metabolism, and increases the levels of various
Volume 4, Issue 8, 2383-2392. Research Article ISSN 2277– 7105
Article Received on 20 June 2015,
Revised on 11 July 2015, Accepted on 03 Aug 2015
*Correspondence for
Author
Y. Samatha
Department of
Pharmaceutical Analysis,
CMR College of
Pharmacy, Kandlakoya,
Medchal, Hyderabad.
501401.
indicated in conditions like cardiac stroke, head trauma, ischemic heart disease, and paralysis
of lower extremities and can also be given in adjunctive therapy as an alternative drug of
choice in Parkinson's disease. It is generally prescribed as an oral tablet containing 500 mg
drug.
Mechanism of action: Citicoline increases blood flow and O2 consumption in the brain. It is also involved in the biosynthesis of lecithin. Citicoline enhance the synthesis of
phosphatidyl-choline in brain but could inhibit destructive process (activation of phospholipases).
Piracetam: (sold under many brand names) is a nootropic drug in the racetams group, with chemical name 2-oxo-1-pyrrolidine acetamide. It shares the same 2-oxo-pyrrolidone base
structure with pyroglutamic acid. Piracetam is a cyclic derivative of GABA.The empirical
formula is C25H38O5. The chemical structures of Citicoline and piracetam are shown in
[image:2.595.144.454.563.734.2]Figure2.
Figure 1: Chemical structure of Piracetam
MATERIALS AND METHODS Reagents and chemicals
Methanol HPLC grade was procured from E.Merck Ltd, Mumbai. Methanol, Acetonitrile.
Fine chemicals, Hyderabad. Water HPLC grade was prepared using Millipore purification
system. Citicoline and piracetam reference standards procured from Sura Labs pharma
Pvt,Ltd Hyderabad.
Instrumentation
The HPLC system consists of water Empower -2695 having photodiode array detector
system, which was connected with the help of Empower 2 software for data integration and
processing. XBridge (250 X 4.6 mm) 5μ column was used for the analysis.
HPLC conditions
The contents of the mobile phase were ACN: Triethylamine buffer pH4 (85:15 v/v . These
were filtered through 0.45μ membrane filter and degassed by sonication before use. The flow
rate of mobile phase was optimized to 1.0 ml / min. The 6min and column temperature was
maintained at ambient. The volume of injection was 10μl, and the eluent was detected at 229
nm. Each of standard and test preparations was injected into the column and the responses
recorded (Fig.05 and Fig.06.).
Table 1.Optimized method parameters
PARAMETERS CHROMATOGRAPHIC CONDITIONS
Mobile phase ratio ACN: Triethylamine buffer pH4 (85:15 v/v)
Column XBridge C18 (4.6×250mm) 5µ
Detector PDA Detector
Column temperature 40ºC
Wavelength 229 nm
Flow rate 1 ml/min
Injection volume 10 µl
Run time 6 minutes
METHOD VALIDATION
The RP-HPLC Method of Citicoline and piracetam were achieved by isocratic elution
technique with PDA Detector. Citicoline and Piracetam were determined at 229nm
respectively with the concentration range of 0.20-0.8g/ml for both Citicoline and piracetam
respectively.fig.03 &04. For analysis of tablet formulation the tablet powder equivalent to 25
Whatmann filter paper No.41. From clear solution, further dilutions were made to get 10
g/ml of Citicoline and piracetam theoretically. Table 2.
[image:4.595.145.453.170.240.2]System suitability parameters
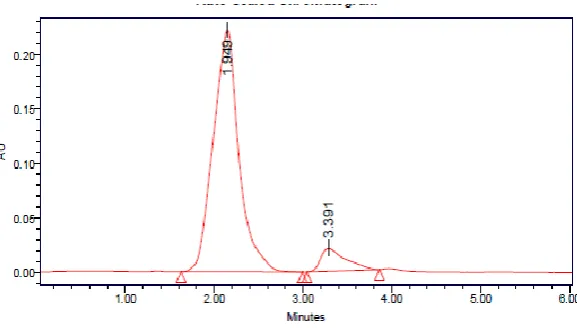
Table: 2 Result of system suitability parameters
Parameter Citicoline Piracetam
Retention time 1.933 3.396
Theoretical plates 4242 6515
Tailing factor 1.15 1.78
Area 409905 392596
The system suitability parameters were found to be within specified limits for the proposed
[image:4.595.143.454.296.478.2]method
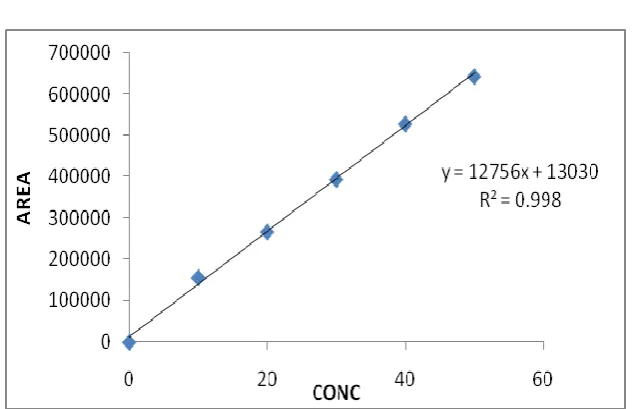
Fig. 6 :Calibration Curve for Citicoline
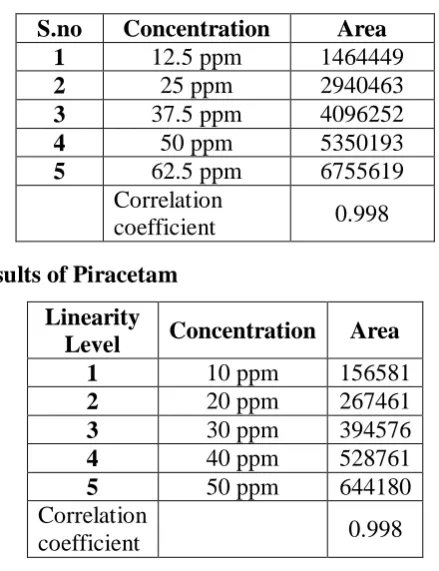
[image:4.595.140.457.506.710.2]Table: 7 Linearity Results of citicoline
S.no Concentration Area
1 12.5 ppm 1464449
2 25 ppm 2940463
3 37.5 ppm 4096252
4 50 ppm 5350193
5 62.5 ppm 6755619
Correlation
coefficient 0.998
Table: 8 Linearity Results of Piracetam Linearity
Level Concentration Area
1 10 ppm 156581
2 20 ppm 267461
3 30 ppm 394576
4 40 ppm 528761
5 50 ppm 644180
Correlation
coefficient 0.998
The linearity range was found to be 12-62.5µg/ml for Citicoline and 10-50µg/ml for
piracetam. calibration curve was plotted and correlation co-efficient for both the drugs found
to be 0.998.Hence the results obtained were within the limits. the linearity curves were shown
in The linearity chromatograms recorded were shown. The linearity results were reported in
Table.
Limit of detection :LOD was calculated by using standard deviation and slope values obtained from calibration curve.
LOD= 3.3 × σ / s
Table 9: LOD results of the Method
Drug Amount
Citicoline 27.9 Piracetam 1.76
Limit of quantitation: LOQ was calculated by using standard deviation and slope values obtained from calibration curve.
[image:5.595.185.405.86.372.2]LOQ=10×σ/S
Table 10: LOQ results of the Method
Drug Amount
From the above the LOD values of Citicoline and Piracetam were found to be 27.9 and
1.76µg/ml respectively. The LOQ values of Citicoline and Piracetam were found to be 84.5
[image:6.595.147.436.146.310.2]and 5.33µg/ml respectively. Thus the method developed was found to be sensitive.
Figure 8: Typical chromatograms for recovery studies
For recovery studies, to the reanalyzed formulation, solutions of raw material containing
different concentrations were added and the amount of drug recovered was calculated. The
procedure was repeated as per the analysis of formulation. The amount of drug recovered was
calculated by using slope and intercept values from the calibration graph. Finally the method
was validated as per ICH guide lines for precision, accuracy, specificity, linearity,
reproducibility, limit of detection and limit of quantification.
Table: 11 Accuracy Results of Citicoline %Concentration (at specification Level) Area Amount Added (ppm) Amount Found (ppm)
% Recovery Mean
Recovery
50% 212026.7 18.75 18.9 100.8
100.2%
100% 406885.7 37.5 37.2 99.2
150% 614558 56.25 56.7 100.8
Table: 12: Accuracy Results of Piracetam %Concentration (at specification Level) Area Amount Added (ppm) Amount Found (ppm)
% Recovery Mean
Recovery
50% 202430 15 14.8 98.9
99.9%
100% 394993.7 30 29.9 99.8
The accuracy studies were shown as % recovery for Citicoline and Piracetam at
50%,100%,150% ,the limits of recovery should be in range of 98-102% the limits obtained
for Citicoline and Piracetam were found to be within the limits. Hence the method was found
to be accurate. The accuracy studies shows % recovery of the Citicoline 100% and Piracetam.
the limits of % recovery of drugs were 98-102% and from the above results its indicates that
the method was accurate and also revealed that the commonly used exciepients present in the
pharmaceutical information do not interfere in the proposed method. the chromatograms of
shown in Fig 8. and results were shown Tables:11& 12.
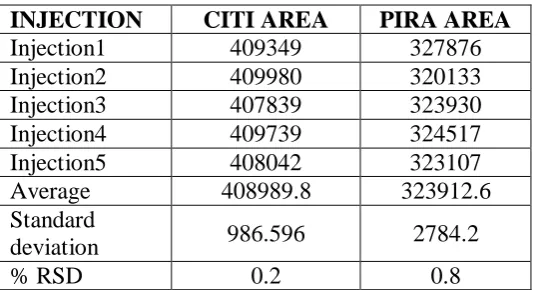
Precision: In the precision study,% RSD was found to be less than 2 % for citicoline 0.2% and piracetam 0.8 which indicates the system has a good reproducibility for precision studies
5 replicate studies of Citicoline and piracetam formulation( method precision) was
performed.% RSD was determined for peak areas of citicoline and piracetam. the acceptance
limits should be NMT 2% and the results were found to be within the acceptance limits
.results were reported in Table:13
Table 13 Results of System precision
INJECTION CITI AREA PIRA AREA
Injection1 409349 327876
Injection2 409980 320133
Injection3 407839 323930
Injection4 409739 324517
Injection5 408042 323107
Average 408989.8 323912.6
Standard
deviation 986.596 2784.2
[image:7.595.165.435.408.553.2]% RSD 0.2 0.8
Table 14. Results of Intermediate system precision
INJECTION CITI AREA PIRA AREA
Injection1 409600 323199
Injection2 409792 324588
Injection3 408131 326955
Injection4 409710 321726
Injection5 409596 323546
Injection6 409932 327755
Average 409460.2 324628.2
Standard
deviation 663.3016 2114.593
In the ID precision study, %RSD was found to be 2%.for citicoline 0.1 and piracetam 0.7
which indicates that the system has good reproducibility.
For intermediate precision studies 5 replicate injections of CITI and PIRA
formulation(method id precision) was performed.% RSD was determined for peak ares of
citicoline and piracetam. the acceptance limit were should be NMT 2% and the results were
obtained for sample(method id precision) were found to be wth in the acceptance limits. the
[image:8.595.150.449.244.418.2]id preciion chromatograms were showed in Fig.9.
Figure 9: Typical chromatogram of Citicoline and piracetam
RESULTS AND DISCUSSION
A simple, selective, rapid and precise validated RP-HPLC Method for Simultaneous
Estimation of Citicoline and piracetam in bulk material and in pharmaceutical formulation
has been developed and validated. The correlation coefficient was found to be
0.9997&0.9998 for Citicoline and piracetam respectively. In this method the % purity of
Citicoline and piracetam were found to be 101.25 ± 1.074 and 100.19 ± 1.031 respectively.
The recovery studies range is.99.98-100.01% and 99.94 – 100.03 % for Citicoline and
piracetam, respectively. The Intraday and Inter day analysis carried out for precision. The
ruggedness study was performed. In First order Derivative method the % purity were found
to be 100.25 ± 1.0054 and 101.49 ± 1.9305 for Citicoline and piracetam, respectively. The
recovery studies range is 99.98-100.01% and 99.94 – 100.03 %. Table 1.The Intraday and
Inter day analysis carried out for precision. The ruggedness study was performed. The
CONCLUSION
The developed RP-HPLC method was validated and the statistical validation was performed
with the simplicity and ease of operation ensures that the validated method can successfully
used for routine Analysis of Citicoline and piracetam in bulk and tablet dosage formulation.
ACKNOWLEDGEMENTS
The authors wish to thankful to Sura Labs, Pvt, Dilshuknagar, Hyderabad for providing the
gift samples of Citicoline and Piracetam. The authors are thankful to Chairman and Principal
of CMR College of pharmacy,Hyderabad, for their kind help and providing all necessary
facilities.
REFERENCE
1. Draft ICH Guidelines on Validation of Analytical Procedures Definitions and
terminology. Federal Register, vol 60. IFPMA, Switzerland, 1995; 1126.
2. Code Q2B, Validation of Analytical Procedures; Methodology. ICH Harmonized
Tripartite Guidelines, Geneva, Switzerland, 1996; 1-8.
3. Introduction to analytical method validation (online), available from
4. URL: http://www.standardbase.hu/tech/HPLC%20validation%20PE.pdf.
5. Snyder LR practical HPLC method development, 2nd edition. John Wiley and sons, New York, 1997; 180-182.
6. Sunitha. N,Subash C Marihal. development and validation of an RP-HPLC method fo
simultaneous estimation of citicoline and methylcobalamin, Journal of Global Trends in
Pharmaceutical Sciences 2014; 5(2): 1522- 1527.
7. Minakshi M. Dhoru, Sanjay Surani, Priti Mehta UV-Spectrophotometric Methods for
Determination of Citicoline sodium and Piracetam in Pharmaceutical Formulation,
Scholars Research Library, 2012; 1547-1552.
8. Neetu Sachan, Phool Chandra, Mayank Yadav, Dilipkumar Pal and Ashoke K Ghosh)
Rapid analytical procedure for Citicoline in bulk and pharmaceutical dosage form by UV
Spectrophotometer Journal of Applied Pharmaceutical Science 01 (06) ISSN: 2231-3354
2011; 191- 193.
9. Om sharma and tara chand Analytical method development and its validation
forestimation of Citicoline sodium by reversed phase high performance liquid
chromatography (RP-HPLC). International journal of research in pharmaceutical and
10.Babu, G. Prasad K, Thejonath Kolla, M. Vijayabaskaran, S. T. Latha. method
development and validation of RP-HPLC for simultaneous estimation of Citicoline and
Piracetam in tablet dosage form. International Journal of PharmTech Research CODEN