Analysis of Supervised Feature Selection Techniques on
Animal Husbandry Dataset
Neelendra Badal,
PhD
Professor
Kamla Nehru Institute of Technology, Sultanpur
Darpan Singh
Research Scholar
Kamla Nehru Institute of Technology, Sultanpur
ABSTRACT
Data mining techniques have become an obvious need of today’s high-dimensional animal industry data. In the last decade almost every aspect of animal related activities are being captured and stored either in local or central data repositories. Due to complex animal traits such as efficiency, growth, health, stress, behavior and adaptation, data mining is an area of challenge which can be optimally performed only with reduced number of relevant features. In this paper, a comparative analysis of various feature selection techniques based on some performance measuring parameter is presented using animal husbandry dataset. This research work finds J48 classifier to perform better in comparison to other traditional classification approaches.
General Terms
Application of data mining techniques on animal husbandry dataset, comparative analysis of most relevant feature subset selection techniques
Keywords
Data mining, Feature subset selection, Attribute selection, Animal husbandry
1.
INTRODUCTION
In the current world of digitalization, every business domain is generating huge amount of information, which generally queried only for getting generic periodic reports from database. All such queries can be answered through process discovery; however, bottlenecks can be analyzed through decision mining. Data and information both have turn out to be key resources for most of the businesses [4]. The success of any organization depends largely on the extent to which the data acquired from business operations is utilized [11]. Data Mining is the process of extracting meaningful essence from mostly unsupervised data by analyzing it from different perspectives and summarizing it into useful knowledge by means of a number of analytical tools and techniques, thus added knowledge should be beneficial, effective, reasonable and innovative in existing domain. In other words, it is understood that businesses use such knowledge into their strategic decision making to put them ahead of their opponents.
Data Mining in animal husbandry domain is an area of challenge since the data involves in it is massive but heterogeneously maintained, inconsistency in data collection and due to complex animal traits, such as efficiency, growth, health, stress, behavior and adaptation. The amount of transactional data generated during its day-to-day operations is massive. Although these transactions record every instance of any activity, it is of little use in decision making. Hence, the advantage of data mining is taken in to attempt to extract smaller pieces of valuable information from this massive database.
In an organization where management is keen to reduce the overall product discard percent by identifying the major elements of root cause, it is obvious that there would be some complex relationship between the various attributes playing important role for sample discard. As in the case study taken, where the input conditions for “Initial Discard” are not explicitly represented in the dataset, however few attributes in single or combination would be responsible for initial discard. Therefore, the goal of this work is to find the factors which are responsible for various reasons of discard for the particular sample.
The rest of the paper is structured as follows. In section 2, a brief introduction of related work is given. Section 3 looks at the material and methods required for feature subset selection. In section 4, feature selection methodology is presented and performance comparison has been done, section 5 describes the result and in section 6 the research conclusion has been drawn followed by future scope of the work in section 7.
2.
RELATED WORK
3.
MATERIAL AND METHODS
3.1
Dataset used
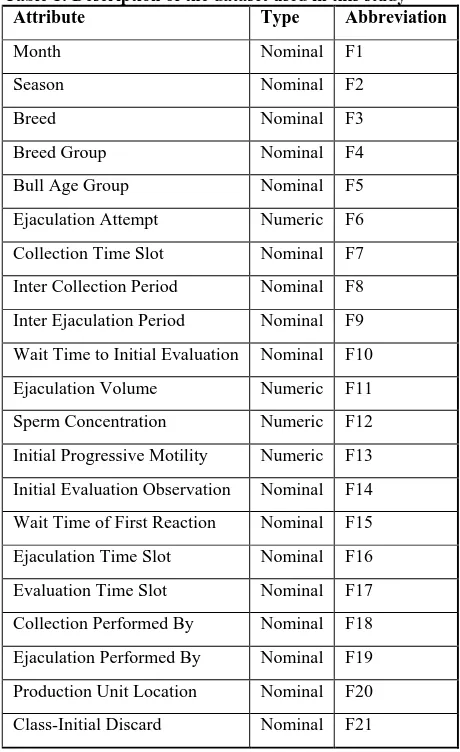
[image:2.595.52.282.279.655.2]The dataset used for this survey is a custom dataset inspired by the production cycle of bovine semen. In order to avoid author’s bias, several attributes such as animal id, production date, etc were removed from the dataset a prior to preprocessing. In this dataset, the problem is considered to find the best suitable feature subset from the attribute space which may play significant role in deciding the support factor for discarding an ejaculation sample during the online production activity, failing which the production of substandard sample may be continued up to next quality check phase usually performed after 24 hours of production cycle, which involves cost and time complexity of the business. The problem has been taken for early detection and diagnosing the factors causing the sample to initial discard. The table 1 shows the considered attributes, their type and the abbreviation used further in this study.
Table 1: Description of the dataset used in this study Attribute Type Abbreviation
Month Nominal F1
Season Nominal F2
Breed Nominal F3
Breed Group Nominal F4
Bull Age Group Nominal F5
Ejaculation Attempt Numeric F6
Collection Time Slot Nominal F7
Inter Collection Period Nominal F8
Inter Ejaculation Period Nominal F9
Wait Time to Initial Evaluation Nominal F10
Ejaculation Volume Numeric F11
Sperm Concentration Numeric F12
Initial Progressive Motility Numeric F13
Initial Evaluation Observation Nominal F14
Wait Time of First Reaction Nominal F15
Ejaculation Time Slot Nominal F16
Evaluation Time Slot Nominal F17
Collection Performed By Nominal F18
Ejaculation Performed By Nominal F19
Production Unit Location Nominal F20
Class-Initial Discard Nominal F21
During data preprocessing, it was observed that the class attribute was majorly imbalanced by a 10:1 ratio. In this paper, two preprocessing instance based filters; supervised “spread sub sample” and unsupervised “randomize” for converting the dataset into balanced class (1:1) dataset has been used. After preprocessing, 21 features are selected for further study.
3.2
Tools used
The experiments have been performed on WEKA software package, which was developed at the University of Waikato in New Zealand. WEKA is implemented in Java language and being considered the most competent and comprehensive package with machine learning algorithms, and highly recommended in academic and non-profit research domain areas. This package is a collection of machine learning algorithms for various tasks in data mining. Such ML algorithms may either be used straightway to the dataset or can be called using Java API code. WEKA contains several tools for data pre-processing, classification, regression, clustering, association rules, and visualization. It has mainly five applications named Explorer, Experimenter, Knowledge Flow, Workbench and Simple CLI.WEKA is also suitable for developing new machine learning systems. It has two primary modes; WEKA Explorer and WEKA Experimenter. The explorer mode allows to easily access of all WEKA modules, while the experimenter mode provide the platform to run the several algorithms on several datasets for comparing and analysis of the result. WEKA is open source software and issued under the GNU General Public License [16].
3.3
Classifier used
Figure 1: A hierarchical diagram of classifiers in WEKA
In this paper, performance comparison has been performed with the parameters such as; classification accuracy %, Root Mean Square error (RMSE), and User CPU Time for the analysis purpose.
Classification Algorithms ZeroR
In the classification techniques used in data mining, ZeroR can be understood as the simplest methodology under rule classifier category in WEKA, which deals with 0-R classifier based algorithm to predict the mean for numeric class and mode for nominal class attribute.
Naïve Bayes
Naïve Bayes classifier uses estimator class and analyzes the training data to evaluate the numeric estimator precision values.
IBk
In WEKA, the K-nearest neighbour classifier is known as IBk. It can select the appropriate value for K based on cross-validation and can perform distance weighting.
Decision Table
In [7], the researcher explained the power of decision and proposed for building class based on a simple decision table majority classifier.
Decision Stump
Decision Stump classifier generally works in collaboration with a boosting algorithm but treats missing values as separate values. This algorithm can perform mean square error for regression analysis and entropy based classification.
Hoeffding Tree
This algorithm works well with massive data and assumes the training examples does not change over time. It is an incremental and anytime decision tree training algorithm.
J48
It is based on very popular C4.5 algorithm; C4.8 was written to support Java in WEKA and named as J48. J48 can generate pruned or unpruned C4.5 based decision tree.
J48graft
This algorithm is the extension of J48 and can produce grafted pruned or unpruned C4.5 based decision tree.
Random Tree
Random tree algorithm chooses K random attributes at each node to construct the tree and do not perform pruning but provides an option to estimate the class probability based on backfitting.
3.4
Methods used
For feature selection, some popular attribute selectors along with few specialized algorithms have been explored; in WEKA, CfsSubsetEval considers the predictive ability and level of redundancy between the features for evaluating its significance; Consistency Subset Evaluator measures the consistency level of the class attribute’s value by imposing the training instances on selected feature subsets; ClassifierSubsetEval uses a classifier to measure the merit of the attribute subset on training data or using a separate hold out test set. The search methods which have taken into consideration in the study are; BestFirst, which searches over the attribute subset space by greedy hillclimbing improved with a backtracking facility; Evoluationary Search algorithm searches the attribute space by a customizable set of operators for uniform random initialization, binary tournament selection, single point crossover, bit flip mutation and generational replacement with elitism; Genetic Search is simply based on genetic algorithm [1], [10]; Greedy Stepwise searches the attribute subset space in greedy forward or backward search with no or all attributes at start and stops only when adding or deleting adversely affecting the evaluation; Linear Forward Selection takes k number of attributes in starting and searches both way, is an extension of Best First search algorithm; Multi Objective Evolutionary Search uses ENORA algorithm to explore the attribute space for optimizing its two objectives [5].
4.
Feature Selection Methodology
WEKA package has been used in explorer mode to use the attribute selector module for obtaining relevant attribute subset from attribute space. During the process several iterations of attribute selector with different set of attribute evaluator and search methods is performed, the table
Classification Algorithm
Bayes
•Bayes Net •Naive Bayes
Functions
•Logistics
•Multilayer Perceptron •SMO
Lazy
•IBk •KStar •LWL
Meta
•AdaBoostM1 •Bagging
•Random Committee
Misc
•InputMappedClassifier •SerializedClassifier
Rules
•Decision Table •OneR •PART •ZeroR
Trees
•Decision Stump •Hoeffding Tree •J48
contained the information about attribute evaluator, the search method used and the number of attribute subset obtained. The attribute subset evaluator CfsSubsetEvaluator (AE1), Classifier Subset Evaluator (AE2), Consistency Subset Evaluator (AE3) is tested with search methods Best First (SM1), Evolutionary Search (SM2), Genetic Search (SM3), Greedy Stepwise (SM4), Linear Forward Selection (SM5) and Multi-Objective Evolutionary Search (SM6). For further analysis custom name is given to the group of the similar attribute subset outcomes.
Table 2: Categorization of feature subsets outcome Attribute
Evaluator
Search Metho d
Selected Feature Subset Group
AE1
SM1 F2,F8,F10,F12,F13 : 5 I
SM2 F2,F8,F10,F12,F13,F20 : 6 III
SM3 F2,F4,F5,F6,F7,F8,F12,F13,
F15,F18 : 10 II
SM4 F2,F8,F10,F12,F13 : 5 I
SM5 F2,F8,F10,F12,F13 : 5 I
SM6 F2,F8,F10,F11,F12,F13 : 6 IV
AE2
SM1 F11,F12,F13 : 3 X
SM2 F2,F5,F11,F12,F13,F20 : 6 V
SM3 F4,F5,F6,F7,F8,F12,F15,F18
: 8 XI
SM4 F11,F12,F13 : 3 X
SM5 F11,F12,F13 : 3 X
SM6 F11,F12,F13 : 3 X
AE3
SM1 F1,F12,F13,F14,F18 : 5 VI
SM2 F7,F10,F12,F13,F14,F18 : 6 VII
SM3 F1,F12,F13,F14,F18 : 5 VIII
SM4 F1,F12,F13,F14,F18 : 5 VIII
SM5 F1,F12,F13,F14,F18 : 5 VIII
SM6 F2,F5,F8,F10,F12,F13,F14 :
7 IX
4.1
Evaluation of Feature selection
techniques
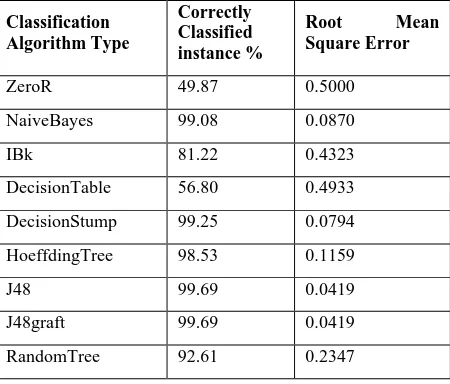
[image:4.595.49.545.202.685.2]In this study, the classification tasks using various algorithms have been performed on the full dataset prior to applying the feature selection techniques. The classification accuracy has been shown in Table 3. For analysis purpose, various subset groups of attributes has been taken sequentially and performed the classification task using several selected classification techniques to evaluate the accuracy %, root mean square error value and User CPU Time to analyze the best suitable feature selection technique which can correctly classify the majority of instances and Root Mean Square Error for differentiating between the strengths of various feature subset selection methods, while the User CPU Time is considered to analyze the time complexity of the feature selection techniques. The results are given in tables and conclusion is given in section 5.
Table 3: Classification accuracy of different algorithms
Classification Algorithm Type
Correctly Classified instance %
Root Mean Square Error
ZeroR 49.87 0.5000
NaiveBayes 99.08 0.0870
IBk 81.22 0.4323
DecisionTable 56.80 0.4933
DecisionStump 99.25 0.0794
HoeffdingTree 98.53 0.1159
J48 99.69 0.0419
J48graft 99.69 0.0419
RandomTree 92.61 0.2347
Table 4.1 Classification accuracy % for CfsSubsetEval attribute selector for various search methods
Search Method Group
No. ZeroR Naïve Bayes IBk
Decision Table
Decision Stump
Hoeffding Tree J48
J48 graft
Random Tree
SM1, SM4, SM5 I 49.87 99.12 97.62 98.38 99.25 99.17 99.71 99.71 99.33
SM3 II 49.87 99.08 83.88 99.25 99.25 99.17 99.71 99.71 98.06
SM2 III 49.87 99.12 96.75 98.98 99.25 99.17 99.71 99.71 99.22
[image:4.595.317.542.271.463.2]Table 4.2 Root Mean Square Error analysis for CfsSubsetEval attribute selector for various search methods
Search Method Group
No. ZeroR Naïve Bayes IBk
Decision Table
Decision Stump
Hoeffding Tree J48
J48 graft
Random Tree
SM1, SM4, SM5 I 0.50 0.0871 0.1514 0.1131 0.0794 0.0829 0.0405 0.0405 0.0724
SM3 II 0.50 0.0887 0.4004 0.0802 0.0794 0.0829 0.0405 0.0405 0.1211
SM2 III 0.50 0.0876 0.1763 0.0962 0.0794 0.0829 0.0405 0.0405 0.0774
SM6 IV 0.50 0.0869 0.1621 0.0712 0.0794 0.0829 0.0405 0.0405 0.0739
Table 4.3 UserCPU_Time_millis_training analysis for CfsSubsetEval attribute selector for various search methods
Search Method Group
No. ZeroR
Naïve
Bayes IBk
Decision Table
Decision Stump
Hoeffding Tree J48
J48 graft
Random Tree
SM1, SM4, SM5 I 0.1563 0.9375 0.4687 5.7812 0.4688 5.1562 1.7188 2.8125 0.7812
SM3 II 0.1563 0.9375 0.0000 6.7188 0.3125 9.3750 2.1875 4.2187 0.7813
SM2 III 0.0000 0.7813 0.3125 4.5312 0.1563 6.0938 1.5625 2.9688 1.4063
SM6 IV 0.3125 0.6250 0.3125 4.8438 0.4688 6.5625 1.7187 2.0312 0.9375
Table 5.1 Classification accuracy % for Classifier Subset Evaluator attribute selector for various search methods Search
Method
Group
No. ZeroR
Naïve
Bayes IBk
Decision Table
Decision Stump
Hoeffding Tree J48
J48 graft
Random Tree
SM2 V 49.8745 99.1199 98.709 99.149 99.246 99.1745 99.707 99.7067 99.426
SM1, SM4,
SM5, SM6 X 49.8745 99.1199 99.485 99.258 99.246 99.1745 99.707 99.7067 99.497
SM3 XI 49.8745 65.5911 61.007 54.25 67.268 68.0426 71.497 71.4966 65.956
Table 5.2Root Mean Square Error analysis for Classifier Subset Evaluator attribute selector for various search methods Search
Method
Group
No. ZeroR Naïve
Bayes IBk
Decision Table
Decision Stump
Hoeffding Tree J48
J48 graft
Random Tree
SM2 V 0.5000 0.0869 0.1087 0.0844 0.0794 0.0829 0.0405 0.0405 0.0615
SM1, SM4,
SM5, SM6 X 0.5000 0.0869 0.0594 0.0788 0.0794 0.0829 0.0405 0.0405 0.0584
SM3 XI 0.5000 0.4607 0.6237 0.4987 0.4447 0.4460 0.4364 0.4365 0.5705
Table 5.3 UserCPU_Time_millis_training analysis for Classifier Subset Evaluator attribute selector for various search methods
Search Method
Group
No. ZeroR Naïve
Bayes IBk
Decision Table
Decision Stump
Hoeffding Tree J48
J48 graft
Random Tree
SM2 V 0.3125 0.4688 0.1563 4.6875 0.9375 6.5625 2.3438 3.7500 1.4063
SM1, SM4,
SM5, SM6 X 0.1563 1.0938 0.3125 3.4375 1.2500 5.7813 2.0312 2.3438 2.3438
SM3 XI 0.3125 0.6250 0.3125 3.1250 0.6250 4.6875 8.2813 23.2813 4.0625
Table 6.1 Classification accuracy % for Consistency Subset Evaluator attribute selector for various search methods Search
Method
Group
No. ZeroR
Naïve
Bayes IBk
Decision Table
Decision Stump
Hoeffding Tree J48
J48 graft
Random Tree
SM1 VI 49.8745 99.1199 98.998 82.97 99.246 98.5329 99.707 99.7067 99.216
SM2 VII 49.8745 99.1199 98.294 99.074 99.246 98.5329 99.686 99.6858 98.755
SM3, SM4,
Table 6.2 Root Mean Square Error analysis for Consistency Subset Evaluator attribute selector for various search methods Search
Method
Group
No. ZeroR Naïve
Bayes IBk
Decision Table
Decision Stump
Hoeffding Tree J48
J48 graft
Random Tree
SM1 VI 0.5000 0.0855 0.0940 0.2698 0.0794 0.1159 0.0405 0.0405 0.0782
SM2 VII 0.5000 0.0858 0.1265 0.0938 0.0794 0.1159 0.0419 0.0419 0.0977
SM3, SM4,
SM5, SM6 VIII 0.5000 0.0854 0.0746 0.1945 0.0794 0.1159 0.0405 0.0405 0.0749
Table 6.3 UserCPU_Time_millis_training analysis for Consistency Subset Evaluator attribute selector for various searches Search
Method
Group
No. ZeroR Naïve
Bayes IBk
Decision Table
Decision Stump
Hoeffding Tree J48
J48 graft
Random Tree
SM1 VI 0.1563 0.7813 0.1563 4.3750 0.6250 4.2187 1.7187 2.8125 2.3437
SM2 VII 0.0000 0.7813 0.0000 4.0625 0.6250 4.5312 2.0312 3.1250 1.5625
SM3, SM4,
SM5, SM6 VIII 0.0000 0.1563 0.0000 4.0625 0.6250 3.9063 2.1875 2.3438 1.0937
5.
RESULTS
The result analysis is performed by comparative evaluations of various classifications technique as carried out in table 4.1 to 6.3. The table 4, 5, and 6 are subdivided equally for each parameter performance values. Based on the values in table 4.1, the correctly classified instance has been obtained on 4 feature subset groups with all search methods and the highest accuracy 99.71% of correctly classified instance is obtained by Hoeffding Tree, J48 and J48graft in comparison to base classifier performance of only 49.87% of correctly classified instance. In table 4.2, the highest RMSE has come from ZeroR as 0.5 and the lowest RMSE from J48 and J48graft as 0.0405. In table 4.3, the ZeroR classifier got lowest User CPU time 0sec on group III and search method SM2, while Hoeffding Tree taken highest User CPU Time 9.375sec on feature subset group II on selection method SM3.
Based on the values in table 5.1, the correctly classified instance has been obtained on 3 feature subset groups with all search methods and the highest accuracy 99.7067% of correctly classified instance is obtained by J48 and J48graft Tree using group V and group X with search methods SM2 and SM1, SM4, SM5, SM6 respectively, in comparison to base classifier performance of only 49.8745% of correctly classified instance. In table 5.2, the highest RMSE has came from IBk as 0.6237 on group XI with search method SM3 and the lowest RMSE from J48 and J48graft for group V and group X as 0.0405 with search methods SM2 and SM1, SM4, SM5, SM6 respectively. In table 5.3, the ZeroR classifier got lowest User CPU time 0.1563sec on group X with search methods SM2 and SM1, SM4, SM5, SM6 and IBk for group V with search method SM2, while J48graft Tree taken highest User CPU Time 23.2813sec on group XI with search method SM3.
Based on the values in table 6.1, the correctly classified instance has been obtained on 3 feature subset groups with all search methods and the highest accuracy 99.7067% of correctly classified instance is obtained by J48 and J48graft Tree using group VI and group VIII with search methods SM1 and SM3, SM4, SM5, SM6 respectively, in comparison to base classifier performance of only 49.8745% of correctly classified instance. In table 6.2, the highest RMSE has came from ZeroR as 0.5 on all group and the lowest RMSE from J48 and J48graft for group VI and group VIII as 0.0405 with
search methods SM1 and SM3, SM4, SM5, SM6 respectively. In table 6.3, the ZeroR and IBk classifier got lowest User CPU time 0sec on group VII and VIII with search methods SM2 and SM3, SM4, SM5, SM6, while Hoeffding Tree taken highest User CPU Time 4.5312sec on group VII with search method SM2.
6.
CONCLUSION
In this paper 3 attribute evaluators have been adopted; correlation based feature selection evaluator, classifier subset evaluator and consistency subset evaluator in conjunction search methods; Best First, Evolutionary Search, Genetic Search, Greedy Stepwise, Linear Forward Selection and Multi-Objective Evolutionary Search to select the relevant feature subset and then used 9 different classifiers to analyze the classification performance on the basis of 3 measurement criteria. Experimental results as obtained in previous section, it can be concluded that classification processing is simplified after using the feature selection techniques. The feature selection techniques notably reduced the feature subset required for classification and contributed in classifier performance improvement. The study found that the J48 and J48graft both the classifiers are performing well excluding two combinations SM2-GroupVII and SM3-GroupXI. Classifier Hoeffding Tree has also significantly shown considerably good performance, but similar to J48graft have taken the highest User CPU Time in Table 4.3, 6.3 and in Table 5.3 respectively. Therefore, based on the analysis of various parameters such as classification accuracy %, Root Mean Square Error and User CPU Time evaluation, the result shown the group III and group VIII feature subset performing well with Evolutionary Search method with correlation based feature selection evaluator and consistency subset evaluator. However, in all respect J48 is the best classification technique for animal husbandry dataset as taken in this case study.
7.
FUTURE SCOPE
predicting the product discard at later stage, which enable business to take corrective measures in advance.
8.
ACKNOWLEDGMENTS
Authors of this paper extend our cordial thanks to Director KNIT & HOD Computer Science & Engineering, Dr. A. K. Malviya, Professor, for their valuable support to our efforts to complete this work.
9.
REFERENCES
[1] Booker, L. B., Goldberg, D. E., Holland, J. H. (1989/09). "Classifier systems and genetic algorithms." Artificial Intelligence 40(1-3): 235-282.
[2] Dash, M and H. Liu, 2000. “Feature selection for classification”, Intelligent Data Analysis., 1(1): 131-156.
[3] Forman, G. 2003. An extensive empirical study of feature selection metrics for text classification. J. Mach. Learn. Res. 3 (Mar. 2003), 1289-1305.
[4] I.H. Witten, E. Frank and M.A. Hall, Data mining practical machine learning tools and techniques, Morgan Kaufmann publisher, Burlington 2011
[5] Jiménez, F., Gómez-Skarmeta, A.F., Sánchez, G., Deb, K.: An evolutionary algorithm for constrained multi-objective optimization. In: Proceedings IEEE World Congress on Evolutionary Computation (2002)
[6] John, G.H., Kohavi, R. and Pfleger, K., Irrelevant features and the subset selection problem. In: Proceedings of the Eleventh International Conference on Machine Learning, 121–129, 1994.
[7] Kohavi R. (1995) The power of decision tables. In: Lavrac N., Wrobel S. (eds) Machine Learning: ECML-95. ECML 19ECML-95.
[8] L. Zhang, F.M. Zhang, Y.F. Hu, “A Two-phase Flight Data Feature Selection Method Using both Filter and Wrapper” Proceedings of the Software Engineering, Artificial Intelligence, Networking, and Parallel/Distributed Computing, 2007, SNPD 2007, pp.447-452.
[9] M. Hall and G. Holmes, "Benchmarking Attribute Selection Techniques for Discrete Class Data Mining," IEEE Transactions on Knowledge and Data Engineering, vol. 15, pp. 1437 - 1447, 2003.
[10]M.Dash and H.Liu, Feature selection for Classification, In Intelligent Data Analysis, vol. 1, no. 3,1997
[11]Tapas Ranjan Baitharu, Subhendu Kumar Pani, Analysis of Data Mining Techniques For Healthcare Decision Support System Using Liver Disorder Dataset, Procedia Computer Science 85 (2016) 862-870
[12]Vafai H., and De Jong, K. 1992, Genetic algorithms as a tool for feature selection in machine learning. In Fourth International Conference on Tools with Artificial Intelligence, 200-203, IEEE Computer Society Press [13]Vasantha, M., Bharathy, V.S. 2010. "Evaluation of
Attribute Selection Methods with Tree based Supervised Classification", International Journal of Computer Applications, Vol. 8, No. 12, pp. 35-38, (Oct. 2010).. [14]Y.liu and M. Schumaan, Data mining feature selection
for credit scoring models , Journal of Operation Research Society (2005) 56, pp. 1099-1108, published online 20 April 2005.
[15]Y. Saeys, I. Inza, and P. Larrañaga, “A review of feature selection techniques in bioinformatics,” Bioinformatics, 23(19), 2007, pp. 2507-2517.
[16]WEKA: Waikato Environment for Knowledge Analysis, http://www.cs.waikato.ac.nz/ml/weka.
10.
AUTHOR’S PROFILE
Dr. Neelendra Badal, B.E., M.E., Ph.D. Working as Associate Professor at Kamla Nehru Institute of Technology, Sultanpur in the Department of Computer Science & Engineering. He has more than of 20 years of teaching experience. His area of specialization is Distrtibuted Computing, Web Technology, Data Warehouse & Mining, Communication, Control, Networking, Information Technology, GIS. He has published more than 37 National/International publications.