Abstract—Wire-cut electrical discharge machining (WEDM) is a popular choice for machining hard and difficult to machine materials with very close tolerances. However, the widely held assumption of the high accuracy of WEDM needs to be investigated, which is the primary aim of this research. This paper presents the experimental and analytical results of an investigation into the dimensional accuracy achievable in WEDM. Three techniques—traditional analysis, the Taguchi method, and Pareto ANOVA analysis—are employed to determine the effects of six major controllable machining parameters: the discharge current, pulse duration, pulse gap frequency, wire speed, wire tension, and dielectric flow rate on three key dimensional accuracy characteristics of the prismatic component parts—linear dimensional errors, flatness errors, and perpendicularity errors of corner surfaces. Subsequently, the input parameters are optimized in order to maximize the dimensional accuracy characteristics. The results indicate that the dimensional accuracy that is achievable in wire-cut electrical discharge machining is not as high as anticipated.
Index Terms—Wire-cut electrical discharge machining, dimensional accuracy, Pareto ANOVA analysis, Taguchi methods.
I. INTRODUCTION
Wire-cut electrical discharge machining (WEDM) is one of the most widely used non-traditional machining processes in current manufacturing. It involves the removal of metal by discharging an electrical current from a pulsating DC power supply across a thin interelectrode gap between the tool and the workpiece. It is a popular choice for machining hard and difficult to machine materials with very close tolerances. Generally, WEDM is perceived to be an extremely actuate process and there are various reasons for this perception. Firstly, in WEDM, no direct contact takes place between the cutting tool (electrode) and the workpiece; as a result, the adverse effects—mechanical stresses, chatter, and vibration—normally present in traditional machining are eliminated. Secondly, the wire used as a cutting tool has high
Manuscript received February 19, 2010.
M. N. Islam is a lecturer at the Department of Mechanical Engineering, Curtin University of Technology, GPO Box U1987, Perth, WA 6845, Australia (phone: +618 9266 3777; fax: +618 9266 2681; (e-mail:
N. H. Rafai is a postgraduate student at the Department of Mechanical Engineering, Curtin University of Technology, GPO Box U1987, Perth, WA 6845, Australia (e-mail: [email protected]).
S. S. Subramanian is a final year student at the Department of Mechanical Engineering, Curtin University of Technology, GPO Box U1987, Perth, WA 6845, Australia (e-mail: [email protected]).
mechanical properties and small diameters (0.076 to 0.30 mm [1]), which is believed to produce very fine, precise, and clean cuts. Finally, in WEDM, the movements of the workpiece during cutting are controlled by a highly accurate computer numerical controlled (CNC) system (with positioning accuracy up to 0.5 m [1]); as a result, the effects of positioning errors present in conventional machining are significantly diminished. However, this perception of the high accuracy of WEDM needs to be investigated, which the primary objective of this project.
Since its advent in the early 1970s, there have been numerous papers reported on various aspects of WEDM, such as metal removal rate [2, 3], surface finish [3–5], and process modeling [6]. However, there has been less interest in the dimensional accuracy achievable by this process [7–9]. In addition, the reported studies on WEDM concentrated on a single dimensional accuracy characteristic only and, as such, did not take into account their combined effects on machined parts. Therefore, in this paper, an attempt has been made to examine three key dimensional accuracy characteristics of parts produced by WEDM concurrently, and to find the optimum combination major controllable input parameters.
II.SCOPE
The main objective of this project is to investigate the dimensional accuracy characteristics achievable of typical component parts produced by the WEDM process. For the sake of simplicity, in this study, a rectangular block is selected as a test part, details of which are given in the following section. For such a part, the three most important dimensional accuracy characteristics are: (i) linear dimensional error, (ii) the flatness of the surfaces produced, and (iii) the perpendicularity error of the corners. Thus, the characteristics were selected here to monitor the quality of the parts produced by WEDM. The six independent input parameters chosen are: (i) discharge current, (ii) pulse duration, (iii) pulse gap frequency, (iv) wire speed, (v) wire tension, and (vi) dielectric flow rate. A general purpose coordinate machine (CMM) is employed for the measurement of the output parameters. The results are analyzed by three techniques: (i) traditional analysis, (ii) Pareto analysis of variation (ANOVA), and (iii) Taguchi’s signal-to-noise ratio (S/N) analysis. The expected outcomes of this project are: (i) to get a clear picture of the machining accuracy achievable in WEDM, (ii) to find out the influences of the six input parameters on the accuracy of a typical component part produced by WEDM, and (iii) to optimize the input parameters.
An Investigation into Dimensional Accuracy
Achievable in Wire-cut Electrical Discharge
Machining
variables were used. For the Taguchi method, the
signal-to-noise ratio was calculated using the following formula [10]:
n i
i
y n N
S
1 2
1 1
log
10 (1)
where S/N is the signal-to-noise ratio (in dB), n is the number of observations, and y is the observed data.
The above formula is suitable for quality characteristics in which “the smaller the better” holds true. This is the case for all three quality characteristics considered. The higher the value of the S/N ratio, the better the result is because it guarantees optimum quality with minimum variance. A thorough treatment of the Taguchi method can be found in [10]. Pareto ANOVA is a simplified ANOVA analysis method that does not require an ANOVA table; further details of Pareto ANOVA can be found in [11].
III. EXPERIMENTAL WORK
The experiments were planned using Taguchi’s orthogonal array methodology and a three-level L27 (313)orthogonal
array was selected for our experiments. A total of 27 experimental runs were conducted. Besides the six main effects (A to F), two interaction effects were also selected for analysis. The selected interactions are between the discharge current and pulse duration (AxB) and between the discharge current and dielectric flow rate (AxF).
Even though one of the main advantages of using WEDM is its ability to cut hard and difficult to machine materials with low machinability ratings, in this study, mild steel 1040 was chosen as the work material because of its low cost and availability. Nevertheless, it is anticipated that hard and difficult to machine materials will produce inferior machining accuracy. The designed sizes for the rectangular test part (L×W×H) were 20×10×15 mm. Cutting was performed on a 15 mm plate and the rectangular block was extracted from the plate by means of cutting along the contour. The height remains as it is because machining was not done on the height.
A total of twenty-seven test parts marked TP1 to TP27 were produced on a FANUC ROBOCUT oiD, manufactured by FANUC, Japan. It is a high performance wire-cut EDM equipped with digital servo technology. The available machining space for this machine is 370×270×255 mm along the X-, Y-, and Z-axes, respectively. The wire used is an EDM brass wire with a 0.25 mm diameter, well-known for its excellent mechanical properties and its capability to achieve high dimensional accuracy.
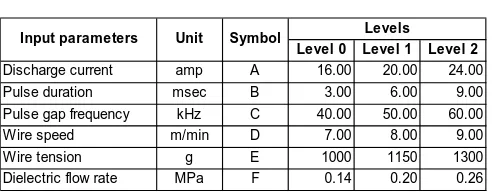
The six most important input variables were selected after an extensive literature review and subsequent preliminary investigations. Their limits were set on the basis of the capacity and limiting cutting conditions of the WEDM, ensuring continuous cutting by avoiding the breakage of the wire; details are given in Table 1.
The precision measurements were taken by a Discovery Model D-8 coordinate measuring machine (CMM), manufactured by Sheffield, UK. The probes used were spherical probes with a star configuration, manufactured by
[image:2.595.305.551.229.325.2]calculated using the standard built-in software package of the CMM. For each length feature, 14 measurements were taken at a 1 mm height step. The difference between the measured size and the designed size is the linear dimensional error, thus, a positive error indicates over sizing of a feature. A large number of points, 5×14 on the long faces and 3×14 on the short faces, respectively, were measured to determine the flatness error and to monitor the surface profile at different cross-sections. Additional measurements were taken at three different heights to determine the perpendicularity error of each corner angle. A positive perpendicularity error indicates that the corner angle is larger than 90o.
Table 1. Input variables
Level 0 Level 1 Level 2
Discharge current amp A 16.00 20.00 24.00 Pulse duration msec B 3.00 6.00 9.00 Pulse gap frequency kHz C 40.00 50.00 60.00
Wire speed m/min D 7.00 8.00 9.00
Wire tension g E 1000 1150 1300
Dielectric flow rate MPa F 0.14 0.20 0.26
Input parameters Unit Symbol Levels
IV. RESULTS AND ANALYSIS
An enormous amount of data was obtained and subsequently analyzed. Due to space constraints, only a few are illustrated, although in the analysis of the work, all these relationships were considered at different stages. In the traditional analysis, the mean values of the measured variables were used. For the Taguchi method, the
signal-to-noise ratio was calculated using the following formula [10]:
A. Linear Dimensional Errors
The results of the linear dimensional errors are shown in Table 2. It is noted that in all cases, the measured mean linear dimension size is less than the designed size. This indicates that the test parts have been overcut. Overcutting is a common problem in WEDM [13]. The main reason behind this is that during WEDM operation, the size of the cavity created in the workpiece is larger than the wire diameter. The exact size of the overcut is difficult to predict, but it is known to be proportional to the discharge current [13]. This explains the higher contributing effect of the discharge current (A) on the linear dimensional errors shown in the Pareto ANOVA analysis (Table 3). While most of the modern WEDMs are equipped with inbuilt overcut error compensation means, it appears that those measures were not enough to overcome this problem.
Table 2. Linear dimensional error results
Length Width Length Width
Design size mm 20 10 200 75
Measured mean size mm 19.787 9.902 199.966 74.963 Linear dimensional error m -203 -98 -34 -37 Range of measurement m 97 193 36 35 6 x Standard deviation m 146 136 51 53 Calculated IT grade 11.352 11.713 7.277 8.146
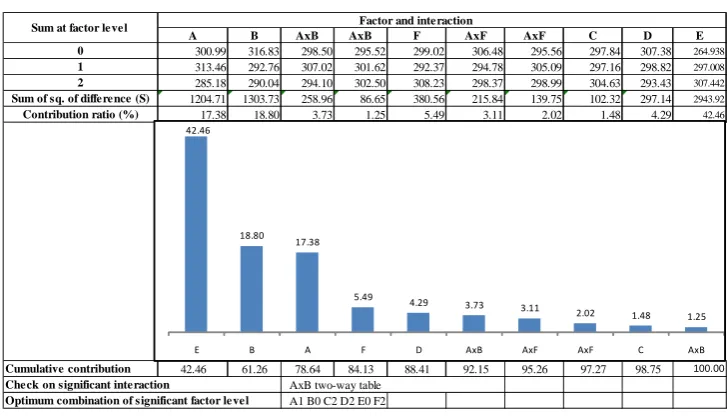
Table 3.
Pareto ANOVA analysis for dimensional error
A B AxB AxB F AxF AxF C D E
300.99 316.83 298.50 295.52 299.02 306.48 295.56 297.84 307.38 264.938
313.46 292.76 307.02 301.62 292.37 294.78 305.09 297.16 298.82 297.008
285.18 290.04 294.10 302.50 308.23 298.37 298.99 304.63 293.43 307.442
1204.71 1303.73 258.96 86.65 380.56 215.84 139.75 102.32 297.14 2943.92
17.38 18.80 3.73 1.25 5.49 3.11 2.02 1.48 4.29 42.46
42.46 61.26 78.64 84.13 88.41 92.15 95.26 97.27 98.75 100.00
Check on significant interaction AxB two-way table
Optimum combination of significant factor level A1 B0 C2 D2 E0 F2
Contribution ratio (%)
Cumulative contribution
Sum at factor le ve l Factor and interaction 0
1 2 Sum of sq. of difference (S)
42.46
18.80 17.38
5.49 4.29
3.73 3.11 2.02
1.48 1.25
E B A F D AxB AxF AxF C AxB
The International Tolerance (IT) grade is often used as a measure to represent the precision of a machining process, where the higher is the IT grade number and the lower is the precision of a process. The following formula has been utilized by several authors [14–16] to estimate the process capability tolerance achievable through various manufacturing processes:
516
3 0.001 10
45 . 0
X X IT
PC (1)
where PC is the process capability tolerance (mm), X is the manufactured dimension (mm), and IT is the International Tolerance grade number.
The expected IT grades for WEDM and end milling are calculated applying Eq. (1), where six times standard division values shown in Table 2 represent the process capability tolerances. The calculated values demonstrate that in terms of linear dimensional accuracy, the WEDM performed poorly and its precision level is far less than CNC end milling.
The Pareto ANOVA analysis for linear dimensional errors given in Table 3 illustrates that wire tension (E) has the most significant effect on linear dimensional errors (P = 42.46%). The wire tension influences dimensional errors by a phenomenon known as wire lag, caused by the static deflection of the wire electrode. The effect of the wire lag on surface errors is discussed in the following subsection. The two other major contributing factors to linear dimensional errors are: pulse duration (B) (P = 18.80%) and discharge rate (A) (P = 17.38%). It is worth pointing out that the total of all of the individual effects (P 90%) is much higher than the total of all the interaction effects (P 10%). Therefore, it will be relatively easy to control the linear dimensional error through proper selection of the independent input parameters.
The response graphs for the dimensional errors are shown in Figure 2a. Based on the S/N ratio and Pareto ANOVA analysis, it was found that the combination for achieving a low linear dimensional error value was A1B0C2D2E0F2; that
is, a medium discharge current, low pulse rate, high pulse gap
frequency, high wire speed, low wire tension, and high dielectric flow rate.
B. Flatness Errors
For prismatic components, a flatness error is another important quality characteristic, which is geometric in nature. It is particularly important for parts where mating takes place across a surface area in an air-tight or liquid-tight manner. The flatness tolerances are also applied on all principle datum surfaces to ensure the integrity of measurement.
Flatness is the condition of a surface having all elements in one plane [17]. A flatness error specifies a zone defined by two parallel planes between which the entire surface must lie. The flatness error results given in Table 4 illustrate that the surfaces produced by WEDM have flatness errors about ten times higher compared to surfaces produced by CNC end milling.
Table 4. Flatness error results
Input parameters Unit WEDM End Milling [9]
Feature size (LxH) mm 20x15 200x12
Measured mean flatness error mm 48 17
Range of measurement mm 189 19
6 x Standard deviation mm 271 28
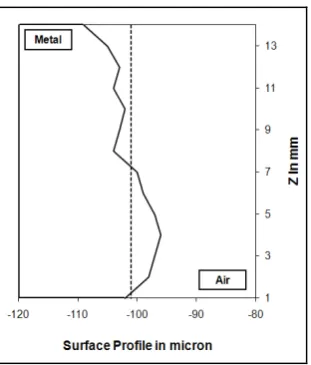
It is worth noting that the flatness data does not give any indication of the shape of the cross-sectional profile. Therefore, in this study, in addition to flatness data, the cross-sectional profile of the test parts are monitored, which may help in understanding the flatness error-forming mechanics. A typical surface profile created by WEDM is depicted in Figure 1, where z = 0 represents the bottom of the cut. Similar drum-shaped surface profiles have been observed in [8], which are believed to be caused by wire bending and vibration.
corners and the drum-shaped surfaces produced resulted in high flatness errors for the surfaces produced by WEDM.
Figure 1. A typical surface profile created by WEDM
The Pareto ANOVA analysis shown in Table 5 illustrates that the most significant impendent parameter affecting the flatness error was the discharge current (A) (P = 30.23%), followed by wire tension (E) (P = 15.70%) and pulse duration (B) (P = 11.02%). The total of all interaction effects on flatness errors is relatively higher (P 24.7%) compared to the total of all interaction effects on dimensional errors (P 10%). Therefore, it will be more difficult to control flatness errors through the individual selection of input parameters. The response graphs for flatness errors are shown in Figure 2b. Based on the S/N ratio and Pareto ANOVA analysis, it was found that the combination for achieving a low linear dimensional error value was A0B2C0D0E2F1; that is, a low
discharge current, high pulse rate, low pulse gap frequency, low wire speed, high wire tension, and medium dielectric flow rate.
C. Perpendicularity Errors
The perpendicularity of the surfaces at each corner of the
perpendicularity error of the surfaces is another important dimensional accuracy characteristic, which is also geometric in nature.
[image:4.595.97.253.94.277.2]The perpendicularity error results given in Table 6 illustrate that the surfaces produced by WEDM have about five times higher perpendicularity errors compared to surfaces produced by CNC end milling. The wire lag phenomenon is believed to be responsible for increasing the perpendicularity error of all corners.
Table 6. Perpendicularity error results
Input parameters Unit WEDM End Milling [9]
Feature size (LxWxH) mm 20x10x15 200x45x12
Measured mean perpendicularity error deg -0.524 0.072
Range of measurement deg 2.766 0.527
6 x Standard deviation deg 4.317 1.089
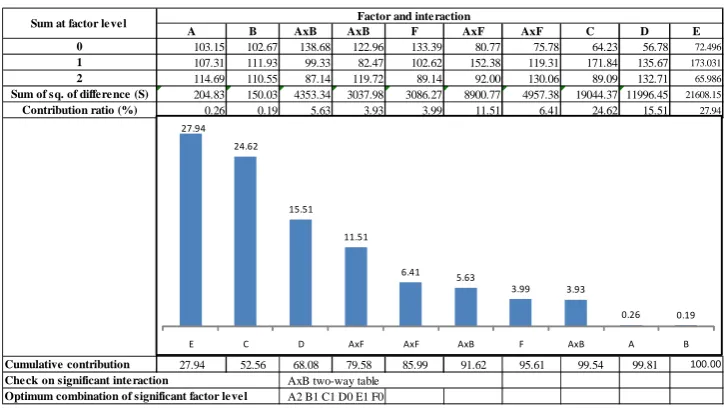
The Pareto ANOVA analysis shown in Table 7 illustrates that the most significant impendent parameter affecting the flatness error was wire tension (E) (P = 27.94%), followed by pulse gap frequency (C) (P = 24.62%) and wire speed (D) (P = 15.51%). The total of all interaction effects on flatness errors is relatively higher (P 27.5%) compared to that of dimensional errors (P 10%). Therefore, it will be more difficult to control flatness errors through the individual selection of input parameters.
The response graphs for perpendicularity errors are shown in Figure 2c. Based on the S/N ratio and Pareto ANOVA analysis, it was found that the combination for achieving a low linear dimensional error value was A2B1C1D0E1F0; that
is, a high discharge current, medium pulse rate, medium pulse gap frequency, low wire speed, medium wire tension, and low dielectric flow rate.
A summary of the optimum levels for the WEDM input parameters is given in Table 8. It is clear from the information shown in Table 8 that different input parameters are required to be kept at different levels in order to optimize each dimensional accuracy characteristic. This emphasizes the problem of optimizing all three dimensional accuracy characteristics all at once.
.
Table 5. Pareto ANOVA analysis for flatness error
A B AxB AxB F AxF AxF C D E
-264.80 -292.62 -285.41 -291.40 -295.97 -299.25 -274.28 -278.68 -293.02 -260.311
-304.02 -298.00 -280.99 -285.56 -278.09 -285.10 -299.41 -285.80 -292.02 -288.134
-295.97 -274.16 -298.38 -287.83 -290.72 -280.44 -291.09 -300.31 -279.74 -283.603
2574.54 938.00 490.29 51.98 507.09 575.88 982.81 729.44 328.07 1337.15
30.23 11.02 5.76 0.61 5.96 6.76 11.54 8.57 3.85 15.70
30.23 45.94 57.48 68.49 77.06 83.82 89.78 95.54 99.39 100.00
Check on significant inte raction Contribution ratio (%)
Cumulative contribution
Sum at factor le ve l Factor and inte raction 0
1 2
Sum of sq. of difference (S)
AxB two-way table Optimum combination of significant factor level A0 B2 C0 D0 E2 F1
30.23
15.70
11.54 11.02 8.57
6.76 5.96
5.76 3.85
0.61
30.00 31.00 32.00 33.00 34.00 35.00 36.00
A0 A1 A2 B0 B1 B2 C0 C1 C2 D0 D1 D2 E0 E1 E2 F0 F1 F2
Mea
n S/
N r
at
io
(d
B
)
Machining parameter level
(a) Linear Dimensional Error
-36.00 -35.00 -34.00 -33.00 -32.00 -31.00 -30.00 -29.00 -28.00
A0 A1 A2 B0 B1 B2 C0 C1 C2 D0 D1 D2 E0 E1 E2 F0 F1 F2
Mea
n S/
N r
at
io
(d
B
)
Machining parameter level
(b) Flatness Error
6.00 8.00 10.00 12.00 14.00 16.00 18.00 20.00
A0 A1 A2 B0 B1 B2 C0 C1 C2 D0 D1 D2 E0 E1 E2 F0 F1 F2
Mea
n S/
N r
at
io
(d
B
)
Machining parameter level
[image:5.595.115.484.102.249.2](c) Perpendicularity Error
Fig. 2. Response graphs for WEDM
A B AxB AxB F AxF AxF C D E
103.15 102.67 138.68 122.96 133.39 80.77 75.78 64.23 56.78 72.496
107.31 111.93 99.33 82.47 102.62 152.38 119.31 171.84 135.67 173.031
114.69 110.55 87.14 119.72 89.14 92.00 130.06 89.09 132.71 65.986
204.83 150.03 4353.34 3037.98 3086.27 8900.77 4957.38 19044.37 11996.45 21608.15
0.26 0.19 5.63 3.93 3.99 11.51 6.41 24.62 15.51 27.94
27.94 52.56 68.08 79.58 85.99 91.62 95.61 99.54 99.81 100.00
Che ck on significant inte raction AxB two-way table
Optimum combination of significant factor le ve l A2 B1 C1 D0 E1 F0
Contribution ratio (%)
Cumulative contribution
Sum at factor le ve l Factor and inte raction 0
1 2 Sum of sq. of differe nce (S)
27.94 24.62
15.51
11.51
6.41 5.63
3.99 3.93
0.26 0.19
E C D AxF AxF AxB F AxB A B
Table 8. Summary of optimum levels for input parameters
A B C D E F
Linear dimensional error 1 0 2 2 0 2
Flatness error 0 2 0 0 2 1
Perpendicularity error 2 1 1 0 1 0
Dimensional Accuracy Characteristics
Optimum Levels
V.CONCLUDING REMARKS
From the experimental work conducted and the subsequent analysis, the following conclusions can be drawn:
The dimensional accuracy achievable in wire-cut electrical discharge machining is not as high as anticipated and its precision level is far less than CNC end milling.
Of the six input parameters considered, wire tension showed the greatest overall affect on three dimensional accuracy characteristics, therefore, its value should be chosen carefully.
The problem of erosion of the corner shapes caused by the wire lag phenomenon remains; consequently requires more research and their practical applications.
Different input parameters are required to be kept at different levels for optimizing each dimensional accuracy characteristic, which highlights the problem of simultaneously optimizing a number of dimensional accuracy characteristics. A hybrid model can be developed to tackle this problem.
REFERENCES
[1] Black, J. T. and Koher, R. A., Materials and Processes in Manufacturing, 10th Ed., John Wiley and Sons, Inc., Hoboken, NJ,
2008.
[2] Hocheng, H., Lei, W.T., and Hsu, H.S., “Preliminary Study of Material Removal in Electrical Discharge Machining of SiC/Al,” J. Materials Processing Technology, Vol. 63, pp. 813-818, 1997. [3] Lee, S.H., and Li, X., “Study of the Effect of Machining Parameters on
the Machining Characteristics in electrical Discharge Machining of Tungsten Carbide,” J. Materials Processing Technology, Vol. 115, pp. 334-358, 2001.
[4] Yan M. and Lai Y., “Surface Quality Improvement of Wire-EDM using a Fine-finish Power Supply”, Int. J. Mach. Tools & Manuf., Vol. 47, pp.1686-1694, 2007.
[5] Williams, R.E., Rajurkar, K.P., “Study of Wire Electrical Discharge Machining Surface Characteristics,” J. Materials Processing Technology, vol. 28, pp. 486-493, 1991.
[6] Tasi, K., Wang, P., “Comparison of Neural Network Models on Material Removal Rate in Electrical Discharge Machining,” J. Materials Processing Technology, Vol. 117, pp. 111-124, 2001. [7] Dauw, D.F. and Beltrami, E. T. H. I., “High-Precision Wire-EDM by
Online Positioning Control”, Annals of the CIRP, 43/1/1994, PP. 193-197.
[8] Yan M. and Huang P., “Accuracy Improvement of Wire-EDM by Real-time Wire Tension Control”, Int. J. Mach. Tools & Manuf., Vol. 44, pp.807-814, 2004.
[9] Han, F., Zhang, J. and Soichiro, I., “Corner Error Simulation of Rough Cutting in Wire EDM”, Precision Engineering, Vol. 31, pp. 331-336, 2007.
[10] Ross, P. J., Taguchi Techniques for Quality Engineering, McGraw-Hill, New York, 1988.
[11] Park, S. H., Robust Design and Analysis for Quality Engineering, Chapman & Hall, London, 1996.
[12] Islam, M. N., “A CMM-Based Geometric Accuracy Study of CNC End Milling Operations”, Proc. of 6th Int. Conf. on Manufacturing Engineering, Melbourne, 29 Nov.–1 Dec. 1995, pp. 835-841. [13] Groover, M.P., Fundamentals of Modern Manufacturing: Materials,
Processes, and Systems, 4th Ed., John and Wiley and Sons, Inc.,
Danvers, MA, 2010.
[14] Gladman, C.A., Geometric Analysis of Engineering Designs, 2nd Ed.,
Australian Trad Publ. Pty. Ltd., Sydney, 1972.
[15] Bjørke, Ø, Computer-Aided Tolerancing, 2nd Ed., ASME Press, New York, 1989.
[16] Farmer, L.E, Dimensioning and Tolerancing for Function and Economic Manufacture, Blueprint Publ., Sydney, 1999.
[image:6.595.116.480.76.280.2]