Proceedings of the 2019 Conference on Empirical Methods in Natural Language Processing 1216
The Feasibility of Embedding Based Automatic Evaluation for Single
Document Summarization
Simeng Sun
University of Pennsylvania [email protected]
Ani Nenkova University of Pennsylvania [email protected]
Abstract
ROUGE is widely used to automatically evaluate summarization systems. However, ROUGE measures semantic overlap between a system summary and a human reference on word-string level, much at odds with the contemporary treatment of semantic meaning. Here we present a suite of experiments on us-ing distributed representations for evaluatus-ing summarizers, both in reference-based and in reference-free setting. Our experimental re-sults show that the max value over each dimen-sion of the summary ELMo word embeddings is a good representation that results in high correlation with human ratings. Averaging the cosine similarity of all encoders we tested yields high correlation with manual scores in reference-free setting. The distributed repre-sentations outperform ROUGE in recent cor-pora for abstractive news summarization but are less good on older test data and systems.
1 Introduction
The widely used ROUGE (Lin, 2004) automatic
evaluation for summarization relies on token over-lap between reference and system summary. This limited view of meaning has motivated
numer-ous studies on summarization evaluation (Zhou
et al., 2006;Ganesan,2018;ShafieiBavani et al.,
2018), and the related areas of translation and
dia-log, to explore more compelling semantic
match-ing (Kauchak and Barzilay, 2006; Lavie and
Denkowski, 2009; Lo and Wu, 2011; Chen and Guo, 2015; Liu et al., 2016; Tao et al., 2018). Most recently, incorporating word embeddings
in ROUGE pairwise comparison of n-grams has
proven beneficial (Ng and Abrecht,2015), as well
as representing sentences using universal sentence representation to predict the quality of translation (Shimanaka et al.,2018).
We build upon this line of work and show that cosine similarity between the reference and
summary embedding works well, and better than ROUGE on recent datasets, for comparing
sin-gle document summarization systems. Unlike
prior work (Ng and Abrecht,2015), we thoroughly
abandon ROUGE and n-gram co-occurrences in
the computation of semantic similarity. To give a sense of the generalizability of our findings, we validate the method on three different test sets with human evaluation. We compare several pop-ular representation including sentence embedding, un-contextualized word embedding and
contex-tualized word embedding. Finally, we present
experiments on evaluating single document sum-maries without reference sumsum-maries which was originally proposed for multi-document
summa-rization (Louis and Nenkova,2013) and explored a
variety of word-string similarity techniques. Here we study reference-free evaluations via embed-ding similarity between the full document to be summarized and the system summaries.
2 Embeddings
To get a dense low-dimenional representation of texts, we test seven representations covering sen-tence embedding, variants of un-contextualized word embedding and variants of contextualized
word embedding. Specifically: (i) Two Google
universal sentence encoders: (Cer et al., 2018),
an encoder (enc-2) based on deep averaging net
(Iyyer et al.,2015) and an encoder (enc-3) based
on transformer (Vaswani et al., 2017). Both
en-coders encode input text to512-dimensional
vec-tor. (ii) Average (ELMo-a) and max (ELMo-m)
over each dimension of all ELMo (Peters et al.,
2018) word embeddings of an input text. For
each token in the input, three layers of 1,024-dimensional vectors were concatenated to form a
3,072-dimensional vector. (iii)Average (avg) and
DUC2001 DUC2002 DUC2001 DUC2002
ROUGE P S P S Encoder P(ref / doc) S(ref / doc) P(ref / doc) S(ref / doc)
R1-R 0.683∗ 0.650∗ 0.809∗ 0.783∗ enc-2 0.661∗/ 0.676∗ 0.538 / 0.580∗ 0.837∗/ 0.734∗ 0.867∗/ 0.566
R1-P 0.315 0.441 0.314 0.287 enc-3 0.505 / 0.628∗ 0.378 / 0.580∗ 0.856∗/ 0.724∗ 0.790∗/ 0.566
R1-F 0.835∗ 0.825∗ 0.870∗ 0.818∗ max 0.625∗/ 0.106 0.685∗/ 0.035 0.890∗/ 0.475 0.692∗/ 0.462
R2-R 0.810∗ 0.811∗ 0.954∗ 0.944∗ avg 0.473 / 0.184 0.476 / 0.063 0.876∗/ 0.446 0.748∗/ 0.420
R2-P 0.538 0.594 0.644∗ 0.622∗ InferSent 0.445 / 0.130 0.483 / 0.063 0.878∗/ 0.486 0.762∗/ 0.503
R2-F 0.773∗ 0.720∗ 0.879∗ 0.881∗ ELMo-m 0.652∗/0.739∗ 0.664∗/0.776∗ 0.881∗/ 0.693∗ 0.790∗/0.692∗
- - - ELMo-a 0.743∗/ 0.652∗ 0.573 / 0.692∗ 0.710∗/ 0.678∗ 0.643∗/ 0.650∗
[image:2.595.77.522.62.162.2]- - - enc-avg 0.659∗/ 0.725∗ 0.587∗/ 0.622∗ 0.888∗/0.763∗ 0.748∗/ 0.685∗
Table 1: Correlation results on DUC2001/2002. P is shorthand for Pearson correlation, S for Spearman correlation. Detailed description of encoders can be found in§2. (ref / doc) shows the correlation between summary embedding with either reference embedding or document embedding. Entries withp-value lower than 0.05 are marked with∗. ROUGE F1 scores, the commonly reported metric, are underlined for better comparison.
(iv) InferSent (Conneau et al., 2017) (InferSent),
a BiLSTM encoder producing representation of 4,096 dimensions. We compute cosine similar-ity between summary and reference embedding to capture semantic similarity. To test the robust-ness of this evaluation approach, we check correla-tions on old single document summarization eval-uations of somewhat obsolete systems and modern corpora for summarization with a mix of extractive and neural abstractive systems.
3 Evaluation on DUC2001/2002
Document Understanding Conferences (DUC) 2001/2002 provide benchmark datasets along with human evaluation over multiple submitted
sys-tems. Human evaluation (coverage score)
re-flects the degree to which semantic units, roughly clauses, in the reference summary are expressed in
the system summary (Lin and Hovy,2003).
To evaluate the newly proposed automatic eval-uations, we follow the conventional methodology of computing correlation between the automatic metric and human evaluations of summary
con-tent. The results are shown in Table 11. R1-F
correlates better with human ratings on DUC’01, while R2-R works extremely well on DUC’02. Both uni- and bi-gram ROUGE F-measure also correlate well with human evaluation, which is an important finding given that ROUGE-F has be-come the de facto standard for evaluation of neural
summarization systems (Nallapati et al.,2016;See
et al.,2017;Gehrmann et al.,2018;Zhang et al.,
2018;Celikyilmaz et al.,2018).
1
There are total 14 systems in DUC’02. We discard two poorly performing systems, 17 and 30. Including them in the analysis results in high correlation (>0.9) for both ROUGE and embedding similarity but the results we present are more convincing without the presence of clearly inferior systems.
We find that there is no single optimal represen-tation that gives the best correlation on both data sets. There is a clear increase of performance from DUC’01 to DUC’02. In DUC’02, embedding sim-ilarity can achieve the same level or even higher correlation with human evaluation than ROUGE F-measure, but it performs worse on DUC’01.
The correlations usingavg,max andInferSent in
reference-free setting on DUC’01 are lower.
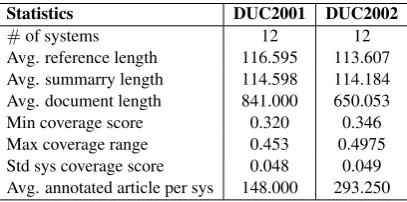
Statistics DUC2001 DUC2002
#of systems 12 12
Avg. reference length 116.595 113.607 Avg. summarry length 114.598 114.184 Avg. document length 841.000 650.053 Min coverage score 0.320 0.346 Max coverage range 0.453 0.4975 Std sys coverage score 0.048 0.049 Avg. annotated article per sys 148.000 293.250
Table 2: DUC2001 and DUC2002 dataset statistics
To understand what causes the low perfor-mance on DUC’01, we examined statistics for
both datasets, shown in Table 2. Systems in
DUC’01 are, on average, inferior to DUC’02 sys-tems (lines 5 and 6) and syssys-tems in DUC’01 are more similar to each other than in DUC’02 (line 7), which leaves less room to rank the systems and thus achieve high correlation. Another difference between DUC’01 and DUC’02 is that the number of evaluated articles for each system is consider-ably larger than that in DUC’01. One might ask if enough articles are provided for each system on
DUC’01 data. We show in Figure1that 140 is a
[image:2.595.315.519.373.474.2]20 40 60 80 100 120 140
DUC2001: Number of articles per system
0.2 0.0 0.2 0.4 0.6 0.8
Correlation with human coverage score
Embedding similarity with reference
R1-F enc-2 enc-3 elmo-max elmo-avg max avg infs
20 40 60 80 100 120 140
DUC2001: Number of articles per system
0.2 0.0 0.2 0.4 0.6 0.8
Embedding similarity with full document
R1-F enc-2 enc-3
elmo-max elmo-avg max
avg infs
0 50 100 150 200 250
DUC2002: Number of articles per system
0.2 0.3 0.4 0.5 0.6 0.7 0.8 0.9
Embedding similarity with reference
R1-F enc-2 enc-3 elmo-max elmo-avg max avg infs
0 50 100 150 200 250
DUC2002: Number of articles per system
0.2 0.0 0.2 0.4 0.6 0.8
Embedding similarity with full document
[image:3.595.76.523.66.151.2]R1-F enc-2 enc-3 elmo-max elmo-avg max avg infs
Figure 1: For each number of articles, we sample and compute the correlation for 50 times and plot the average as well as standard deviation. The decreasing size of error bar shows that enough articles are provided for each system and it is not the reason of the performance discrepancy between DUC2001 and DUC2002.
3. As we can see, similarity of all kinds of
embed-dings indeed correlate with coverage score, how-ever they also generate more extreme values when pairs of systems are examined. For example, two systems may be close in terms of R1-F, but can be relatively distant when comparing the embed-ding similarities. This problem, possibly due to different architectures and different data each en-coder is trained on, may be alleviated by averaging the cosine similarities computed from all the rep-resentations. Overall, given the stable results on DUC’02, embedding similarity is a good metric which does not depend on lexical overlap and can be computed quickly immediately after inference without the need of running ROUGE.
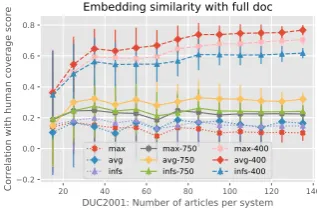
20 40 60 80 100 120 140 DUC2001: Number of articles per system 0.2
0.0 0.2 0.4 0.6 0.8
Correlation with human coverage score
Embedding similarity with full doc
max avg infs
max-750 avg-750 infs-750
[image:3.595.100.259.436.540.2]max-400 avg-400 infs-400
Figure 2: Truncated articles lead to performance im-provement formax,avgandInferSentrepresentation.
DUC’01 — where reference-free results are weaker — contains longer articles. To check if representations are sensitive to input length, we truncated the articles to the first 400 or 750 tokens when the length exceeds that limit. We plot the correlations in this setting for the three encoders
which have worse results on DUC’01. Figure 2
shows a clear and consistent improvement of cor-relation when the document size is smaller. In fact, when only the lead 400 tokens are included, the average word embedding is only slightly worse than R1-F. This finding suggests that the embed-ding of the document lead sentences serves as a
better reference than the full document and that the three representations are sensitive to input length.
Another noticeable difference between DUC’01
and DUC’02 is the performance ofELMo-aword
embeddings. Both ELMo embedding variants
are capable of dealing with long texts. For the
four settings we tested,ELMo-mhas better
Spear-man correlation than averaging ELMo
embed-dings. On DUC’02, ELMo-aleads to lower
cor-relations than other encoders. Unlikemaxandavg
where word embeddings are fixed, contextualized word embeddings are more flexible, thus the av-erage ELMo embeddings for reference and sum-mary can be far away from each other, in this case
ELMo-m reflects more salient information about
the input thanELMo-a.
ROUGE CN IN RL SR UC VE
R1-R 0.086 0.943 0.486 0.943 0.314 0.371 R1-P 0.257 0.257 0.714 0.600 0.714 0.829 R1-F 0.257 0.543 0.886 0.829 0.657 0.829 R2-R -0.086 0.771 0.429 0.943 0.429 0.486 R2-P 0.086 0.371 0.486 0.657 0.600 0.657 R2-F 0.717 0.131 0.179 0.097 0.368 0.628
Enc-ref CN IN RL SR UC VE
enc-2 0.200 0.714 0.771 0.943 0.600 0.714 enc-3 0.200 0.714 0.771 0.943 0.600 0.714 max 0.257 0.829 0.714 0.886 0.429 0.543 avg 0.086 0.943 0.486 0.943 0.314 0.371 InferSent 0.086 0.943 0.486 0.943 0.314 0.371 ELMo-m 0.029 1.000 0.314 0.829 0.086 0.143 ELMo-a 0.086 0.943 0.486 0.943 0.314 0.371 enc-avg 0.200 0.714 0.771 0.943 0.600 0.714
Enc-doc CN IN RL SR UC VE
enc-2 -0.086 0.943 0.200 0.771 0.029 0.086 enc-3 -0.086 0.943 0.200 0.771 0.029 0.086 max 0.143 0.943 0.371 0.657 -0.029 0.086 avg 0.314 0.829 0.257 0.429 -0.086 -0.029 InferSent 0.143 0.943 0.371 0.657 -0.029 0.086 ELMo-m 0.143 0.943 0.371 0.657 -0.029 0.086 ELMo-a 0.143 0.943 0.371 0.657 -0.029 0.086 enc-avg 0.029 1.000 0.314 0.829 0.086 0.143
[image:3.595.309.523.453.707.2]0.40 0.42 0.44 0.46 R1-F 0.300 0.325 0.350 0.375 0.400 0.425 0.450 0.475
Human coverage score
b o p q r s t v w x y z b o p q r s t v w x y z
0.77 0.78 0.79 0.80 0.81 0.82 0.83 enc-2 0.300 0.325 0.350 0.375 0.400 0.425 0.450 0.475 b o p q r s t v w x y z
0.82 0.83 0.84 0.85 0.86 0.87 0.88 enc-3 0.300 0.325 0.350 0.375 0.400 0.425 0.450 0.475 b o p q r s t v w x y z
0.880 0.885 0.890 0.895 0.900 0.905 0.910 avg-encoders 0.300 0.325 0.350 0.375 0.400 0.425 0.450 0.475 b o p q r s t v w x y z
0.960 0.962 0.964 0.966 max 0.300 0.325 0.350 0.375 0.400 0.425 0.450 0.475
Human coverage score
bo p q r s t v w x y z
0.89 0.90 0.91 0.92 avg 0.300 0.325 0.350 0.375 0.400 0.425 0.450 0.475 b o p q r s t vw x y z
0.958 0.960 0.962 0.964 0.966 elmo-max 0.300 0.325 0.350 0.375 0.400 0.425 0.450 0.475 b o p q r s t v w x y z
0.83 0.84 0.85 0.86 0.87 elmo-avg 0.300 0.325 0.350 0.375 0.400 0.425 0.450 0.475 b o p q r s t v w x y z
Figure 3: This scatter plot shows the human coverage score and embedding similarity on DUC2001. The baseline system is shortened to ‘b’.
4 Evaluation on Newsroom 60
In this section, we use contemporary data and systems and explore other factors that embedding similarity could potentially capture. We employ the human evaluation set from newsroom data
in-troduced in (Grusky et al., 2018). The
evalua-tion data includes 7 systems, each producing sum-maries for 60 articles. The 7 systems are: (1) lead3 sentences of the article (2) textrank with word limit of 50 (3) extractive oracle ‘fragments’ sys-tem, representing the best possible performance of
an extractive system (4) abstractive model (Rush
et al., 2015) trained on Newsroom training data
(5) Pointer-Generator (See et al.,2017) trained on
CNN/DailyMail data set (Nallapati et al., 2016),
on complete and a subset of Newsroom training set respectively.
We collected crowdsourced evaluations of
rele-vance(RL)and informativeness(IN)as introduced
in the original paper, closely reproducing the ear-lier findings. We introduce four more dimensions:
verbosity(VE), unnecessary content(UC), perfect
surrogate(SR)and continue reading(CN). Higher
rating corresponds to assessment that the summary is not unnecessarily verbose, it has no unnecessary content, it is a good surrogate for the input and that much additional information can be obtained from the article after reading the summary. The exact questions are presented in the supplementary ma-terial. We asked workers to rate in the range of 1 to 7 instead of 1 to 5 in the original paper. We excluded from the analysis the ‘fragments’ ora-cle system which maximizes ROUGE by
select-ing word n-grams but receives very low human
ratings because the resulting summary is
incom-prehensible. Each summary is scored by three
crowdworkers whose scores we average. Table3
shows Spearman correlations and Pearson correla-tions are in the Appendix.
Eval by rank P(ref) S(ref) P(doc) S(doc) enc-2 6.667 5.000 5.667 4.667 enc-3 8.000 6.667 6.333 4.667 max 4.333 5.667 7.333 7.000 avg 5.667 6.000 8.333 8.667 InferSent 6.333 5.333 7.000 6.000 ELMo-m 4.000 3.000 3.667 2.333
[image:4.595.74.528.66.241.2]ELMo-a 4.667 6.000 6.000 3.667 enc-avg 4.333 6.000 2.667 3.333 R1-F 5.667 4.667 3.667 4.000 R2-F 5.333 4.000 4.667 4.667
Table 4: Average correlation rank of each system on DUC2001, DUC2002 and Newsroom 60 data. P is shorthand for Pearson correlation and S for Spearman.
The table shows that embedding similarity cor-relates better or the same as ROUGE with human ratings on informativeness, relevance and surro-gate. However, ROUGE precision is a more suit-able metric for evaluating the extent of unneces-sary content and verbosity. This implies that the examined representations capture well the mean-ing of the input but store repetitive information
without enough penalty. For the dimension CN,
showing that the input contains considerably more important details than in the summary, neither em-bedding similarity nor ROUGE is good enough to
show a correlation with smallp-value.
best with human ratings, we sort the representa-tions by correlarepresenta-tions in descending order on the three data sets we examined and compute the av-erage rank for each. We used informativeness
rat-ings on Newsroom data. Smaller value means
overall better performance on all three data sets.
The results are shown in Table4. The max value
over each dimension of ELMo word embedding of input text performs the best when reference sum-maries are given. When we compare the embed-ding between system summary and document, the averaged cosine similarities of all seven represen-tation also gives good results. Most importantly, the ELMo-m evaluation ranks consistently better than ROUGE-F for all evaluation settings.
5 Conclusion
In this paper we systematically study embedding cosine similarity as a measure of the quality of
summarizers on three data sets. We verify the
feasibility of the embedding similarity for sys-tem comparison on DUC’01, DUC’02 and News-room human evaluation data. The worse results on DUC’01 can be explained by the fact that systems being evaluated are too similar and not that well-performing. On DUC’02 and Newsroom data, em-bedding similarity can achieve the same level or even higher correlation with human ratings com-pared to ROUGE. Overall, when references are given, max ELMo word embeddings have high-est correlation and the averaged cosine similarities of the examined representations gives high corre-lation in reference-free setting.
References
Asli Celikyilmaz, Antoine Bosselut, Xiaodong He, and Yejin Choi. 2018. Deep communicating agents for abstractive summarization. In Proceedings of the 2018 Conference of the North American Chapter of the Association for Computational Linguistics: Hu-man Language Technologies, Volume 1 (Long Pa-pers), pages 1662–1675. Association for Computa-tional Linguistics.
Daniel Cer, Yinfei Yang, Sheng-yi Kong, Nan Hua, Nicole Limtiaco, Rhomni St. John, Noah Constant, Mario Guajardo-Cespedes, Steve Yuan, Chris Tar, Brian Strope, and Ray Kurzweil. 2018. Universal sentence encoder for english. InProceedings of the 2018 Conference on Empirical Methods in Natu-ral Language Processing: System Demonstrations, pages 169–174. Association for Computational Lin-guistics.
Boxing Chen and Hongyu Guo. 2015. Representation based translation evaluation metrics. InProceedings of the 53rd Annual Meeting of the Association for Computational Linguistics and the 7th International Joint Conference on Natural Language Processing (Volume 2: Short Papers), pages 150–155. Associa-tion for ComputaAssocia-tional Linguistics.
Alexis Conneau, Douwe Kiela, Holger Schwenk, Lo¨ıc Barrault, and Antoine Bordes. 2017. Supervised learning of universal sentence representations from natural language inference data. InProceedings of the 2017 Conference on Empirical Methods in Nat-ural Language Processing, pages 670–680, Copen-hagen, Denmark. Association for Computational Linguistics.
Kavita Ganesan. 2018. Rouge 2.0: Updated and im-proved measures for evaluation of summarization tasks.
Sebastian Gehrmann, Yuntian Deng, and Alexander Rush. 2018. Bottom-up abstractive summarization. In Proceedings of the 2018 Conference on Empiri-cal Methods in Natural Language Processing, pages 4098–4109. Association for Computational Linguis-tics.
Max Grusky, Mor Naaman, and Yoav Artzi. 2018.
Newsroom: A dataset of 1.3 million summaries with diverse extractive strategies. InProceedings of the 2018 Conference of the North American Chapter of the Association for Computational Linguistics: Hu-man Language Technologies, Volume 1 (Long Pa-pers), pages 708–719. Association for Computa-tional Linguistics.
Mohit Iyyer, Varun Manjunatha, Jordan Boyd-Graber, and Hal Daum´e III. 2015. Deep unordered compo-sition rivals syntactic methods for text classification. In Proceedings of the 53rd Annual Meeting of the Association for Computational Linguistics and the 7th International Joint Conference on Natural Lan-guage Processing (Volume 1: Long Papers), pages 1681–1691. Association for Computational Linguis-tics.
David Kauchak and Regina Barzilay. 2006. Para-phrasing for automatic evaluation. InHuman Lan-guage Technology Conference of the North Amer-ican Chapter of the Association of Computational Linguistics, Proceedings, June 4-9, 2006, New York, New York, USA.
Alon Lavie and Michael J. Denkowski. 2009. The meteor metric for automatic evaluation of machine translation.Machine Translation, 23(2-3):105–115.
Chin-Yew Lin. 2004. Rouge: A package for automatic evaluation of summaries. InProc. ACL workshop on Text Summarization Branches Out, page 10.
Human Language Technology Conference of the North American Chapter of the Association for Computational Linguistics.
Chia-Wei Liu, Ryan Lowe, Iulian Serban, Mike Nose-worthy, Laurent Charlin, and Joelle Pineau. 2016.
How not to evaluate your dialogue system: An em-pirical study of unsupervised evaluation metrics for dialogue response generation. InProceedings of the 2016 Conference on Empirical Methods in Natural Language Processing, pages 2122–2132. Associa-tion for ComputaAssocia-tional Linguistics.
Chi-kiu Lo and Dekai Wu. 2011. MEANT: an inexpen-sive, high-accuracy, semi-automatic metric for eval-uating translation utility based on semantic roles. In The 49th Annual Meeting of the Association for Computational Linguistics: Human Language Technologies, Proceedings of the Conference, 19-24 June, 2011, Portland, Oregon, USA, pages 220–229.
Annie Louis and Ani Nenkova. 2013. Automatically assessing machine summary content without a gold standard. Computational Linguistics, 39(2):267– 300.
Ramesh Nallapati, Bowen Zhou, Cicero dos Santos, Caglar Gulcehre, and Bing Xiang. 2016. Ab-stractive text summarization using sequence-to-sequence rnns and beyond. InProceedings of The 20th SIGNLL Conference on Computational Natural Language Learning, pages 280–290. Association for Computational Linguistics.
Jun-Ping Ng and Viktoria Abrecht. 2015. Better sum-marization evaluation with word embeddings for rouge. In Proceedings of the 2015 Conference on Empirical Methods in Natural Language Process-ing, pages 1925–1930. Association for Computa-tional Linguistics.
Matthew Peters, Mark Neumann, Mohit Iyyer, Matt Gardner, Christopher Clark, Kenton Lee, and Luke Zettlemoyer. 2018. Deep contextualized word repre-sentations. InProceedings of the 2018 Conference of the North American Chapter of the Association for Computational Linguistics: Human Language Technologies, Volume 1 (Long Papers), pages 2227– 2237. Association for Computational Linguistics.
Alexander M. Rush, Sumit Chopra, and Jason Weston. 2015. A neural attention model for abstractive sen-tence summarization. In Proceedings of the 2015 Conference on Empirical Methods in Natural Lan-guage Processing, pages 379–389. Association for Computational Linguistics.
Abigail See, Peter J. Liu, and Christopher D. Manning. 2017.Get to the point: Summarization with pointer-generator networks. InProceedings of the 55th An-nual Meeting of the Association for Computational Linguistics (Volume 1: Long Papers), pages 1073– 1083. Association for Computational Linguistics.
Elaheh ShafieiBavani, Mohammad Ebrahimi, Ray-mond Wong, and Fang Chen. 2018. A graph-theoretic summary evaluation for ROUGE. In Pro-ceedings of the 2018 Conference on Empirical Meth-ods in Natural Language Processing, pages 762– 767, Brussels, Belgium. Association for Computa-tional Linguistics.
Hiroki Shimanaka, Tomoyuki Kajiwara, and Mamoru Komachi. 2018. Metric for automatic machine translation evaluation based on universal sentence representations. In Proceedings of the 2018 Con-ference of the North American Chapter of the Asso-ciation for Computational Linguistics: Student Re-search Workshop, pages 106–111. Association for Computational Linguistics.
Chongyang Tao, Lili Mou, Dongyan Zhao, and Rui Yan. 2018. Ruber: An unsupervised method for au-tomatic evaluation of open-domain dialog systems. InAAAI.
Ashish Vaswani, Noam Shazeer, Niki Parmar, Jakob Uszkoreit, Llion Jones, Aidan N Gomez, Ł ukasz Kaiser, and Illia Polosukhin. 2017. Attention is all you need. In I. Guyon, U. V. Luxburg, S. Bengio, H. Wallach, R. Fergus, S. Vishwanathan, and R. Gar-nett, editors, Advances in Neural Information Pro-cessing Systems 30, pages 5998–6008. Curran As-sociates, Inc.
Xingxing Zhang, Mirella Lapata, Furu Wei, and Ming Zhou. 2018. Neural latent extractive document sum-marization. InProceedings of the 2018 Conference on Empirical Methods in Natural Language Pro-cessing, pages 779–784. Association for Computa-tional Linguistics.
Liang Zhou, Chin-Yew Lin, Dragos Stefan Munteanu, and Eduard Hovy. 2006. ParaEval: Using para-phrases to evaluate summaries automatically. In