Copyright © 2015 by Iranian Occupational Health Association (IOHA) IJOH 7: 177-186, 2015
ORIGINAL ARTICLE
Safety Attitudes among Nurses and Its Relation with
Occupational Accidents: A Questionnaire Based Survey
SEYED EHSAN SAMAEI
1; MEHDI RAADABADI
2; NARGES KHANJANI
3; OMIDREZA
HERAVIZADEH
4; MAJID BAGHERI HOSSEINABADI
5*; SAEED PIRANI
61
Clinical Research Development Rouhani Hospital Unit, Babol University of Medical Sciences, Babol, Iran;
2
Health Services Management Research Center, Institute for Futures Studies in Health, Kerman University of
Medical Sciences, Kerman, Iran;
3
Department of Epidemiology and Biostatistics, School of Public Health, Kerman University of Medical
Sciences, Kerman, Iran;
4
Department of Occupational Health Engineering, School of Public Health, Tehran University of Medical
Sciences, Tehran, Iran;
5
Department of Occupational Health Engineering, School of Public Health, Kerman University of Medical
Sciences, Kerman, Iran;
6
Department of HSE, School of Environment and Energy, Science and Research Branch of Islamic Azad
University, Tehran, Iran.
Received October 04, 2015; Revised October 18, 2015; Accepted December 17, 2015
This paper is available on-line at http://ijoh.tums.ac.ir
ABSTRACT
Various aspects of work and occupational diversity and the complexity of the nursing profession have a significant impact on the incidence rate of unsafe acts and consequences of accidents. In this regard, safety attitude will have a significant impact on occupational accidents among nursing personnel. The aim of this study was to assess safety attitude among nurses and its relation with occupational accidents among teaching hospitals of Kerman University of Medical Sciences. This cross-sectional study was conducted on 244 nurses in Kerman, Iran in 2015. Tools for gathering data were Demographic and Organizational Questionnaires, Safety Attitudes Questionnaire (SAQ) and Occupational Accidents Questionnaire. Data was analyzed using SPSS 21 statistical software and descriptive statistics and statistical tests including Pearson correlation, independent t-test and ANOVA. The highest and lowest attitude scores were related to teamwork climate scale (58.9) and perception of management (38%). The stress recognition scale had significant correlations with each of the other scales. Reliability of the questionnaire was high, (α=0.872), and scale reliability ranged from α=0.82 to α=0.908 for the six scales. Chemical splash to eyes, in more than 3 times accident frequencies, had the lowest percentage (1.03%), and exposure to blood or other body fluids, had the highest percentage, (37.11%). There was a significant relationship between exposure to blood or other body fluids and traumatic backache while changing patient’s positions with safety attitude (P<0.05). With regard to the relationship between safety attitude and occupational accidents, managers, by increasing their awareness of safety knowledge, improved incentive system, collaborative management, employee safety and dealing with occupational stress and finding the effective causes of patient safety can develop employees' attitude to safety.
KEYWORDS: Accident, Occupational accident, Safety attitude, Nurses
* Corresponding Author: Majid Bagheri Hosseinabadi
Safety Attitudes among Nurses … ijoh.tums.ac.ir | 178 and complexity have a considerable impact on
personal behavior in working environment, and this impact causes the unintended
occurrence of unsafe acts and consequently the incidence of accidents [1-2].
Accident (s) is defined as unplanned and unintentional event sequence (s) which occurs due to unsafe acts, unsafe conditions or both of them, and results in immediate or delayed undesirable effects [3].
Hospital is considered as the main and riskiest health care center in health systems. Also, nurses are exposed to occupational accidents such as sprains, strains and muscle tears resulting from heavy lifting, slips and falls, needle-stick, contact with blood and other body fluids and open wound contamination with patients’ blood, cut from drug ampoules and scalpel cuts as well as other accidents [4-6]. According to the Bureau of Labor Statistics, in the most recent related study [7], accidents which result in nurse injuries in the hospitals have been counted for 5 percent of all work-related injuries. Also, work related accidents among nurses are regarded as an important cause of lost hours of work [8].
Nursing, is a job with several characteristics [9] such as job stress, high workload, work shift, work interruptions, overtime, distractions, role conflict and etc, that are defined as effective risk factors on nurse’s safety and job-related accidents [10]. Nurses are regularly faced to stressful events which are effective on hospital’s safety as well as patients’ safety [11-12]. Having awareness of nursing characteristics can help to prevent medical errors and occupational accidents [13]. High level job characteristics in nursing personnel can force on their workload, job-related mistakes, indecisiveness and unsafe occupational behaviors. Nursing characteristics has a direct relationship with safety issues [9, 14]
One aspect of researches in many industrialized countries in reducing or preventing work-related accidents is to improve training, workplace conditions, quality of work tools and investigate effective causes of accidents in workplace [15-16]. In developed countries, having only an advanced management systems and technology is not enough for improving safe behaviors in workplace. Having a favorable safety and prevent accidents require personal perception and attitude along with organizational attitude towards safety [17-20] .This mutual perception and attitudes forms the organization's safety culture [21] .In recent years, the perception of different factors in health-care organizations, such as: emphasis on service, operational cost control, professional norms of organization and attention to attitudes of health care providers create patient safety culture [22]. This attitude is a major factor to prevent from occupational accidents in nurses [23].
Researches have shown the relationship between workers’ safety attitudes and their safe behavior and also based on safety attitude, occupational accident and injuries can be traced [24-25]. This perception and sense of responsibility in individuals provide the implementation of safety culture in the organization [26].
Measuring personal safety attitude and perceptions by the use of a suitable tool can be considered as a valuable benchmark for evaluating organization’s performance to prevent accidents [21, 27].
Recently, different methods were used to scale the safety attitudes of health care workers. One of them was Safety Attitude Questionnaire which contains 6 dimensions of teamwork climate, safety climate, perceptions of management, job satisfaction, working conditions and stress recognition [28-30]. The mentioned method is able to distinguish the probable weak points in health care services, motivate staff to improve the quality of service and decrease errors and occupational accidents [31]. In this regard, Tylor et al, have found a significant correlation between SAQ dimensions and occupational injuries or accidents in nursing personnel. According to the mentioned study, safety of nurses and patients is in line with safety attitude [32]. On the basis of previous researches, there is a strong correlation between safety culture, quality of finance and safety-related functions [33-35].
Since, in organizations of health care, work-related accident and injury are high [36-37], safety attitude and safety culture in organizations, as well as their effects on work-related accidents and injury seems necessary [38]. The purpose of this study was to assessing safety attitudes among nurses and its relation with occupational accidents in training hospitals of Kerman University of Medical Sciences.
MATERIALS AND METHODS
This cross sectional study was done in 2015 at training hospitals affiliated to Kerman University of Medical Sciences: (Afzali pour, Shahid Bahonar, Shahid Beheshti and Shafa). The population study was including 1100 nurses of the studied hospitals. Based on reports of safety attitudes by nurses (78%) in previous studies [39-41], and according to population in this cross-sectional study, acceptable error of 5%, α=0.05 and with assumed 15% additional samples, the number of samples were obtained 244. The questionnaires for gathering data were included:
B) Safety Attitudes Questionnaire (SAQ). Safety aspects were classified into six dimensions (30 items):
Teamwork climate (6 items),
Safety climate (7 items),
Perceptions of management (4 items),
job satisfaction (5 items),
Working conditions (4 items), and
Stress recognition (4 items).
Each question was scored based on five-point Likert rating from 1 to 5 (1: strongly disagree, 2: disagree, 3: no difference, 4: agree, 5: strongly agree). Also, for negative questions, reverse scoring was used. Scores of each scale was graded from 0 to 100 (1=0, 2=25, 3=50, 4=75, and 5=100). The validity and reliability of SAQ were investigated and confirmed in different studies and languages, including Persian [42-46]
C) Occupational accidents questionnaire, contains of 18 occupational accidents designated according to literature reviews and previous researches such as “Cutting with sharp objects”, “Sticking needle to body”, “Exposure to blood or other body fluids”, “Breakage sample containers or slides”, “Falling foreign objects in eyes”, “Chemical splash in eyes” and etc. Each question rated as “not encountered” or “encountered less than 3 times” or “encountered more than 3 times”. The reliability of occupational accidents questionnaire has been reviewed and approved [47]. In the study conducted by Raeissi et al., Cronbach’s alpha was presented 0.81 [4].
Sampling and data collection were done after obtaining the necessary permissions and submitting it to the official departments. Sampling method was simply randomized.
In this study, inclusion criteria were having bachelor's degree or higher and having at least 12-months clinical work experience in hospitals. Incomplete questionnaires were excluded and to complete the number of samples, new samples were replaced.
Throughout the study, they were also assured that the data was only used for research purposes, and their information was confidentially reserved. Emphasis was also laid on the fact that at every stage of research, participants could withdraw from the survey.
Following the collection of the questionnaires, data was analyzed using SPSS 23 statistical software and descriptive statistics (frequency, mean, standard deviation). Inter-scale correlations of SAQ was analyzed by Pearson correlation, frequency distribution of occupational accidents and relation with SAQ dimension was analyzed by one-way ANOVA and The relationship of demographic and organizational variables with SAQ dimensions was analyzed by independent t-test and Chi square test. In order to respect the rights, principles and ethical
considerations, the purpose of the study was described for participants and subjects were asked to sign the informed consent form.
RESULTS
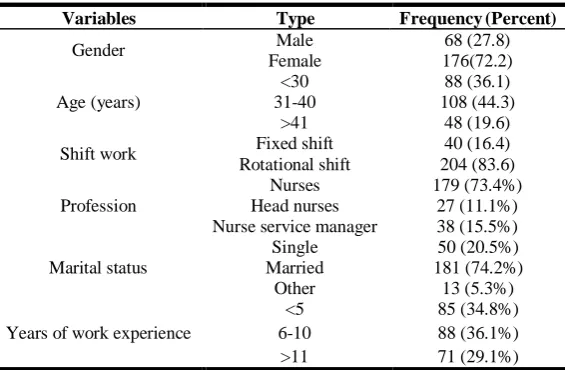
Participators characteristics are shown in Table 1. Nurses were predominantly woman (72.2%), and more than three-fourth (71.3%) of the participants were in contractual employment status. According to the results, nurses were mainly in rotational shift (83.6%). Almost 74.2% of the participants were married and the remaining was single and other states.
SAQ item descriptions are shown in Table 2. The average rate of incomplete (missing and not applicable) data at the item level was 1.65%, with a range of 0% to 3.1%. Item 10 “I know the proper channels to direct questions regarding patient safety in this office”, item 14, “This office is a good place to work”, item 15, “I am proud to work at this office”, item 16, “Working in this office is like being part of a large family” and item 23, “Senior management of this office is doing a good job” provided the highest proportion (3.1%) of missing answers, and item 1, “In this office, “It is difficult to speak up if I perceive a problem with patient care” and item 2, “The physicians and nurses here work together as a well-coordinated team” provided the lowest proportion (0%). According to the response pattern, the proportions of %-missing, %-agree, %-disagree, and %-neutral were calculated. The highest proportion of %-agree (84.6%) was related to item 2, “The physicians and nurses here work together as a well-coordinated team”. The lowest level of %-agree (43.3%) and the highest level of %-disagree (44.3%) across all items were provided by Item 28, “The staffing levels in this clinical area are sufficient to handle the number of patients”, and item 26 “This office deals constructively with personnel’s problem”.
Among all dimensions of SAQ, the highest and lowest mean and standard deviations were related to Teamwork climate (3.92±.15) and Perception of management (3.38±.38), respectively. The average score of each dimension and questions of safety attitude were moderate to high, so that among the 30-questioned survey the highest and lowest mean and standard deviation were related to “In this office, it is easy to speak up if I perceive a problem with patient care” (4.15±1.62 and “The levels of staffing in this office are sufficient to handle the number of patients (2.8±0.98).
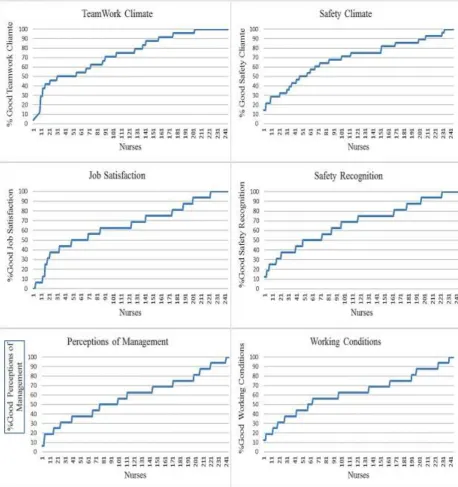
Subscale results for SAQ (N=244) are shown in Table 2 for the entire sample, reporting %-positive and mean scale statistics. Across the entire sample, %-positive ranged from 38% for perception of unit management to 58.9% for teamwork climate.
Safety Attitudes among Nurses … ijoh.tums.ac.ir | 180 and the distributions of %-positive are shown in
Fig. 1.
Less than 60% of responder’s reporting positive attitudes would indicate a need for improvement, according to the previous studies [48].
Mean scale scores and standard deviation are displayed in Table 2 and ranged from 61.82 (23.09) for perception of unit management to 74.06 (19.26) for teamwork climate.
The Cronbach’s alpha for the total SAQ was high (0.872) and it changed minimally when items were removed (0.826–0.904). Cronbach’s alpha exceeded the set cut off point of 0.82 for all scales (0.82–0.908), which indicates good scale reliability. Scale reliability is shown in Table 3. In this study, SAQ scale correlations were done by Pearson’s correlation. All scales were correlated poorly and between 0.284 and 0.297 (P<0.01). Pearson’s correlations indicated significant strong positive relationships for all other scales; correlation coefficients ranged from 0.367 to 0.774. in this regard, the most correlation coefficients were related to Safety Climate and Teamwork Climate (Table 3).
In all scales, Higher proportions of positive responders were found more in female staff than male staff, but based on independent T-test results and one way ANOVA, no significant relationship was found between demographic criteria (such as gender, age, marital status, work experience, education level) and organizational variables (such as shift work and Profession) with SAQ demotions (teamwork climate, safety climate, perceptions of management, job satisfaction, working conditions and stress recognition) (P-value> 0.05).
Data in Fig. 1 provides insight in the variability in different factors pertaining to the safety attitude, among nurses. Percentages of positive SAQ scale scores (≥ 75 out of 100) were charted to demonstrate the variability across nurses which reflected to both the presence and magnitude of each SAQ factor. There was substantial variability ranging from 0% to 100% in the percent of positive scores for each of the factors across the nurses (n=244). Item responses were visibly skewed toward the positive, but showed considerable variation across all items.
The frequency of occupational accidents among nurses was assumed in three categories:
a) Not encountered,
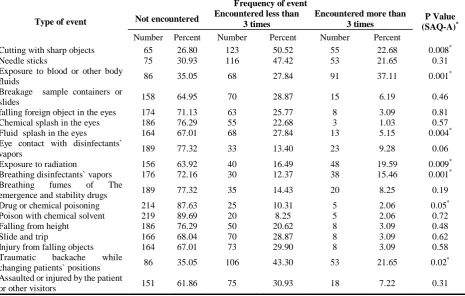
b) Encountered less-equal than 3 times and c) Encountered more than 3 times. based on the results, “Cutting with sharp objects”, have the lowest percentage of not encountered (26.80%), and Poison with chemical solvent, had the most percentage of not encountered (89.69%).
Also “Poison with chemical solvent” had the lowest frequency in less than 3 times occurrences, that was occurred just for 20 cases (8.25%) and “Cutting with sharp objects” had the most frequency that was happened for 123 cases (50.52%). “Chemical splash in eyes”, in more than 3 times accident frequencies, had the lowest percentage (1.03%), and Exposure to blood or other body fluids, had the highest percentage, (37.11%).
Also, there was a significant relationship between Exposure to blood or other body fluids and Traumatic backache while changing patient’s position with SAQ dimensions. (P<0.05) (Table 4).
Table 1. Demographic characteristics of participators in study (n=244)
Variables Type Frequency (Percent)
Gender Male 68 (27.8)
Female 176(72.2)
Age (years)
<30 88 (36.1)
31-40 108 (44.3)
>41 48 (19.6)
Shift work Fixed shift 40 (16.4)
Rotational shift 204 (83.6)
Profession
Nurses 179 (73.4%)
Head nurses 27 (11.1%)
Nurse service manager 38 (15.5%)
Marital status
Single 50 (20.5%)
Married 181 (74.2%)
Other 13 (5.3%)
Years of work experience
<5 85 (34.8%)
6-10 88 (36.1%)
Table 2.SAQ-A item descriptions and subscale results for SAQ-A among nurses studied, 2014 (n=244)
*Reverse
Questionnaire dimensions SAQ-A item descriptions Subscale results for SAQ-A
Percent of disagree Percent of neutral Percent of agree
Missing M±SD Total
M±SD Percent of Missing Percent of Positive
Min-Max M±SD
T e a m w o rk c li m a te
In this office, it is difficult to speak up if I perceive a problem with patient care.
8.3 8.2 83.5 0 4.15±1.62 3.92±0.15 3.1 58.9 4.17-100 74.06±19.26
The physicians and nurses here work together as a well-coordinated team.
9.3 6.1 84.6 0 4.09±1.59
Disagreements in this office are resolved appropriately (i.e., not who is right but what is best for the patient).
16.5 13.5 69 1 3.78±1.39
Nurse input is well received in this office.
16.5 9.3 73.2 1 3.74±1.42
I have the support I need from other personnel to care for patients
9.3 10.3 78.3 2.1 3.87±1.49
It is easy for personnel in this office to ask questions when there is something that they do not understand.
7.3 16.4 74.2 2.1 3.86±1.46
S a fe ty c li m a te
I am encouraged by my colleagues to report any patient safety concerns I may have.
17.5 20.7 60.8 1 3.6±1.3 3.62±0.05 6.2 48.4 14.29-100 67.97±20.97
The culture in this office makes it easy to learn from the errors of others.
16.5 16.4 65 2.1 3.6±1.33
Medical errors are handled
appropriately in this office.
13.4 11.3 73.2 2.1 3.65±1.43
I know the proper channels to direct questions regarding patient safety in this office.
10.3 15.5 71.1 3.1 3.68±1.41
I receive appropriate feedback about my performance.
18.6 15.5 64.9 1 3.59±1.32
I would feel safe being treated here as a patient.
19.6 11.3 67 2.1 3.54±1.33
In this office, it is difficult to discuss
errors.*
12.3 17.5 68.1 2.1 3.7±1.37
Jo b sa ti sfa c ti o n
This office is a good place to work. 19.8 24.5 52.6 3.1 2.89±1.09 3.5±0.32 5.2 48.9 0-100 68.27±24.53
I am proud to work at this office. 11.4 26.8 58.7 3.1 3.58±1.29
Working in this office is like being part of a large family.
11.4 22.7 62.8 3.1 3.62±1.32
Morale in this office is high 16.4 16.5 65 2.1 3.63±1.33
I like my job. 12.4 18.5 68.1 1 3.81±1.4
S tre ss re c o g n it io n
When my workload becomes
excessive, my performance is
impaired.
16.5 12.4 70.1 1 3.87±1.45 3.81±0.07 0 58.6 71.22(22.67) 71.22±22.67
I am more likely to make errors in tense or hostile situations.
15.5 15.5 68 1 3.71±1.37
Fatigue impairs my performance
during emergency situations (e.g. code or cardiac arrest).
16.5 15.5 67 1 3.77±1.39
I am less effective at work when fatigued.
11.4 15.5 72.1 1 3.89±1.45
P e rc e p ti o n o f m a n a g e m e n t
Senior management of this office is doing a good job.
10.4 21.6 64.9 3.1 3.68±1.35 3.38±0.38 5.2 38 61.82(23.09) 61.82±23.09
The management of this office
supports my daily efforts.
23.7 25.8 49.5 1 3.3±1.17
I am provided with adequate, timely information about events in the office that might affect my work.
11.3 16.5 70.1 2.1 3.75±1.4
The levels of staffing in this office are sufficient to handle the number of patients.
44.3 11.3 43.4 1 2.8±0.98
W o rk in g c o n d it io n
s This office does a good job of training new personnel. 9.4 11.3 78.3 1 3.83±1.51 3.57±0.3 3.1 42.6 12.5-100s 65.62±21.23
This office deals constructively with problem personnel
28.8 26.9 43.3 1 3.19±1.1
All the necessary information for diagnostic and therapeutic decisions is routinely available to me.
21.6 25.8 50.5 2.1 3.37±1.18
Trainees in my discipline are
adequately supervised.
Safety Attitudes among Nurses … ijoh.tums.ac.ir | 182
Table 3. Inter-scale correlations of SAQ-A among nurses studied, 2014 (n=244)
Factors Cronbach's Alpha Correlations (Pearson’s r)
1 2 3 4 5
Teamwork climate 0.859 1
Safety climate 0.892 0.774** 1
Job satisfaction 0.908 0.467** 0.701** 1
Stress recognition 0.844 0.284** 0.297** 0.287** 1
Perception of management 0.820 0.531** 0.649** 0.674** 0.367** 1
Working conditions 0.824 0.634** 0.709** 0.633** 0.216* 0.763**
** Correlation is significant at the 0.01 level (2-tailed) * Correlation is significant at the 0.05 level (2-tailed)
Table 4. Frequency distribution of occupational accidents and relation with SAQ-A dimension among nurses studied, 2014
Type of event
Frequency of event
P Value
(SAQ-A)*
Not encountered Encountered less than
3 times
Encountered more than 3 times
Number Percent Number Percent Number Percent
Cutting with sharp objects 65 26.80 123 50.52 55 22.68 0.008*
Needle sticks 75 30.93 116 47.42 53 21.65 0.31
Exposure to blood or other body
fluids 86 35.05 68 27.84 91 37.11 0.001
*
Breakage sample containers or
slides 158 64.95 70 28.87 15 6.19 0.46
falling foreign object in the eyes 174 71.13 63 25.77 8 3.09 0.81
Chemical splash in the eyes 186 76.29 55 22.68 3 1.03 0.57
Fluid splash in the eyes 164 67.01 68 27.84 13 5.15 0.004*
Eye contact with disinfectants`
vapors 189 77.32 33 13.40 23 9.28 0.06
Exposure to radiation 156 63.92 40 16.49 48 19.59 0.009*
Breathing disinfectants` vapors 176 72.16 30 12.37 38 15.46 0.001*
Breathing fumes of The
emergence and stability drugs 189 77.32 35 14.43 20 8.25 0.19
Drug or chemical poisoning 214 87.63 25 10.31 5 2.06 0.05*
Poison with chemical solvent 219 89.69 20 8.25 5 2.06 0.72
Falling from height 186 76.29 50 20.62 8 3.09 0.48
Slide and trip 166 68.04 70 28.87 8 3.09 0.62
Injury from falling objects 164 67.01 73 29.90 8 3.09 0.58
Traumatic backache while
changing patients` positions 86 35.05 106 43.30 53 21.65 0.02
*
Assaulted or injured by the patient
or other visitors 151 61.86 75 30.93 18 7.22 0.31
* P-Value <0.05
DISCUSSION
The present study, which was conducted to determine the safety attitude and its relation with occupational accidents rate among hospital nurses, has valuable results for influenced factors prevention program in occupational accidents.
Total score of teamwork climate was highest (3.92±0.15) and the total score of perception of management was lowest (3.38±0.38). The results were consistent with published researches [21,45,49] and indicate that teamwork climate can have high portion in safety attitude.
In this study, the Cronbach’s alpha values for six factors varied from 0.82 to 0.908. In other SAQ validation studies, the Cronbach’s alpha values at the scale level were reported 0.59-0.89 [28-29,50-53]. SAQ showed good internal consistency at the scale and instrument level. The highest Cronbach’s alpha was related to job satisfaction scale. This result was similar to study of Zimmermann et al.[29] ( and Nordén-Hägg et al. [49] ( ). The poor correlations between the stress recognition scale and all other was revealed, which indicates that this scale is different from the other scales. Kristensen et al’s study revealed negative correlations between stress recognition scale and all other scales which were done on staff members of five somatic and one psychiatric hospitals [54]. The negative correlations was approved by Nordén-Hägg et al [49]. Items in the stress recognition scale distinct from all other
items. On the other hand, significant strong positive relationships were found among all other scales. This may be due to that stress recognition scale is not reflective of safety attitude in the same way as the other scales and items in the stress recognition scale are different from all other items [50]. The same scales correlation has been found in other SAQ validation studies [28, 50-51]. Total SAQ has a high Cronbach’s alpha coefficient and when the different items were removed, it was changed minimally. The Cronbach’s alpha for all scales was calculated more than 0.8.
The interpret and assess of %-positive attitude are easy in terms of the need for improvement among managers; for example, when the staff reported positive attitude is 45% and according to the rules, less than 60% of staff reporting positive attitudes in any SAQ dimension would indicate a need for improvement [48].
Safety Attitudes among Nurses … ijoh.tums.ac.ir | 184 60% positive which was done among 1263 staff
members of somatic and psychiatric hospitals [54]. The results showed that the mean scores of nurses' safety attitudes in all scales, according to the point that 60% of staff who reported positive attitudes in any SAQ dimensions, are low. In contrast, the study by Relihan et al. in Ireland also showed that the attitude of health employees in all aspects was at a high level in an acute medical admissions unit [21]. Modak et al were reported that just safety climate has %-positive more than 60% whereas the %-positive attitude in five other scales was under 60% among nurses [45].
Based on the results, all 18 types of occupational accidents occurred at least once during the study. Gokhman et al. in a study on patients referred to medical emergencies, observed 296 errors, among which 196 and 100 ones related to improper sterilization techniques and medication errors, error and operational techniques and drug preparation errors respectively [55].
The highest frequency of incidents was related to Cutting with sharp objects, Needle sticks and Exposure to blood or other body fluids respectively. Joyani in a similar study in hospitals of Tehran University of Medical Sciences reported of the highest frequency of exposure for cutting with sharp objects [47]. As in most parts of the hospital especially nursing unit, surgery, laboratory and so on, staff highly deals with sharp objects, having high exposure to this incident is expected.
The lowest frequency in this study was related to poison with chemical solvents. The results by Masror and colleagues also showed that the most common patient safety incidents were cases such as medication errors, skin and neuromuscular injuries and post-surgery complications. The lowest frequency was related to the patient's death due to an error and leaving objects in patient’s body [56]. Other study showed that, patient falling from height and pressure sores were the most common reported accidents respectively [57]. Wolf et al. stated drug dose determination error as the most frequent medical errors [58] that is inconsistent with the results of the present study. The frequency differences of some incidents compared with the present study is related to the differences between studied safety accidents based on the types of studied centers; for example, in elderly care centers, it can be expected that pressure sores, falling or fractures is high, while in hospital centers the incidence of events is different. The accidents were influenced by many environmental, temporal and managing factors which affected the results of studies. Therefore, each of these factors can be a cause for inconsistent result as compared to other studies. Another limitation of this study was about forgetting the occurred accidents as well as fears for reporting them by nurses which causes bias in reports.
CONCLUSION
As mentioned above, the accidents frequency can affect by safety attitude. In this regard, improving factors influencing the safety attitude in nurses is vital and can introduce as an indirect way for accident prevention. With regard to the relationship between safety attitude and occupational accidents, increased awareness of managers as well as employees on safety knowledge, improved incentive system, collaborative management, employee safety and dealing with occupational stress and finding the affective causes of patient safety can develop employees' attitude to safety.
ACKNOWLEDGEMENTS
This article has been supported by Environmental Medicine Research Committee (Kerman University of Medical Sciences) with Registration number 93/454. The authors would like to express their appreciation and thanks to all the nurses of the hospitals of Kerman University of Medical Sciences who cooperated with the research team for conducting this study.
REFERENCES
1. Allahyari T, Saraji GN, Adl J, Hosseini M, Iravani M, Younesian M, et al. Cognitive failures, driving errors and driving accidents.
Int J Occup Saf Ergon 2008;14(2):149-58.
2. Aiken LH, Sloane DM, Clarke S, Poghosyan L, Cho E, You L, et al. Importance of work environments on hospital outcomes in nine countries. Int J Qual Health Care
2011;23(4):357-64.
3. Brauer RL. Safety and health for engineers. 2nd ed, John Wiley & Sons, Inc., New Jersey, USA, 2006.
4. Raeissi P, Omrani A, Khosravizadeh O, Mousavi M, Kakemam E, Sokhanvar M, et al. Occupational Accidents among Hospital Staff.
Journal of Client-Centered Nursing Care
2015;1(2):97-102.
5. Isara A, Ofili A. Prevalence of occupational accidents/Injuries among health care workers in a federal medical centre in southern Nigeria.
West Afr J Med 2014;31(1):47–51.
6. Thomas NI, Brown ND, Hodges LC, Gandy J, Lawson L, Lord JE, et al. Factors Associated with Work-Related Injury among Hospital Employees A Case-Control Study. AAOHN
journal 2006;54(1):24-31.
7. Hoskins AB. Occupational injuries, illnesses, and fatalities among nursing, psychiatric, and home health aides, 1995–2004. Retrieved
2006;9(18):2009.
2012;55(2):117-26.
9. Van Bogaert P, Kowalski C, Weeks SM, Clarke SP. The relationship between nurse practice environment, nurse work characteristics, burnout and job outcome and quality of nursing care: a cross-sectional survey. International
Journal of Nursing Studies 2013;50(12):1667.
10.Elfering A, Grebner S, Dudan A. Job characteristics in nursing and cognitive failure at work. Safety and health at work
2011;2(2):194-200.
11.Elfering A, Semmer N, Grebner S. Work stress and patient safety: observer-rated work stressors as predictors of characteristics of safety-related events reported by young nurses. Ergonomics
2006;49(5-6):457-69.
12.Kirwan M, Matthews A, Scott PA. The impact of the work environment of nurses on patient safety outcomes: a multi-level modelling approach. International journal of nursing studies 2013;50(2):253-63.
13.Rogers A, Dean G, Hwang W, Scott L. Role of registered nurses in error prevention, discovery and correction. Quality and Safety in Health Care 2008;17(2):117-21.
14.Mäkinen A, Kivimäki M, Elovainio M, Virtanen M. Organization of nursing care and stressful work characteristics. Journal of
Advanced Nursing 2003;43(2):197-205.
15.Brattig B, Schablon A, Nienhaus A, Peters C. Occupational accident and disease claims, work-related stress and job satisfaction of physiotherapists. Journal of Occupational
Medicine and Toxicology 2014;9(1):1-13.
16.Ribeiro RP, Martins JT, Marziale MHP, Robazzi MLdCC. Work-related illness in nursing: an integrative review. Revista da
Escola de Enfermagem da USP
2012;46(2):495-504.
17.Feng X, Bobay K, Krejci JW, McCormick BL. Factors associated with nurses’ perceptions of patient safety culture in China: a cross‐sectional survey study. Journal of Evidence‐Based
Medicine 2012;5(2):50-6.
18.Aboshaiqah AE, Baker OG. Assessment of nurses' perceptions of patient safety culture in a Saudi Arabia hospital. Journal of nursing care quality 2013;28(3):272-80.
19.Wakefield JG, McLaws M-L, Whitby M, Patton L. Patient safety culture: factors that influence clinician involvement in patient safety behaviours. Quality and Safety in Health Care
2010;19(6):585-91.
20.Zhang L, Gao Y. Safety Culture Model and Influencing Factors Analysis in Construction Enterprises of China. Research Journal of Applied Sciences, Engineering and Technology
2012;4(18):3297-312.
21.Relihan E, Glynn S, Daly D, Silke B, Ryder S. Measuring and benchmarking safety culture:
application of the safety attitudes questionnaire to an acute medical admissions unit. Irish
journal of medical science 2009;178(4):433-9.
22.Nieva V, Sorra J. Safety culture assessment: a tool for improving patient safety in healthcare organizations. Quality and Safety in Health Care 2003;12(suppl 2):ii17-ii23.
23.Mousavi F, Asghari M, Abbasinia M, Abbasinia O, Aasadi N, Janati SFT, et al. Survey of Patient safety climate from nursing views. Intl
Res J Appl Basic Sci 2015;9 (7): 1186-1193.
24.Hong SJ. Perception of Safety Attitude and Priority and Progress of Safe Practices of Nurses in Emergency Room. Advanced Science
and Technology Letters 2015;104:156-63.
25.Zakari NM. Attitude of academic ambulatory nurses toward patient safety culture in Saudi Arabia. Life Science Journal 2011;8(3):230-7. 26.Hammons T, Piland NF, Small SD, Hatlie MJ,
Burstin HR. Ambulatory patient safety: what we know and need to know. The Journal of
ambulatory care management 2003;26(1):63.
27.Singer S, Lin S, Falwell A, Gaba D, Baker L. Relationship of safety climate and safety performance in hospitals. Health services
research 2009;44(2p1):399-421.
28.Sexton JB, Helmreich RL, Neilands TB, Rowan K, Vella K, Boyden J, et al. The Safety Attitudes Questionnaire: psychometric properties, benchmarking data, and emerging research. BMC health services research
2006;6(1):1.
29.Zimmermann N, Küng K, Sereika SM, Engberg S, Sexton B, Schwendimann R. Assessing the safety attitudes questionnaire (SAQ), German language version in Swiss university hospitals-a validation study. BMC health services research
2013;13(1):1.
30.Buljac-Samardzic M, van Wijngaarden JD, Dekker–van Doorn CM. Safety culture in long-term care: a cross-sectional analysis of the Safety Attitudes Questionnaire in nursing and residential homes in the Netherlands. BMJ quality & safety 2015:bmjqs-2014-003397. 31.Bondevik GT, Hofoss D, Hansen EH, Deilkås
ECT. The safety attitudes questionnaire– ambulatory version: psychometric properties of the Norwegian translated version for the primary care setting. BMC health services
research 2014;14(1):1.
32.Taylor JA, Dominici F, Agnew J, Gerwin D, Morlock L, Miller MR. Do nurse and patient injuries share common antecedents? An analysis of associations with safety climate and working conditions. BMJ quality & safety
2011:bmjqs-2011-000082.
33.Clarke S. The relationship between safety climate and safety performance: a meta-analytic review. Journal of occupational health
Safety Attitudes among Nurses … ijoh.tums.ac.ir | 186 34.Stone PW, Gershon RR. Nurse work
environments and occupational safety in intensive care units. Policy, Politics, & Nursing
Practice 2006;7(4):240-7.
35.Brewer BB. Relationships among teams, culture, safety, and cost outcomes. Western
Journal of Nursing Research 2006;28(6):641.
36.Özarslan A, editor Occupational accidents among the nurses. BMC Proceedings; 2011: Springer.
37.Ceylan C, Beşer A. Investigation of the work accidents based on the statement of the nurses at the hospital in Turkey. HealthMED
2011;5(6):2015-23.
38.Weaver MD, Wang HE, Fairbanks RJ, Patterson D. The association between EMS workplace safety culture and safety outcomes.
Prehospital emergency care 2011;16(1):43-52.
39.Hosseini Nodeh Z, Hosseini M, Yaghmaei F, Alavi Majd H, Jabbari M. Correlation between population characteristics and safety attitude to work of women workers in food factories.
Journal of Health Promotion Management
2012;1(3):64-72.[In Persian]
40.Arab M, Mohammadian F, Rahmani A, Rahimi A, Omidi L, abbasi brojeni P, et al. Safety Attitude in Operating Room’s Staff’s in selected hospitals of Tehran University of Medical Sciences in 2013. Hospital (Rio J)
2014;13(3):25-33.[In Persian]
41.Khalilzadeh H, Hemmati Maslakpak M, Mohaddesi H, Zare Fazlollahi Z. Attitude Among Urmia Medical University Health Workers About Patient Safety. Journal of Nursing and Midwifery Urmia University of
Medical Sciences 2013;11(8):606-13.
42.Bondevik GT, Hofoss D, Hansen EH, Deilkas ECT. The safety attitudes questionnaire– ambulatory version: psychometric properties of the Norwegian translated version for the primary care setting. BMC Health Serv Res
2014;14(1):1-10.
43.Buljac-Samardzic M, van Wijngaarden JD, Dekker–van Doorn CM. Safety culture in long-term care: a cross-sectional analysis of the Safety Attitudes Questionnaire in nursing and residential homes in the Netherlands. BMJ Qual Saf 2015(0):1-9.
44.Gabrani A, Hoxha A, Simaku A, Gabrani JC. Application of the Safety Attitudes Questionnaire (SAQ) in Albanian hospitals: a cross-sectional study. BMJ open
2015;5(4):e006528.
45.Modak I, Sexton JB, Lux TR, Helmreich RL, Thomas EJ. Measuring Safety Culture in the Ambulatory Setting: The Safety Attitudes Questionnaire—Ambulatory Version. J Gen
Intern Med 2007;22(1):1-5.
46.Azimi L, Tabibi SJ, Maleki MR, Nasiripour
AA, Mahmoodi M. Influence of training on patient safety culture: a nurse attitude improvement perspective. Int J Hosp Res
2012;1(1):51-6.
47.Joyani Y, Raadabadi M, Kavosi Z, Sadeghifar J, Momenei K. Relationship Between The Occupational Accidents And Absence From Work Employees In Shiraz Namazi Hospital.
Payavard Salamat 2011;5(3):70-9.[In Persian]
48.Schwendimann R, Zimmermann N, Küng K, Ausserhofer D, Sexton B. Variation in safety culture dimensions within and between US and Swiss Hospital Units: an exploratory study.
BMJ Qual Saf 2012:bmjqs-2011-000446.
49.Nordén-Hägg A, Sexton JB, Kälvemark-Sporrong S, Ring L, Kettis-Lindblad Å. Assessing safety culture in pharmacies: the psychometric validation of the Safety Attitudes Questionnaire (SAQ) in a national sample of community pharmacies in Sweden. BMC
Pharmacol Toxicol 2010;10(1):8.
50.Taylor JA, Pandian R. A dissonant scale: stress recognition in the SAQ. BMC Res Notes. 2013;6(30):2.
51.Kaya S, Barsbay S, Karabulut E. The Turkish version of the safety attitudes questionnaire: psychometric properties and baseline data. Qual
Saf Health Care 2010:qshc. 2008.032003.
52.Göras C, Wallentin FY, Nilsson U, Ehrenberg A. Swedish translation and psychometric testing of the safety attitudes questionnaire (operating room version). BMC Health Serv Res
2013;13(1):104.
53.Deilkås ET, Hofoss D. Psychometric properties of the Norwegian version of the Safety Attitudes Questionnaire (SAQ), generic version (short form 2006). BMC Health Serv Res
2008;8(1):1.
54.Lee W-C, Wung H-Y, Liao H-H, Lo C-M, Chang F-L, Wang P-C, et al. Hospital safety culture in Taiwan: a nationwide survey using Chinese version safety attitude questionnaire.
BMC Health Serv Res 2010;10(1):1.
55.Kristensen S, Sabroe S, Bartels P, Mainz J, Christensen KB. Adaption and validation of the Safety Attitudes Questionnaire for the Danish hospital setting. Clin Epidemiol 2015;7:149. 56.Gokhman R, Seybert AL, Phrampus P, Darby J,
Kane-Gill SL. Medication errors during medical emergencies in a large, tertiary care, academic medical center. Resuscitation 2012;83(4):482-7. 57.Masror d, heydarikhayat n, joolaee s. Assessing patient safety events and it’s correlation with nurse-physician interaction from nurses’view.
Quarterly Journal of Nursing Management
2012;1(2):37-45.[In Persian]
58.Firth-Cozens J. Cultures for improving patient safety through learning: the role of teamwork.