Pedestrian Traffic Flow Prediction based on ANN Model and
OSM Data
Achituv Cohen*, Sagi Dalyot
Faculty of Civil and Environmental Engineering Technion - Israel Institute of Technology, Haifa 3200003 Israel,
[email protected], [email protected]
Abstract: One of the main challenges that blind pedestrians have to cope with in their daily life is orientation and navigation while walking the urban space. In our previous research, a computerized network route calculation algorithm for blind pedestrians was developed, which relies on OpenStreetMap (OSM) mapping data, aimed at calculating optimal routes in terms of accessibility and safety. Despite the potential and practicability of our solution, critical mapping data is still missing in OSM to allow a comprehensive and scalable solution. One data type is related to pedestrian traffic flow that has been found to influence the path blind pedestrians will choose to walk. Artificial Neural Networks (ANN) model, which allows learning and predicting different phenomena from training samples by investigating the correlation and effects among various environmental features, is developed and used to model and predict pedestrian traffic flow, while relying on the existing OSM data. To model the ANN, we have relied on parameters and factors related to the streets’ geometrical and topological configuration, as well as points of interest nearby, e.g., public transportation and shops, to name a few. The ANN model was trained using training samples of pedestrians traffic flow collected in the center of Tel-Aviv. Implementing the computed ANN model, nearly 90% of the testing data was successfully predicted. We believe that this ANN model can accurately generate new data, which together with the existing OSM data, can greatly contribute and augment the reliability of route calculation algorithms for blind pedestrians.
Keywords: artificial neural networks, OpenStreetMap, blind pedestrians, pedestrian traffic flow, map enrichment
1.
Introduction
Despite the decline in the percentage of people with visual impairments in the population, their numbers are still very high. As of 2018, 441.5 million visually impaired people live in the world; 36 million of them are completely blind, and the rest with moderate to high visual impairment1. Blind people have many challenges in their daily life and activities. One of the main challenges they face is orientation, navigation and walking from place to place in the urban space. Because of the lack of vision, it is more difficult for them to use landmarks - street names, points of interest (POI), street configuration - which allow sighted pedestrians to orient themselves in the urban space. In addition, blind pedestrians are not always able to identify obstructions on the way. For example: street lamps, trees and garbage containers placed in the middle of the sidewalk, parking entrances and barriers on their path. As a result of not knowing these factors beforehand, they prefer to avoid walking outside, specifically in unknown areas, which limits them in terms of equality, preventing them to fully integrate into society.
Most solutions offered to this group rely on technologies, which translate and communicate the immediate
1World Health Organization: Blindness and vision impairment
calculation solutions for the creation of various routing services.
One of the conclusions from our previous work was that despite the extensive OSM mapping, and the ability to use this information for blind pedestrian route calculations, there is still a lack of data, both in terms of coverage and type, to allow a comprehensive and scalable solution. Data, such as sidewalks, walking paths and pedestrian crossings, is missing in many places. But more than that, information for time-based phenomena, such as the traffic volume of pedestrians throughout the day, does not exist at all. Therefore, the main objective of this study is to investigate, analyze, and present capabilities that enable the calculation of pedestrian traffic flow.
Our hypothesis is that the missing data can be completed by understanding the spatial correlation existing among the physical phenomena and the spatial structure. For example, the presence of shops along a street indicates the presence of a sidewalk, thus increasing the likelihood that more people will walk on this street. One of the most popular and powerful techniques, which draws conclusions about data and information through their correlation with other features, is machine learning. Machine learning is concerned with the development of algorithms designed to enable the computer to learn from examples, operating in a variety of computational tasks, in which classical programming is limited or impossible. By using and implementing these algorithms, it will be possible to draw conclusions related to the existing correlations and create models that can be used to analyze complex data and produce accurate results. We believe that by exploring the correlations between data and physical phenomena, we can deduce and create a complete database with many examples for machine learning algorithms that can produce accurate predictions – in our case, pedestrian traffic flow. Accordingly, we will produce the new missing data that will be used to enrich the mapping database, and in turn, will greatly contribute to the reliability of our route calculation algorithm.
2.
Related Work
As part of the rapid progress in the development of satellite navigation systems, digital maps and smartphones, developments related to blind pedestrians technological solutions have been accelerated. Alongside, the benefits of OSM have encouraged researchers to use this mapping infrastructure for navigation solutions for this community. Solutions can be classified into three groups:
1) Enhancing supplementary senses. Studies have attempted to convert existing data into maps for tactile or hearing information. (Watanabe et al. 2014) showed how OSM can be used to create physical tactile maps. Like Braille, the researchers defined a set of signs that allows the users to understand from touch what are the spatial objects they are touching. For example, a line consisting of dots of 3 mm at a distance of 5 mm indicates a road with an accessible sidewalk. In contrast, with the decline in the number of blind people who are currently writing Braille, and in parallel to the increase in their use of
computers, other studies are aimed at both sensory and auditory channels for the accessibility of data existing on maps. “Open Touch / Sound Maps” is an example of an application that allows users to move around in a virtual space, and get information based on where they are. The information is obtained from OSM and is transmitted to the user with voice messages and sensory aids (Kaklanis and Votis, 2011).
2) Navigation applications. Various navigation applications, using a variety of sensors, identify the users’ location, sending a voice message about their location, POIs in their vicinity, and provides directions to the destination (Guy and Truong, 2012). Some applications even send warning messages if the users are detected off track, or when obstacles are identified nearby so that the environment becomes more familiar and safer (Dornhofer, et al. 2014). In addition, the smart device can be left in the pocket, allowing the users to use their hands to hold aids (guide stick, or guide dog's strap) as they navigate (Guy and Truong, 2012). The main problem with these solutions is that they use the shortest route that is not always accessible to blind pedestrians. These routes might include crossing roads without pedestrian crossing, walking on roads without sidewalks, walking on crowded streets or streets having many obstacles (if at any time, the app sends a warning, it would become a nuisance rather than an aid tool).
emphasis on the urban environment (Dallmeyer et al. 2014). This study used machine learning tools to build the simulation, while examining three existing learning methods - supervised learning, unsupervised learning and reinforcement learning. The simulation allows adding more GIS layers and the correlation among them. For example, if one adds a precipitation and elevation layers, the simulation will be able to predict the extent to which these data affect the pedestrian traffic in the area. However, the learning classifier being used to predict pedestrian and car flow was trained only with vehicles data. Additionally, the simulation was based only on features like velocity, which are not retrievable from OSM.
(Codeca et al. 2017) defined general requirements to model pedestrian traffic flow that can be used in different study cases (for example, a typical European city includes a city center surrounded by neighborhoods connected to the city center by regional roads). However, not all the information necessary for these requirements are found in OSM, but only in other sources of information (e.g., demographic information of the city).
The use of machine learning algorithms in GIS handles mainly the inclusion of maps, building extraction, road identification, classification of land cover from aerial photographs and analysis of satellite images (Zenasni et al. 2018). Several studies have used existing OSM data to complete missing OSM data. For example, (Jilani et al. 2014) suggested to complete missing data related to the road type (e.g., primary, secondary, pedestrian) by using machine learning algorithms that will analyse the areas in which this information exists, and from which the spatial and topological features of the road type will be studied. Several machine learning algorithms were examined, and only the best results for the test data were applied to the areas where these data were missing. (Li et al. 2014) tried to automatically identify the number of road lanes in several cities in Germany, by using a polygon-based method that outlines roads to construct a set of features that are related to the road type, and then a Support Vector Machine (SVM) algorithm is applied. ( Jamal et al. 2013) suggested using a decision tree algorithm for classifying land use in OSM. According to this method, the spatial features of the different landscape pattern were studied, and on this basis the decision tree was built. The results obtained from the model were compared to the classification obtained from an authorized database and received a classification accuracy of 91%. The Random Forest algorithm is an advanced version of the decision tree algorithm, where researchers showed how data in OSM can be completed for certain tags based on data existing in other elements (Funke and Storandt, 2017). For example, if the value of the key "name" of the element is “Cut & Colour”, then this is probably a hairdresser, so the value of the key "amenity" is likely to be "hairdresser".
3.
Methodology
3.1 ANN model
ANNs are designed to compute models that mimic the biological neural networks by processing complex data inputs and learning to perform tasks by considering examples. An ANN is based on a collection of connected units, or nodes, called artificial neurons. The model receives input values in respect to each feature in the first layer of neurons, and then processes them through a series of non-linear functions that receive various weights and biases values (in the edges that connect the hidden layers) to predict the right label (by selecting the closest value to 1 from all the neuron in the output layer); in our case - determining pedestrian flow levels.
Training the ANN model is executed with the parameters that gain high accuracy. The parameters that mostly affect the accuracy are: 1) Activation function - the function to calculate the value of each neuron in the hidden layers (e.g., ‘logistic’ and ‘ rectifier’); 2) Hidden layer size - the number of hidden layers and the number of neurons in each hidden layer; 3) Number of epochs – the selected maximum number of iterations in the optimization process; 4) Solver - the selected optimizing method for weights, such as ‘sgd’ and ‘adam’; 5) Learning rate – determine the changing rate for the updating weights and biases.
The evaluation comprises of two parts. A preliminary evaluation for the accuracy, which is achieved using two metrics: 1) Score, which examines whether the calculated ANN model accurately predicts the label (in our case - flow level) of the training samples; 2) Loss function value, which is used to measure the differences between the predicted and the actual values. The closer the value is to zero, the higher the accuracy of the model. The second, and more significant part, is the comparison between the predicted labels to the actual labels of the test samples; usually, of all samples, 20% are used as the testing set.
3.2 Features Selection
Environmental features affect the pedestrian traffic flow, whereas some can be extracted - or calculated – from the OSM elements and tags. (Qin, 2016) reviews various possible features that affect the pedestrian traffic flow. These features relate to the connectivity of the street network, the semantic attributes of the neighborhoods (e.g., safety, type, density) and the streets (i.e., land use), and the environmental features (i.e. amenities, aesthetics). Additional features that were found to have an effect are: tourist sites and public transportation stations (Omer et al. 2015).
1996) and (Peponis and Wineman, 2002) proved that the two main measures (indices) that show the most influence on pedestrian traffic flow are Integration (INT) and Choice (CH). The Integration index examines the number of intersections that must be traversed in the shortest path to reach each segment in the network from the examined street segment. Segments with a relatively small number of intersections needed to reach all the streets in the network are considered as connected streets, and hence have a more central meaning in the street network. The Choice index examines for each street segment how many times will it be used as part of the route in the shortest route between all street segments. A high Choice value indicates high connectivity. Accordingly, the more connected the street is, the more popular it is among pedestrians.
Semantic attributes of neighborhoods features do not exist in OSM. But because these features are considered to have a lesser impact on the traffic flow levels, in addition to the fact that they have a more global effect rather than on specific streets, they were not taken into account at this stage of the study.
Land Use features are largely missing in OSM, but other features that do exist in the vicinity can have an indication regarding the land use. Shops, for example, indicate on a commercial district, as offices on a business district. Shop and office data can be extracted from points or polygons elements, where the value in key “office” or “shop” is not empty.
The relevant environmental features were also extracted from OSM by looking at the elements’ tags, namely: 1) Tourism features, which relate to landmarks and sites that attract tourists (e.g., museums), and also tourism-related facilities (e.g., hotels); 2) Amenity features, which cover an assortment of community facilities, such as banks and post offices; 3) Aesthetic features, which relate to places like parks and gardens; and, 4) Transportation features, presenting bus and train stations. Another feature that is taken into account relates to time, which examines the traffic flow according to the hour-of-day.
The features retrieved from the OSM vector data were split into two groups derived from their geometric representation – points and polygons. One single store, for instance, that is represented as a point element, has a different effect on the traffic flow as a shopping center, which is represented as a polygon element.
Figure 1 summarizes the 15 features that were extracted - or calculated - from OSM, found to have an effect on the pedestrian traffic flow, and hence are added to the ANN model.
Figure 1. The features defined as affecting the pedestrian traffic flow.
3.3 OSM data processing
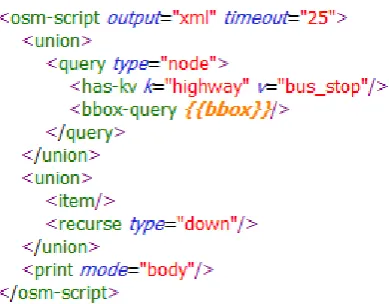
The processing stages detailed here are developed to run automatically on the OSM data, adding the relevant feature instances to the street network in the ANN model. The streets network and feature instances are downloaded from OSM using the QuickOSM plugin in QGIS 3 software. The plugin allows downloading data from a selected area in OSM according to a defined spatial and textual query. An example of a query is depicted in Figure 2, where the plugin downloads all the points for a defined area where the value in the "highway" key is "bus_stop", that is, geographical elements in OSM that represent bus stops.
Figure 2. An example of a query in the QuickOSM plugin, which results in the download of bus stops elements from OSM that exists in the extent of the required area and convert them to a shape file.
Three toolboxes containing several ArcGIS Model Builders scripts, depicted in Figure 3, were designed and developed to implement three steps. The first step is to sort the downloaded elements into the appropriate features defined in section 3.2. The models in this step sort the point and polygon elements into different feature classes by looking at the elements’ tags. For example, all the point elements whose value in the office key is not empty are considered as an office feature.
Figure 3. The ArcGIS Model Builder scripts designed and developed to find the number of instances each road segment have from the various features, and whether the segment crosses or is contained in the instance of a polygon.
space syntax •integration •choice
tourism •points •polygons
shop •points •polygons
amenity •points •polygons
office •points •polygons
asthetics •points •polygons
trnansportaion •points •polygons
In the second step, each street segment is examined with respect to the environmental features and the spatial configuration of the street network, following this set of rules:
• Point type features – for each feature the toolbox counts the number of features at a distance of 20 meters (for example, how many shops exists within a distance of 20 meters from a certain street segment).
• Polygon type features – for each feature the toolbox examines whether the feature crosses or contains the street segment.
• Space syntax metrics – the Graph Analysis plugin in QGIS 2 is used to calculate the CH and INT values. The plugin sends the network to depthmapXnet, a multi-platform software, to perform a set of spatial network analyses designed to understand social processes within the built environment, which performs the calculations, and returns the CH and INT metrics values.
The third step in the data processing is normalization. ANN works best when the values’ range is not too large. Accordingly, for each feature, the normalization is made as follows: 1) CH and INT metrics - normalization was performed in relation to the maximum value, so that the range of values is between 0 and 1; 2) Point type feature - the number of feature instances was divided by the segment length; 3) Polygon type feature - normalization is not required, since the values are 1 if the feature crosses or contains the segment, and 0 if not.
3.4 ANN model labels
The study of (Helbing, 2009) defined five traffic flow levels for pedestrians, depicted in Figure 4. In an interview we have conducted with an Orientation and Mobility counselor working with pedestrians having visual impairments, we learned that defining the traffic flow levels for blind pedestrians is different - both in scale (level) and meaning. Accordingly, the traffic flow levels are divided into three levels: 1) pedestrians walking within a distance of more than 15 meters from one another is considered as a low-level, and is not recommended for blind pedestrians, mainly in terms of assistance and orientation; 2) pedestrians walking within a distance of 1 to 15 meters from one another is considered as a medium- level, which is the optimal level for blind pedestrians, assuring them to move easily in terms of orientation, and safely in terms of assistance in case required; 3) pedestrians walking within a distance of less than 1 meter is considered a high-level, and is inconvenient for blind pedestrians, not allowing them to move easily. Consequently, the ANN model labels consist of three traffic flow levels: l for low traffic flow, 2 for medium traffic flow, and 3 for high traffic flow.
Figure 4. The density levels in units per square meter per person according to (Helbing, 2009).
4.
Experiments and Results
4.1 Experiment area
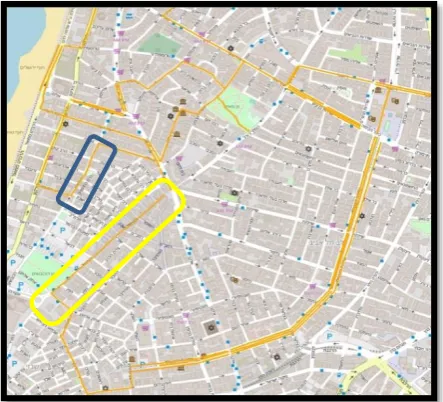
Tel Aviv center, depicted in Figure 5, is chosen as the experiment area because in a relatively small extent there exists a good variety of street types, which are derived from the various districts, e.g., business, commercial and entertainment. The streets in orange color in Figure 5. are the streets selected as the training samples, since they are comprised of a wide variety of streets with different traffic flow levels, thus should serve as a good input for implementing the algorithm and developing the ANN model. For example, the Carmel Street (depicted as a yellow rectangle), which is the main street in the Carmel Market, is known to be a very crowded street, compared to Ezra Scribe Street (depicted as a blue rectangle) - and others in the vicinity - that areknown to be mostly empty streets.
Figure 5. The experiment area, streets in orange are streets from which data were collected (field survey).
4.2 Collecting the training data
as input in the ANN model (training data), and the remaining 20% are intended to test the model (testing data). The samples collection was performed using the ArcGIS collector application, which allows editing GIS layers on the fly using a smartphone.
Three steps precede the training of the ANN algorithm:
• OSM data processing – the features instances and street network within the experiment extent are downloaded from OSM and processed, as described in section 3.3. In the experiment area no polygon feature instances of Tourism, Office and Transportation were found, hence excluded from the features list.
• Time – conversion of time from date format to decimal number format and normalizing it to a range of values between 0 and 24 using the formula in Equation 1. It should be noted that we analyze and evaluate our methodology with respect to working days only.
minutes hours
60 decimal_time
24 +
= (1)
• Flow level index – for each sample (i.e., a measured street segment), its length was divided by the number of pedestrians, and the label was determined according to the three given value in Section 3.3, i.e., Label 1, Label 2, and Label 3.
At the end of this stage, each sample receives a value in respect to each feature, and the intensity of the measured phenomenon (i.e., label) is the flow level index.
4.3 Training the ANN model
The 125 samples collected in the survey were divided randomly into two groups: 100 samples are referred to as training data for the ANN algorithm, and the remaining 25 are test samples. The model was built and run using the scikit-learn machine learning package in python. Preliminary evaluation of the training data showed high accuracy, with a value of 1 for score metric, meaning that the ANN model accurately predicts all the training sample labels, and a value of 0.0003 for the loss function metric, showing a good matching between the predicted and the true values.
Training the ANN model was executed with the parameters that gained the highest accuracy for the loss function and score values: 1) Activation function - Logistic activation type; 2) Hidden layer size - 3 hidden layers are selected: the first with 39 neurons, the second with 40 neurons, and the third with 6 neurons; 3) Number of epochs – the selected maximum number of iterations in the optimization process is 10000; 5) Solver - the selected optimizing method for weights is the quasi-Newton method; 5) Learning rate – adaptable learning rate rather than constant.
4.4 Evaluation of the ANN model
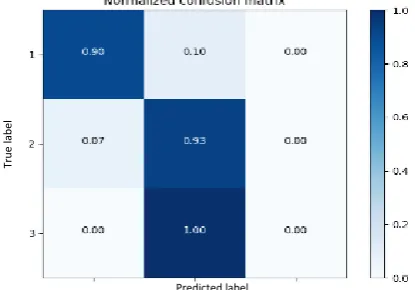
After the training stage is finalized, the ANN model is ready for testing and evaluation. A confusion matrix, which shows the number of test examples that were
correctly - and incorrectly - classified, was used to evaluate the results. Figure 6 depicts the confusion matrix obtained for the testing samples. 90% of the testing samples belonging to level 1 (low flow-level) were classified correctly, and 93% of the testing samples belonging to level 2 (medium flow-level) were classified correctly. The only existing example for density level 3 (high flow-level) was incorrectly classified, mainly since only two samples exists, requiring additional training data of this flow-level. A total of 88% (22 out of 25) of the testing samples were correctly classified - a relatively high percentage, indicating an accurate and reliable ANN model.
Figure 6. The confusion matrix of the expected flow levels in the ANN model, compared to the actual flow levels observed in the field.
According to (McCahill et al. 2008), the logarithm of the values obtained from the space syntax metrics should be used to obtain a more reliable result of the model. The algorithm runs with several different neurons in each layer relative to the previous state (hidden layer size = [38,42,16]). The results showed a lower accuracy relative to the previous results obtained - 80% of the testing samples were classified correctly. On the other hand, the algorithm succeeded in correctly classifying all the samples that belong to the medium flow-level. A possible explanation might be that more training samples (as in the case of level 2 - 57 samples) lead to more accurate results when the logarithm space syntax metrics values are used. Another data collection with new streets in the experiment area was made, to compare the existing ANN model on a different data sample. Out of the 18 new street segments surveyed, 16 were correctly predicted. Meaning that close to 89% of the streets were correctly predicted in terms of pedestrian traffic flow, a similar prediction value obtained for the first testing sample (88%).
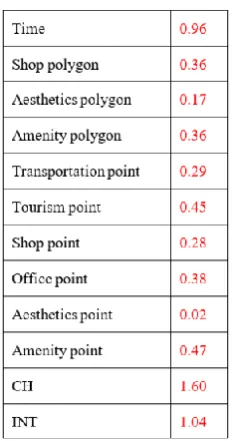
Table 1 presents the mean weights of the features (i.e., the input) of the first hidden layer. Examining these weight values, we can conclude that the values of the space syntax indices (INT, CH) have the most impact on the ANN model. This conclusion is consistent with the insights made in previous studies that investigated this issue (Omer et al., 2015). Time also has a relatively large effect when compared to the other features. In contrast, the aesthetics feature has almost no effect on the model.
Predicted label
Tr
u
e
lab
Table 1. The effect (weight) of the features on the neurons network in the first hidden layer.
Since micro-mapping (mapping of small geographic elements) is not always complete in OSM2, the ANN model was also implemented with the geometrical attributes of the road network (i.e., INT and CH features) and the time feature. This implementation is designed to evaluate the reliability of the ANN model in predicting pedestrian traffic flow in cases where certain features are missing from the OSM database. The result showed an accuracy of 80%, which is still high, compared to 88% when the micro-mapping OSM features were used.
4.5 Evaluation of the overall results
The model was applied for all the streets in the experiment area (Figure 5), where the traffic flow levels were not measured (sampled). Figure 7 depicts the statistics of all street segments according to the different pedestrian traffic flow levels and the different time-of-day. It appears that the model succeeds in predicting the different flow-levels for Tel-Aviv. The model predicts that during the morning hours, only a small number of streets, which are located nearby business districts, main transportation stations, and schools, are crowded, while the majority are predicted with a low flow level, pointing to the fact that in this time-of-day it is less preferable for blind pedestrians to navigate the city, since most streets are either empty or crowded. The largest number of streets with a high flow-level is obtained around noon, probably people heading out to eat and shop where all POIs are open. The afternoon hours are the best hours for blind pedestrians to walk, since the flow-level is optimal - although many people are strolling the streets, the pedestrian traffic spreads relatively uniformly across the city because this is no longer a working time for all, so people move across different street types, not concentrating in small areas. In the evening, the dispersion is similar to that of the morning hours.
2OSM wiki
Figure 7. The number of street segments per flow-levels throughout the day for the entire experiment area.
5.
Conclusions
The ANN model predicts the different pedestrian traffic flow-levels with an accuracy of 90%. These results are very promising since the ANN model’s prediction relies mainly on the geometrical attributes of the road network, which are mostly accurate and up-to-date in the majority of the cities mapped in OSM; this is in contrast to the point elements, such as shops, which are not always complete and up-to-date (Zhang and Malczewski, 2018). This indicates that even if some OSM data is missing, the ANN model should still be capable of providing reliable results with adequate certainty. Time also has a large impact, and it was presented that the model predicted logical flow-level estimations for the different time-of-day in the examined area.
To fully evaluate the current ANN model and prove its scalability, our main aim is to conduct a larger scale and comprehensive survey, which will include other locations (cities), containing all possible flow-levels and feature types. This will be achieved either by additional extensive on-site observations, or by data received from external sources (such as cell-phone signatures). Some of the features have a lesser effect on the ANN model due to missing OSM data, such that further analysis will be made to evaluate this effect on the ANN model’s prediction rate. Moreover, ways to enrich OSM with missing data will be made, which can further contribute to the existing ANN model robustness. Alternative mapping infrastructures (e.g., government), other than OSM, will also be examined.
Overall, we believe that this is a first step towards the enrichment of mapping infrastructures that can be used for various tailored navigation purposes, such as the route calculation for blind pedestrians suggested here. Not only does static missing data, such as sidewalks and crossings, can be generated, but also temporal data that was shown to have a critical effect on the practicality of the solution. Once these are achieved, the route calculation algorithm for blind pedestrians will produce safer and more accessible and navigable routes, contributing to this community by assisting them to walk more confidently in urban environments.
1196
758
586
956
225
594
839
461
16 85 12 20
8:00 12:00 16:00 20:00
6.
References
Branham, S. M., Abdolrahmani, A., Easley, W., Scheuerman, M., Ronquillo, E., & Hurst, A. (2016). Is Someone There? Do They Have a Gun? ; How Visual Information about Others Can Improve Personal Safety Management for Blind Individuals. In W4A’16. Oct.29–Nov.1, 2017, Montreal, Canada. Chandler, E., & Worsfold, J. (2013). Understanding the requirements of geographical data for blind and partially sighted people to make journeys more independently. Applied Ergonomics, 44(6), 919–28. Codeca, L., Frank, R., Faye, S., & Engel, T. (2017). Luxembourg SUMO Traffic (LuST) Scenario: Traffic Demand Evaluation. IEEE Intelligent Transportation Systems Magazine, 9(2), 52–63. Cohen, A. (2017). Building a Weighted Graph based on
OpenStreetMap Data for Routing Algorithms for Blind Pedestrians. Technion - Israel Institute of Technology.
Dallmeyer, J., Lattner, A. D., & Timm, I. J. (2014). GIS-Based Traffic Simulation Using OSM. In Data Mining for Geoinformatics (pp. 65–82). New York, NY.
Dornhofer, M., Bischof, W., & Krajnc, E. (2014).
Comparison of Open Source routing services with OpenStreetMap Data for blind pedestrians.
FOSS4G-Europe 2014. Bremen, Germany. Funke, S., & Storandt, S. (2017). Automatic Tag
Enrichment for Points-of-Interest in Open Street Map. In International Symposium on Web and Wireless Geographical Information Systems (pp. 3– 18).
Guy, R., & Truong, K. (2012). CrossingGuard: exploring information content in navigation aids for visually impaired pedestrians. In Proceedings of the SIGCHI Conference on Human Factors in Computing Systems (pp. 405–414). May 5–10, 2012, Austin, Texas, USA.
Helbing, D. (2009). Pedestrian, Crowd and Evacuation Dynamics. In Encyclopedia of Complexity and Systems Science (pp. 6476–6495). New York, NY. Hillier, B. (1996). Space is the Machine: A
Configurational Theory of Architecture.
Cambridge: Cambridge University Press.
Jamal Jokar Arsanjani, Marco Helbich, Mohamed Bakillah, J. H., & Zipf, & A. (2013). Toward mapping land-use patterns from volunteered geographic information. International Journal of Geographical Information Science, 27(12), 2264– 2278.
Jilani, M., Corcoran, P., & Bertolotto, M. (2014). Automated highway tag assessment of OpenStreetMap road networks. In Proceedings of the 22nd ACM SIGSPATIAL International Conference on Advances in Geographic Information Systems (pp. 449–452). New York, New York, USA.
Kaklanis, N., & Votis, K. (2011). HapticRiaMaps:
towards interactive exploration of web world maps for the visually impaired. In Proceedings of the International Cross-Disciplinary Conference on Web Accessibility (p. 20). March 28 - 29, 2011, Hyderabad, Andhra Pradesh, India.
Li, Q., Fan, H., Luan, X., Yang, B., & Liu, L. (2014). Polygon-based approach for extracting multilane roads from OpenStreetMap urban road networks.
International Journal of Geographical Information Science, 28(11), 2200–2219.
McCahill, Chris, Garrick, & Norman W. (2008). The Applicability of Space Syntax to Bicycle Facility Planning. Journal of the Transportation Research Board, 2074 (Transportation Research Record), 46– 51.
Omer, I., Rofè, Y., & Lerman, Y. (2015). The impact of planning on pedestrian movement: contrasting pedestrian movement models in pre-modern and modern neighborhoods in Israel. International Journal of Geographical Information Science,
29(12), 2121–2142.
Peponis, J. and Wineman, M. (2002). The spatial structure of environment and behavior. In Handbook of environmental psychology (p. 271–291). New York. Qin, Q. (2016). Exploring Pedestrian Movement Patterns with Urban Environmental Factors in Beijing. The Pennsylvania State University.
Timothy Weyrer, Hartwig Hochmair, G. P. (2014). Intermodal Door-to-Door Routing for People with Physical Impairments in a Web-based Open Source Platform. Transportation Research Record: Journal of the Transportation Research Board, 2469, 108– 119.
Watanabe, T., Yamaguchi, T., Koda, S., & Minatani, K. (2014). Tactile map automated creation system using OpenStreetMap. In Computers Helping People with Special Needs (pp. 42–49).
Zenasni, S., Kergosien, E., Roche, M., & Teisseire, M. (2018). Spatial Information Extraction from Short Messages. Expert Systems with Applications, 95, 351–367.
Zhang, H., & Malczewski, J. (2018). Accuracy Evaluation of the Canadian OpenStreetMap Road Networks.