Vol.9 (2019) No. 1
ISSN: 2088-5334
Real-Time Wheat Classification System for Selective Herbicides
Using Broad Wheat Estimation in Deep Neural Network
Arif Ullah
#, Nazri Mohd Nawi
#1, Anditya Arifianto
*, Imran Ahmed
+, Muhammad Aamir
#,
Sundas Naqeeb Khan
##
Faculty of Computer Science and Information Technology, Universiti Tun Hussein Onn Malaysia, 86400, Johor, Malaysia 1
E-mail: [email protected]
*
School of Computing, Telkom University, 40257 Bandung, West Java, Indonesia
+Institute of Management Sciences, Peshawar, Pakistan
Abstract
—
Identifying seed manually in agriculture takes a long time for practical applications. Therefore, an automatic and reliable plant seeds identification is effectively, technically and economically importance in agricultural industry. In addition, the current trend on big data and data analysis had introduced scientist with many opportunities to use data mining techniques for better decision in various application. Recently, there are various number of applications that use computer-aided in improving the quality in controlling system. Classifying different types of wheat hold significant and important role in agriculture field. An improvement on such kind of system that makes distinctions based on shape color and texture of wheat plantation is crucial. The main objective of this paper is to develop a machine vision system which identifies wheat base on its location. For this purpose, a real time robotics system is developed in order to find plant in sorrowing area using pattern recognition and machine vision. For real-time and specific herbicide applications, the images are categorized in either expansive or precise categories via algorithm following the principal of morphological operation. Different experiments were conducted in order to gauge the efficiency of the proposed algorithm in terms of distinguishing between various types of wheats. Furthermore, the experiments also performed admirably amid varying field conditions. The simulation results show that the proposed algorithms exhibited 94% success rate in terms of categorizing wheat population which consists of 80 samples and out of them 40 are narrow and 40 broad.Keywords— image processing; wheat detection; real-time recognition; morphological.
I. INTRODUCTION
Nowadays, wheat controls in the initial stage is an expensive technique and consume more time to be implemented. Therefore the research area in this field is challenging and requires extensive care is needed in making sure that the wheat production is at its optimum. Therefore, many developed countries had used cutting edge technology which includes biotechnology and information technology. The most critical challenges in the growth stage of wheat are the cultivation of the plant because of their leaves make the shadow for emerging wheat. This infection is caused due to their slow development and also because of the use of chemical and mechanical which also affected wheat cultivation. Therefore, it is necessary for utilizing and changing the research in wheat management that are eco-friendly and at the same time can increase the productivity of crops using technologies. Also, the usage of herbicides can
cause a risk in potential water contamination and food. Moreover, the use of indiscrimination of herbicide affects the environment where biology is predisposed undesirably [1]. The quality of food can be increased with the help of using herbicides safely, and for this research, we used the tool known as wavelet analysis that can detect the wheat and crops same as Db4 wavelet that has been used for the extraction of wheat and other crops texture features [2].
Since wheat and crops productivity poses a vital biological constraint such as the extensive use of herbicides, wheat control will result in the appearance of wheat conflict to herbicides. In addition, the environmental problems also occur therefore we need to find out alternative ecological wheat management in cropping system [4].
Manipulating wheat-suppressing facility of crop varieties is a potential and promising option for wheat control where different plant collections, including wheat and rice crops and also a few of crop varieties with wheat suppression effects, are identified. In a natural interference of the crop plants with wheat’s, these crop varieties are very much competitive in the field against wheat particularly a crop in the system where there will be used a different kind of wheat. Also, the suppression effect of wheat and its joint action of a competitive factor and ground interactions also affect the performance of crop as comparing above grounded interactions [5].
Recently, artificial neural networks (ANN) had become a popular method used in agricultural. Most of the ANN method was designed and proposed based on the performance of ANN in achieving higher efficiency and vision in cost and production. Multilayer perceptron neural networks technique was used to identifying wheat root and other crops for identification of the specific area of spraying hence decreased the amount of herbicide utilized. Moreover, multilayer perceptron neural networks technique also were used to identify onion and wheat root and specific area for spraying and also the number of herbicides which decreased and utilized [6]–[8].
In 2017, Kersten et. al. [9] described the main advantage of their method and it showed that the active targeting and identification of infected area and the performance of this method is also justified by the partial experiment which provides very much sufficient evidence regarding saving of resources like herbicides. Voisin in 2016 proposed a system that dealt with sensors of ground-based that could be used for assessing wheat levels and identifying wheat in a crop. Here the underlying principles, limitations, and performance of the current system were discussed [10].
Wenzl proposed one machine for new learning mechanism was introduced for distinguishing wheat and crop in account with their reflectance differences. The proposed mechanism introduced an approach for learning through a combination of incremental class augmentation and novelty detection. Classifiers of one class had been constructed by neural networks which provide basics for the novelty detection. Mahayuddin et al. support the effectiveness of the machine by comparing it with a control system in multirotor unmanned aerial vehicle navigation [11]. For the class SOM (self-organizing map) and one-class MOG (mixture of Gaussians) one-classifiers, the best results were obtained for active learning when compared with the auto-encoder network and one-class support vector machines. The success rate for MOG was 98% from 31% which was experimented in various species, the same results are shown at 94% from 53% for SOM.
According to Lahmiri and Boukadoum a sensor node that used for security and control where those methods also used for wheat deduction system and crop monitoring [12].
According to Momtahan [13] in 2016, two sets of the wheat field were selected from the collection of wheat and sensor node was used for their monitoring. Spherical-shaped 40 to 80 samples with varying wheat components of two different sets were evaluated at different separate dates. The sensor node was adjusted at a specific angle to monitor the height of wheat, and narrow wheat during this monitoring are removed, and the analytical technique was used. The dissimilarity was measured between wheat rode and wheat zones along with dry crop with the simple picture which is selected through the machine. RGB images were taken due to removing assessing area that covered by wheat and other product. Analytical techniques based on numerous regressions were used to control the correlation between ultrasonic readings and the coverage of wheat and crops. In the end, wheat-ridden and normal samples were observed at the differences in heights.
The image and the employment of the processing algorithm used in wheat and crops are distinguished from one another by utilizing wavelet analysis. Wavelet transform was used for analyzing the textural property of wheat and crop images. Whereas, the texture feature is mined from the data with a different parameter like energy, entropy, inertia contrast homogeneity with the help of the herbicides which were sprayed through robotic. Where the wheat position was based on organization and the plague-ridden areas was accessed [14].
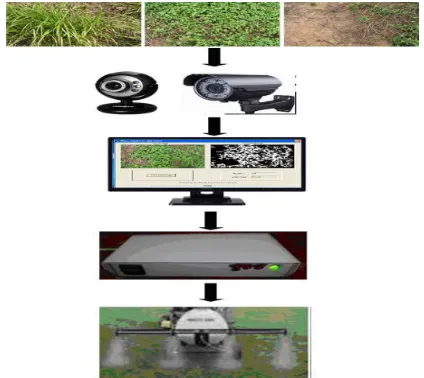
Wheatfield is selected for the collection of wheat and the sensor node is used for their monitoring. Spherical-shaped 40 to 80 samples with varying wheat components of two different sets were evaluated at different separate dates. The sensor node is adjusted at a specific angle to monitor the height of wheat, and narrow wheat during his grass are removed, and the analytical technique is used. The dissimilarity was measured between wheat is ridden and wheat zones along with dry crop with the simple. RGB images are taken due to removing assessing the area covered by wheat and other product. Analytical techniques based on numerous regressions were used to control the correlation between ultrasonic readings and the coverage of wheat and crops [15]. The real-time machine for wheat is shown in Figure 1.
Wheat is kind of crop which can affect grow in subtropical climate and wheat is one most reliable source of carbohydrate in the world . Wheat also contains protein minerals and vitamins [16]. All picture with longitude and altitude information were mosaicked and processed with the help of NDVI software [17].
Therefore, the main objectives of this paper are to design a methodology that proposes an algorithm which can identify the location and recognize the presence of wheat and as well as can distinguish between the narrow wheat and broad wheat.
II. MATERIAL AND METHOD
In this section, we discuss data collection area selection, weight, and height of the wheat. The verified wheat was randomly selected at various wheat fields. The data were collected from different week and days, different area and then they are classified into different place. Whereas, the frequency (F) is used to find the survey area to find the wheat by the real system. Figure 1 shows the real time machine. 1
100
Py
n
K
×
(1) WhereK
pare the wheat in the areay
1and the present of wheat and yo is the other plant and n the number are searching by the real system.The uniform (U) is designed to find in percentage:
1 1 n m P ij
n
MX
U
m
=
×
(2)Where
U
p up is the uniform wheat in the field and,i
X
is the ununiform product is the field total will beN
M
=
and D = is the density each product in the fields.4
PI ZjD
m
=
+
(3)Where
D
PIis the density of the field and can be express as number /m2, NZ and j are the numbers of the product.4 1 KI N FD K
K D
M
n
+=
(4)Where
MFD
K, is the mean density of the filed used. The above four education is used to find the wheat at different level [16].K PI
P
k
U
D
MFD
AI
oduct
=
=
+
+
Pr
(5)After the selection of an area in the field the following wheat data are collected as shown in Table 1.
TABLEI
DATA COLLECTION FOR 6WEEK
Image Wheat
Density
Broad wheat Density
Type
1 60.94 61.08 Broad wheat
2 56.23 64 Narrow Wheat
3 37.52 48.29 Broad wheat
4 44.04 48.29 Broad wheat
5 56.47 67.45 Broad wheat
6 60.56 45.55 Broad wheat
7 56.67 34.56 Broad wheat
8 44.67 78.67 Narrow Wheat
9 20.54 56.67 Narrow Wheat
10 44.56 67.67 Narrow Wheat
11 56.28 68.90 Narrow Wheat
12 35.29 78.56 Narrow Wheat
13 42.56 45.67 Narrow Wheat
14 44.67 67.67 Broad wheat 15 47.78 76.45 Broad wheat 16 67.56 56.78 Broad wheat 17 45.67 67.67 Broad wheat 18 56.66 78.56 Broad wheat 19 56.55 56.78 Broad wheat 20 67.75 67.78 Broad wheat 21 78.78 67.56 Broad wheat 22 60.94 61.08 Broad wheat
23 56.23 64.00 Narrow Wheat
24 37.52 48.29 Broad wheat 25 44.04 48.29 Broad wheat 26 56.47 67.45 Broad wheat 27 66.56 45.55 Broad wheat 28 56.67 34.56 Broad wheat
29 44.67 78.67 Narrow Wheat
30 26.54 56.67 Narrow Wheat
31 44.56 66.67 Narrow Wheat
32 56.28 68.90 Narrow Wheat
34 47.56 45.67 Narrow Wheat
35 40.67 67.67 Broad wheat 36 47.78 76.45 Broad wheat 37 67.56 50.78 Broad wheat 38 45.67 67.67 Broad wheat 39 56.66 78.56 Broad wheat 40 56.55 56.78 Broad wheat 41 67.75 67.78 Broad wheat 42 78.78 67.56 Broad wheat 43 60.94 61.08 Broad wheat
44 56.23 64 Narrow Wheat
45 37.52 48.29 Broad wheat 46 44.04 48.29 Broad wheat 47 56.47 67.45 Broad wheat 48 60.56 45.55 Broad wheat 49 56.67 34.56 Broad wheat
50 44.67 78.67 Narrow Wheat
51 20.54 58.67 Narrow Wheat
52 44.56 67.67 Narrow Wheat
53 56.28 69.90 Narrow Wheat
54 35.29 78.56 Narrow Wheat
55 42.56 40.67 Narrow Wheat
56 40.67 67.67 Broad wheat 57 47.78 70.45 Broad wheat 58 67.56 56.78 Broad wheat 59 45.67 67.67 Broad wheat 60 56.66 78.56 Broad wheat 61 56.55 56.78 Broad wheat 62 67.75 60.78 Broad wheat 63 78.78 67.56 Broad wheat 64 60.94 61.08 Broad wheat
65 58.23 64 Narrow Wheat
66 39.52 48.29 Broad wheat 67 44.04 67.29 Broad wheat 69 56.47 67.45 Broad wheat 70 60.56 45.55 Broad wheat 71 56.67 34.56 Broad wheat
72 67.67 78.67 Narrow Wheat
73 20.54 56.67 Narrow Wheat
74 44.56 67.67 Narrow Wheat
75 56.28 68.90 Narrow Wheat
76 67.29 78.56 Narrow Wheat
77 42.56 45.67 Narrow Wheat
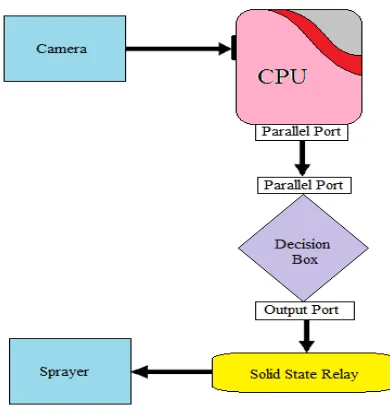
Table 1 shows the data which are collected in the different week with the help of real-time machine. Due to the above manner images and their size are remained the same with high quality of the protruding portion of the sprayer captured. In Figure 2, the diagram demonstrated the images are related to the CPU, and decision box are connected through the parallel port and used for turning off the pump purely on based of on the CPU processing over kind of images.
Fig.2: Conceptual flow chart
Figure 2 illustrates the image relayed to CPU, and then decision box makes a decision make off the pump or on because it connected to the CPU through parallel ports .with the help of it CPU process images.
Microsoft Visual C++ 6.0 is used as the software to develop the system. Moreover, the GUI design is with the resolution of 240 pixels of the image by rows and 320 pixels by columns, the standard and mean deviation between the altered image and the actual image is calculated. Figure 2 showed the wheat recognition system for real-time and demonstrated their persistence in recognizing the narrow and broad wheat by implementing the algorithm in the morphological operation.
The classification algorithm is given as follows:
If (Broad Wheat Percentage >=55 and Wheat Percentage>=40) or (Broad Wheat Percentage>60)
Classify as “Broad Wheat” Else If (Wheat Percentage>=30) Classify as “Narrow”
Else
Classify as “No or Little” End
Where 55, 40 and 60 are threshold values that were taken from previous literature [12]–[14]. In the start of the image preprocessing operation, the input image is decomposed into red, green and blue components to create a binary image using the following transformation.
If G>R and G>B and G>115 then PIMG = 1
Else
PIMG = 0 End if
Where R, G, and B are the red, green and blue component sand PIMG is the processed binary image. The resulting binary image will have wheat in bright pixels and background in dark pixels. Next technique is classification based online based segmentation wherein this technique different image of wheat scanned horizontally and vertically to find out their location. Their length and height measure image. In broad wheat, the length and height are more than other wheat in the field. Narrow wheat the case change in here the length and height are small then other wheat. After collecting the data, we classify narrow wheat from broad wheat and get the percentage of the total fields [18],[19].
Next, the output variable in is this case is a scalar value, the threshold to be used in the banalization whose value ranges from 0 to 1. However, in the real system, the output value is a W. The adaptation, in this case, is straight forward. The output value will be a weighted average of the threshold of the k neighbors selected in the previous step. The weight assigned to the threshold of a given neighboring histogram (hp with p = 1, k) will be inversely proportional to the distance between itself and the W whose threshold is unknown (hx) equation as follows:
,
( (
)
)
p
W
=
d hp hx
+
w
(6)
,
)
( (
)
p
W
=
d hp hx
+
w
(7) 1
1 KP
T
X WP
PA
T
=
=(8) Where Pt is the threshold value of the, neighboring hp. In order to avoid infinite values caused by zero distances, the value of the threshold for a given histogram x will be estimated as follows [18].
III.RESULTS AND DISCUSSION
This section will discuss further the next process once the data were collected. Next, the process of selecting the threshold and wheat were classified into a different category with the help of the given program:
Total images= 80 Failure in = 100 So 80-10=70
Now 10/80*100=80%(Accuracy)
Without considering ambiguous images total =80
Error occurred in=10 80-10=70
10/80*100=95%(Accuracy
According to the above algorithm, the result is almost 94 % accurate in the selection of a different kind of wheat. The result is then generated and shown below in graphic form.
Fig. 3: Broad Wheat Type for Threshold 29
Figure 3 shows the selection of broad wheat in the specific area. According to the result, the threshold is 29% at each area which means that every 29 wheat is there will be narrow wheat. In Figure 4, the narrow wheat is 61% as shown in the threshold. This means that at each 61 narrow wheat there will be one broad wheat in that specific area. According to Table 2, 96.3% of that area is narrow wheats which means that in a specific area there are 96.3% wheat are the same size and shape.
Fig. 4: Narrow Weed Type for Threshold 61
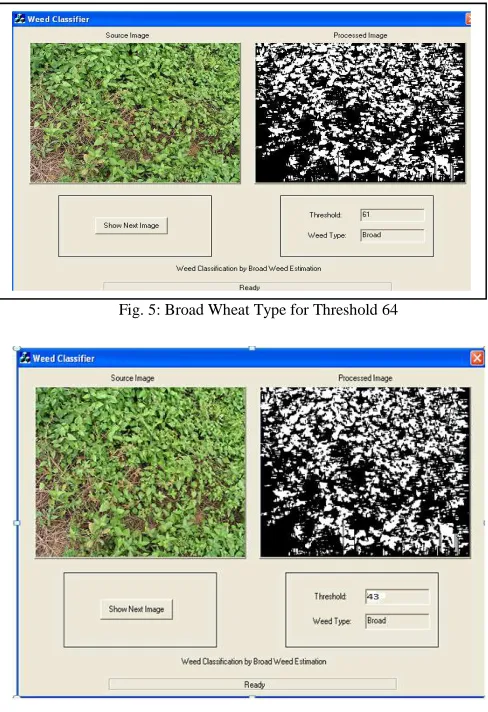
In Figure 5, the black section shows the result after the processing. According to the result, 64% are a threshold which means that after each 64 broad wheat we found 1 narrow wheat. From Table 2 it shows that the result is 95% indicate broad wheat in the specific area which is selected for the process.
Fig. 5: Broad Wheat Type for Threshold 64
Fig. 6: Narrow Weed Type for Threshold 61
In Figure 6 the narrow wheat is 43% as shown in the threshold. This means that at each 43 narrow wheat there will be 1 broad wheat in that specific area. According to Table 2, 89% of that area is narrow wheats which means that in a specific area there are 89% wheat are the same size and shape.
Figure 6 shows that that the green clour is before process, and the black color is after process, and according to the result the threshold is 43 where after each 43 narrow wheat there will be 1 broad wheat hence according to the Table 2, almost 89 % of wheat in that specific area is broad wheat which is selected for process.
TABLEII RESULT AFTER PROCESSING
Table 2 contains the simulation results. According to the result, narrow wheats is 89% and 95.2%, and broad wheat are 84.5% and 92% so overall result we get after multiplying Type of wheat Threshold value Results in percentage
Broad Wheats 1 29 84.5%
Broad Wheats 2 64 92.0%
Narrow Wheats 1 47 95.2%
Narrow wheat 5 43 89%
these number with a threshold is 94% it means that the proposed design system is working accurately.
IV.CONCLUSION
The simulation results had shown that the classification through this system could be proved very effective as far as the images are concerned which contain only one prevalent wheat type. However, it is very difficult to categorize the wheat types which contained more than one prominent, so extensive research is required for categorizing such crop areas. A promising method for achieving that would be to divide wheat to any given population into smaller ones in order to diminish the possibility of there being more than one species of wheat in these smaller components. Moreover, based on the above scenario, this research had designed a real-time system which used for classification of two kinds of wheat (narrow and broad wheat). According to the result, almost 94% of the proposed system work appropriately in finding the result, but there is still some works need to be done for improvement in getting an outstanding result for classification of wheat. Overall, as compared to pervious work the result demonstrates an improvent of 2%. This work can be further explored for improving classification with the help of real-time system by introducing an improvement on the algorithms and real-time system on different wheat plant classification.
ACKNOWLEDGMENT
The authors would like to thank Universiti Tun Hussein Onn Malaysia (UTHM) Ministry of Higher Education (MOHE) Malaysia for financially supporting this Research under Trans-disciplinary Research Grant Scheme (TRGS) vote no. T003.
REFERENCES
[1] Mabe, L. K., & Oladele, O. I. (2016). Application of Information Communication Technologies for Agricultural Development through Extension Services: A Review. Information Technology Integration for Socio-Economic Development, 52.
[2] Vibhute, A. S. (2014). An Image Processing Approach for Fertilizer and Pesticide Management.
[3] Midtiby, H. S., Åstrand, B., Jørgensen, O., & Jørgensen, R. N. (2016). Upper limit for context–based crop classification in robotic weeding applications. Biosystems Engineering, 146, 183-192.
[4] Zimdahl, R. L. (2013). Fundamentals of weed science. Academic press.
[5] Zou, C., Wang, P., & Xu, Y. (2016). Bulked sample analysis in genetics, genomics and crop improvement. Plant biotechnology journal, 14(10), 1941-1955.
[6] Balasubramanian, P., & Ardil, C. (2007). Compact Binary Tree Representation of Logic Function with Enhanced Throughput. Requirements Engineering, 125, 4364. 6666.
[7] Chiroma, H., Abdul Kareem, S., Khan, A., Nawi, N.M., YaU Gital, A., Shuib, L., Abu Bakar, A. I., Rahman, M. Z., Herawan, T.(2015). Global warming: Predicting OPEC carbon dioxide emissions from petroleum consumption using neural network and hybrid cuckoo search algorithm. PloS One, 10(8).
[8] Nawi, N.M., Khan, A., Rehman, M. Z., Aziz, M. A., Abawajy, J. H., Herawat, T. (2014). An accelerated particle swarm optimization based Levenberg marquardt back propagation algorithm. Lecture Notes in Computer Science (including subseries Lecture Notes in Artificial Intelligence and Lecture Notes in Bioinformatics)Volume 8835, 2014, Pages 245-253
[9] Kersten, W. C., Long, N. H., Diehl, J. C., Crul, M. R., & Van Engelen, J. M. (2017). Comparing Performance of Biomass Gasifier Stoves: Influence of a Multi-Context Approach. Sustainability, 9(7), 1140.
[10] Voisin, N., Leung, L. Y. R., & Hejazi, M. I. (2016). Drivers of Change in Managed Water Resources: Modeling the Impacts of Climate and Socioeconomic Changes Using the US Midwest as a Case Study. Terrestrial Water Cycle and Climate Change: Natural and Human-Induced Impacts, 221, 169.
[11] Mahayuddin, Z. R., Jais, H. M., & Arshad, H. (2017). Comparison of Human Pilot (Remote) Control Systems in Multirotor Unmanned Aerial Vehicle Navigation. International Journal on Advanced Science, Engineering and Information Technology, 7(1), 132-138. [12] Lahmiri, S., & Boukadoum, M. (2014). Automated detection of
circinate exudates in retina digital images using empirical mode decomposition and the entropy and uniformity of the intrinsic mode functions. Biomedical Engineering/Biomedizinische Technik, 59(4), 357-366.121212
[13] Momtahan, N. (2016). Extracellular Matrix from Whole Porcine Heart Decellularization for Cardiac Tissue Engineering (Doctoral dissertation, Brigham Young University).
[14] Schowengerdt, R. A. (2006). Remote sensing: models and methods for image processing. Academic press.
[15] Cheng, X. (2004). Hyperspectral imaging and pattern recognition technologies for real time fruit safety and quality inspection (Doctoral dissertation).
[16] Azima, F., Novelina, N., & Pane, R. S. (2013). The Physical and Chemical Properties of Wheat Flour in Some Wheat (Triticum spp.) Varieties Grown in West Sumatera. International Journal on Advanced Science, Engineering and Information Technology, 3(4), 303-308.
[17] Malczewski, J. (2004). GIS-based land-use suitability analysis: a critical overview. Progress in planning, 62(1), 3-65.
[18] Arroyo, J., Guijarro, M., & Pajares, G. (2016). An instance-based learning approach for thresholding in crop images under different outdoor conditions. Computers and Electronics in Agriculture, 127, 669-679.