Molar Refractivity and Refractive Index of Binary System
at Different Temperatures
Sadhna Shukla1, Ghan Shyam Gupta1 and R.K.Shukla2*
1Department of Physical Science,
Faculty of Science & Environment,M.G.C.G. Vishwavidyalaya, Chitrakoot, Satna, INDIA.
1 2Department of Chemistry,
V.S.S.D. College, Kanpur-208002, INDIA. email: [email protected]
(Received on: February 14, 2018)
ABSTRACT
Densities and refractive indices were measured for the binary liquid mixtures formed by benzyl alcohol + benzene at (T=298.15, 303.15, 308.15 and 313.15) K and atmospheric pressure over the whole concentration range. Lorentz-Lorentz mixing rule, Ramaswamy and Anbananthan model and model devised by Glinski were used to study the refractive index and molar refractivity. These results have been discussed to study the type of mixing behaviour between the mixing molecules. The measured data were fitted to the Redlich-Kister polynomial relation to estimate the binary coefficients and standard errors. Furthermore, McAllister multi body interaction model is used to correlate the binary refractive index with the experimental findings. It is observed that molar refractivity, molecular interaction and association constant can be better understood from these models.
Keywords: Binary liquid, refractive index, Lorentz, refractivity, Redlich, McAllister.
INTRODUCTION
The knowledge of refractive index property at different temperatures of liquid mixtures is an important step for their structure and characterization. Along with other thermodynamic data, refractive index values are also useful for practical purposes in engineering calculations. Refractive index is useful to assess purity of substances, to calculate the molecular electronic polarizibility1, to estimate the boiling point with Meissner’s2 method
or to estimate the other thermodynamic properties. In recent past, several workers3-7 have
index and to check the validity of these mixing rules. The studied systems have industrial utility; the mixing behaviour of benzyl alcohol is interesting due to presence of hydroxyl group coupled with benzene. In this work, we present the experimental data on density and refractive index of binary liquid mixtures for benzyl alcohol with benzene at (T= 298.15, 303.15, 308.15 and 313.15) K and atmospheric pressure over the entire composition range. These data were analyzed in terms of Lorentz-Lorentz mixing rule8, model of Ramaswami and Anbananthan9
and model suggested by Glinski10. Associated models are based on the association constant as
an adjustable parameter where as non-associated model is based on the additivity of liquids. In the present work, liquid components of weak interacting ability have been chosen. Using these experimental data, deviation in molar refraction (∆R) has been studied and fitted to a Redlich-Kister type polynomial equation11 to derive binary coefficients and estimated standard
errors. An attempt has also been made to correlate the experimental properties with the McAllister equation12.
EXPERIMENTAL SECTION
Materials
High purity and AR grade samples of benzyl alcohol and benzene used in this experiment were obtained from Merck Co. Inc., Germany and purified by distillation in which the middle fraction was collected. The purity of chemicals used was confirmed by comparing the densities and refractive indices with those reported in the literature as shown in Table 1.
Apparatus and Procedure
The densities of the pure components and their mixtures were measured with the bi capillary pyknometer with an accuracy of ± 5.0. 10-4 g.cm-3. The liquid mixtures were prepared
by mass in an air tight stopped bottle using an electronic balance model SHIMADZUAX-200 accurate to within ±0.1mg.Refractive index was measured using a thermostatically controlled Abbe refractometer.
THEORETICAL
Ramswami and Anbananthan9 proposed the model based on the assumption of
linearity of acoustic impedance with the mole fraction of components. Further Glinski10
assumed that when solute is added to solvent, the molecules interact according to the equilibrium as;
A+B = AB (1) and the association constant Kas can be defined as;
(2) where A is amount of solvent and B is amount of solute in the liquid mixture. By applying the condition of linearity with composition
nobs = xA nA + xAB nAB (3)
[ ] [ ][ ]
as
AB K
A B
where xA, xAB, nA and nAB are the mole fraction of A, mole fraction of associate AB, refractive
index of A and refractive index of associate AB respectively. The component AB cannot be obtained in its pure form. Following simplifications have been made, firstly, concentration term should be replaced by activities for concentrated solution and second, there are also molecules of non associated components in the liquid mixture. The eq (3) takes the form, nobs = [xA nA + xB nB + xAB nAB] (4)
Now, assuming any value of refractive index in the pure component, it is possible to compare the refractive indices calculated using eq (4) with the experimental values. On changing both the adjustable parameters Kas and nAB gradually, one can get different values of
the sum of squares of deviations,
S =∑(nobs - ncal) 2 (5)
The minimum value of S can be obtained theoretically by a pair of the fitted parameters. But we found that for some Kas and nas, the value of S is high and changes rapidly,
and for others, it is low and changes slowly when changing the fitted parameters. In such cases, the value of nAB should not be much lower than the lowest observed refractive index of the
system or much higher than the highest one. Quantitatively, it should be reasonable to accept the pair of adjustable parameters Kas and nAB which has the physical sense and which
reproduces the experimental refractive indices satisfactorily.
Glinski10 suggested that experimental results with significantly well accuracy can be
produced from the following equation as:
1 2 2 1 2 1
n
n
n
n
n
cal
(6) where ncal is the calculated refractive index ,
1,
2 are the volume fraction of component 1and 2 and n1 n2 are the refractive index of pure components.
Lorentz-Lorentz (L-L) relation has widest application during the evaluation of refractive indices of mixture and density of pure components as well as density of the mixture and represented in terms of specific refraction as:
2 2 2 2 2 1 2 1 2 1 2 2
2
1
2
1
2
1
n
n
n
n
n
n
m m (7) here nm, n1, n2 are the refractive indices of mixture and pure components, 1,2 respectively and
1,
2 are the volume fractions of pure components.RESULTS AND DISCUSSION
Table 1 presents the comparison of experimental densities and refractive indices of benzene, and benzyl alcohol with literature values at 298.15, 303.15, 308.15 and 313.15 K. Values of mixture for benzene + benzyl alcohol over the whole composition range at four temperatures were recorded in Table 5.
is that these liquids have poor tendency to form dimmers. Calculations were performed using a computer program which allows easily both the adjustable parameters simultaneously or the parameters were changed, manually.
The mixing function, ∆R was represented mathematically by the Redlich-Kister equation11 for correlating the experimental data as:
(8) where y refers to ∆R, x1 is the mole fraction and Ai is the coefficients. The values of
coefficients Ai were determined by a multiple regression analysis based on the least squares
method and are summarized along with the standard deviations between the experimental and fitted values of the respective function in Table 2. For the case, the
values lie between 3.35 x 10⁻⁴ to 54.28 x 10⁻⁴ and the largest
value corresponds at 308.15 K. Molar refractivity wasobtained from refractive index data according to following expression:
R= [n2 -1/ n2+2] M/ ρ (9)
where M is the mean molecular weight of the mixture and ρ is the mixture density.
The molar refractivity deviation function shown in figures has been calculated by the following expression:
∆R= R- Ф1R1- Ф2R2 (10)
where Ф1and Ф2 are volume fractions of the components 1 and 2 respectively which is
obtained by the relation13-15 as;
Фi = (∑xivi / ∑2xivi). There is no general rule that states how
to calculate a refractivity function. Konti et al.16 reported deviations in molar refractivity with
volume fraction referring to the Lorentz-Lorentz mixing rules. The estimated McAllister parameters of the refractive index equations and the standard deviations,
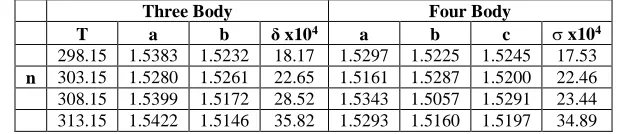
, between the calculated and experimental values are given in Table 3. It is observed that the four body model of the McAllister equation correlated the refractive index of the mixture to a significantly higher degree of accuracy for all of the systems than does the three body model. Furthermore, the values of the McAllister parameters have shown a decreasing tendency with rise in temperature. Generally, McAllister’s models are adequate in correlation for those systems as evidenced by small deviations.The minimum and maximum average deviation (∆nAV) in refractive index for all the
systems are found to be 9 X 10⁻⁴ at 298.15 K and 274.4 X 10⁻⁴ at 308.15 K and average percent
deviation (%∆n AV) are 0.06 at 298.15K and 1.82 at 308.15 K as indicated in Table 4. With the
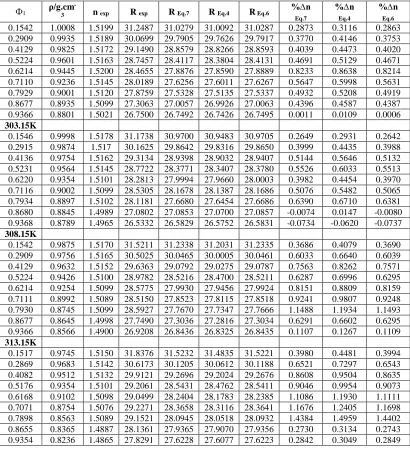
increase of volume fraction (Ф), the values of refractive index obtained from all the models decrease at all temperatures except in few places. Results of molar refractivity computed from eq 13 for the entire systems show regular trend except in few places as shown in Table 5.
The results of deviation in molar refraction, ∆R, plotted as a function of Фi of benzene + benzyl alcohol mixtures at 298.15, 303.15, 308.15 and 313.15 K are displayed in the Figure1 which indicate negative values at all temperatures. In all the cases, theoretical molar refractivity computed from all the models agree well within the experimental precision. The trend in all the figures is almost similar and negative. Molar refraction increases with
1 1 1
0
(1
)
(2
1)
p
i i
i
y
x
x
A
x
molecular weight for all the systems. Density and refractive index depend on molecular weight and nature of solution and values decrease with increase of temperature as evidenced in Table 5. Very close values of McAllister three and four body interaction models with the experimental data confirms the success of our experimental findings.
Table 1 Comparison of Density and Refractive index with literature date for pure components at 298.15, 303.15, 308.15 and 313.15 K
Components T/K V/ cm3 mole-1 ρ
exp /g.cm3 ρlit / g.cm3 nexp nlit
Benzene 298.15 89.3196 0.8732 0.8736b 1.4984 1.49792b
303.15 89.9366 0.8680 0.8683b 1.4941 1.49486a
308.15 90.7306 0.8653 - 1.4801 - 313.15 91.1329 0.8575 0.8576b 1.4785 -
Benzyl alcohol 298.15 103.8210 1.0412 1.0413b 1.5378 1.53837b
303.15 104.2413 1.0376 1.0376b 1.5362 -
308.15 105.4509 1.0372 - 1.5340 - 313.15 107.9780 1.0366 - 1.5317 - a Ref 17, b Ref 18
Table 2 Coefficients of the Redlich-Kister Equation and Standard Deviations () for Molar Refractivity for benzene+benzyl alcohol Liquid Mixtures at Various Temperatures
T A0 A1 A2 A3 x104
∆R 298.15 0.0335 0.0682 0.0252 -0.134 20.59 303.15 0.0357 0.0533 -0.0058 -0.13114 28.94 308.15 0.0491 0.0913 0.0456 -0.15151 54.28 313.15 0.0632 0.0900 0.0274 -0.12614 41.63
Table 3 Parameters of mcallister Three body and Four body Interaction Model and Standard Deviations () for Refractive index of benzene + benzyl alcohol Liquid Mixtures at Various Temperatures
Three Body Four Body
T a b δ x104 a b c x104
298.15 1.5383 1.5232 18.17 1.5297 1.5225 1.5245 17.53 n 303.15 1.5280 1.5261 22.65 1.5161 1.5287 1.5200 22.46 308.15 1.5399 1.5172 28.52 1.5343 1.5057 1.5291 23.44 313.15 1.5422 1.5146 35.82 1.5293 1.5160 1.5197 34.89
Table 4 Comparison of Average Deviations and Average Percent Deviations for benzene + benzyl alcohol at various Temperatures
Temperature nav x10
4
(eq.4)
nav x104
(eq.7)
nav x104
(eq.6)
%
nav
(eq.7)
%nav
(eq.4)
%nav
(eq.6)
298.15 69.0930 65.0193 64.8058 0.42 0.46 0.42
303.15 61.9600 56.4439 56.3326 0.37 0.40 0.37
308.15 108.5830 100.4258 10.0511 0.66 0.71 0.66
Table 5 Volume fraction (Ф), Experimental Densities (ρ), Observed Molar Refractivity (RExp),
Theoretical Molar Refractivity, (RTheo) and Percent Refractive Index Deviation (%∆n) obtained
from different Models for benzene + benzyl alcohol Binary Liquid Mixtures at various temperatures.
T=298.15K
Ф1 ρ/g.cm
-3 n exp R exp R Eq.7 R Eq.4 R Eq.6
%∆n
Eq.7
%∆n
Eq.4
%∆n
Eq.6
0.1542 1.0008 1.5199 31.2487 31.0279 31.0092 31.0287 0.2873 0.3116 0.2863 0.2909 0.9935 1.5189 30.0699 29.7905 29.7626 29.7917 0.3770 0.4146 0.3753 0.4129 0.9825 1.5172 29.1490 28.8579 28.8266 28.8593 0.4039 0.4473 0.4020 0.5224 0.9601 1.5163 28.7457 28.4117 28.3804 28.4131 0.4691 0.5129 0.4671 0.6214 0.9445 1.5200 28.4655 27.8876 27.8590 27.8889 0.8233 0.8638 0.8214 0.7110 0.9236 1.5145 28.0189 27.6256 27.6011 27.6267 0.5647 0.5998 0.5631 0.7929 0.9001 1.5120 27.8759 27.5328 27.5135 27.5337 0.4932 0.5208 0.4919 0.8677 0.8935 1.5099 27.3063 27.0057 26.9926 27.0063 0.4396 0.4587 0.4387 0.9366 0.8801 1.5021 26.7500 26.7492 26.7426 26.7495 0.0011 0.0109 0.0006 303.15K
0.1546 0.9998 1.5178 31.1738 30.9700 30.9483 30.9705 0.2649 0.2931 0.2642 0.2915 0.9874 1.517 30.1625 29.8642 29.8316 29.8650 0.3999 0.4435 0.3988 0.4136 0.9754 1.5162 29.3134 28.9398 28.9032 28.9407 0.5144 0.5646 0.5132 0.5231 0.9564 1.5145 28.7722 28.3771 28.3407 28.3780 0.5526 0.6033 0.5513 0.6220 0.9354 1.5101 28.2813 27.9994 27.9660 28.0003 0.3982 0.4454 0.3970 0.7116 0.9002 1.5099 28.5305 28.1678 28.1387 28.1686 0.5076 0.5482 0.5065 0.7934 0.8897 1.5102 28.1181 27.6680 27.6454 27.6686 0.6390 0.6710 0.6381 0.8680 0.8845 1.4989 27.0802 27.0853 27.0700 27.0857 -0.0074 0.0147 -0.0080 0.9368 0.8789 1.4965 26.5332 26.5829 26.5752 26.5831 -0.0734 -0.0620 -0.0737 308.15K
0.1542 0.9875 1.5170 31.5211 31.2338 31.2031 31.2335 0.3686 0.4079 0.3690 0.2909 0.9756 1.5165 30.5025 30.0465 30.0005 30.0461 0.6033 0.6640 0.6039 0.4129 0.9632 1.5152 29.6363 29.0792 29.0275 29.0787 0.7563 0.8262 0.7571 0.5224 0.9426 1.5100 28.9782 28.5216 28.4700 28.5211 0.6287 0.6996 0.6295 0.6214 0.9254 1.5099 28.5775 27.9930 27.9456 27.9924 0.8151 0.8809 0.8159 0.7111 0.8992 1.5089 28.5150 27.8523 27.8115 27.8518 0.9241 0.9807 0.9248 0.7930 0.8745 1.5099 28.5927 27.7670 27.7347 27.7666 1.1488 1.1934 1.1493 0.8677 0.8645 1.4998 27.7490 27.3036 27.2816 27.3034 0.6291 0.6602 0.6295 0.9366 0.8566 1.4900 26.9208 26.8436 26.8325 26.8435 0.1107 0.1267 0.1109 313.15K
Figure 1 Plot of molar refractivity deviation, ∆R, with volume fraction, Ф1 for Ф benzene+ (1-Ф)
benzylalcohol at 298.15, 303.15, 308.15 and 313.15 K: ●Lorentz-Lorentz mixing rule (Eq 7), ■ , Ramaswami Anbananthan model (Eq. 4), ▲, model devised by Glinski (Eq.6)
CONCLUSION
REFERENCES
1. L.B. Kier, L.H. Hall, Molecular Connectivity in Chemistry and Drug Research, Sand Diego, Academic Press, (1976).
2. C.E.Rechsteiner,Boiling Point, in hand book of Chemical Property Estimation, Lyman, W.J., Reehl, W.F., Rosenblatt, D.H., (Eds.), American Chemical Society, Washington (1990).
3. S. Sharma, P.B. Patel, R.S. Patel, Vora, J. J. Elec. J. Chem. 4, 343-349 (2007). 4. R. Mehra,. Proc. Indian Acad. Sci. 115, 147-154 (2003).
5. M. Fermeglia, G. Torriano, J.Chem. Eng. Data. 44, 965-969 (1999).
6. J.N. Nayak, M.I., Toti, U.S. Aralaguppi, T.M. Amina bhavi, J. Chem. Eng. Data. 48, 1483-1488 (2003).
7. J.D. Pandey, R.K. Shukla, R.D. Rai, A.K. Shukla, Indian J. Pure & Appl. Phys. 30, 94-97 (1992).
8. A.Z. Tasic, B.D.,Diordjevic, D.K. Grozdanic, N Radojkovic, J. Chem. Eng. Data. 37, 310-313 (1992).
9. R.K. Shukla, N Awasthi, A. Kumar, A.Shukla, V.K. Pandey, J. Molliq. Liq. 158, 131-138 (2011).
10. J. Glinski, J. Chem. Phys. 118, 2301-2307 (2003).
11. O. Redlich, A.T. Kister, Ind. Eng. Chem. 40, 345-348 (1948). 12. R.A. McAllister, AIChE J. 6, 427-431 (1960).
13. M.I. Araguppi, C.V. Jadar, T.M. Aminabhavi, J. Chem. Eng. Data. 44, 441-445 (1999). 14. M.I. Araguppi, C.V. Jadar, T.M. Aminabhavi, J. Chem. Eng. Data. 44, 435-440 (1990). 15. M.I. Araguppi, C.V. Jadar, T.M. Aminabhavi, J. Chem. Eng. Data. 44, 446-450 (1999). 16. A. Konti, G. Moumouzias, G. Ritzoulis, J. Chem. Eng. Data. 42, 614-618 (1997).
17. J. Timmermans, Physico-Chemical Constants of Pure Organic Compounds. Elsevier, New York (1950).