B. Siddartha*
Assistant Professor, Malla Reddy College of Pharmacy, Maisammaguda, Dhulapally, Secunderabad-500014.
Telangana State, India.
E-mail id: [email protected] Address for correspondence
B. Siddartha et al. / JGTPS/5(3)-(2014) 1979–1988
ESTIMATION AND VALIDATION FOR DETERMINATION OF ROSUVASTATIN IN
HUMAN PLASMA BY LC/MS/MS METHOD
INTRODUCTION
Rosuvastatin is an antilipemic agent that competitively inhibits hydroxymethylglutaryl-coenzyme A (HMG-CoA) reductase. Rosuvastatin, chemically it is (3R, 5S, 6E)-7-[4-(4-fluorophenyl)-2-(N-methylmethanesulfonamido)-6-(propan-2-yl) pyrimidin-5-yl]-3, 5-dihydroxyhept-6-enoic acid. The chemical formula is C22H28FN3O6S. The molecular weight is 481.538g/mol. Rosuvastatin is a competitive inhibitor of HMG-CoA reductase. HMG-CoA reductase catalyzes the conversion of HMG-CoA to mevalonate, an early rate-limiting step in cholesterol biosynthesis. Decreased hepatic cholesterol concentrations stimulate the upregulation of hepatic low density lipoprotein (LDL) receptors which increases hepatic uptake of LDL. Rosuvastatin also inhibits hepatic synthesis of very low density lipoprotein (VLDL). The overall effect is a decrease in plasma LDL and VLDL [1, 2]. Literature surveys reveal few HPLC and LC-MS methods for its determination [3-10]. The simple, accurate, precise and validated method for determination of Rosuvastatin was developed by LC/MS/MS method.
EXPERIMENTAL Instrumentation
Quantitation was achieved with LCMS-MS detection in positive ion mode using an MDS Sciex API-4000 mass spectrometer equipped with a
Turboionspray™ interface consisting of a C18 column (50 mm×4.6 mm, 3μm), a binary LC-20 AD prominence pump an auto sampler and a solvent degasser. Detection of the ions was carried out in the multiple reaction monitoring (MRM) modes by monitoring the transition pairs Quadrupoles Q1 and Q3 were set on unit resolution. The analysis data obtained were processed by Analyst software™ (version 1.4.2).
Chromatographic conditions
An LC system (Shimadzu, Japan) consisting of a C18 column (50 mm×4.6 mm, 3μm), a binary LC-20 AD prominence pump, an auto sampler and a solvent degasser. Aliquots of the processed samples (25μL) were
injected into the column, which was kept at room temperature. The isocratic mobile phase, 55:45 (v/v) mixture of acetonitrile and 10 mM ammonium acetate (pH 3.1±0.05), was delivered at 1.1 ml/min into the electrospray ionization chamber of the mass spectrometer. All the injections run time was 2.5min. The declustering potential was 25 V, the collision cell exit potential was 5 V and the column oven temperature was maintained at 27°C. Detection of the ions was carried out in the multiple reaction monitoring (MRM) mode by monitoring the transition pairs ofm/z478.2 precursor ion to them/z258.5 for Rosuvastatin,m/z237.2 precursor ion to the m/z194.1 product ion for the IS. The source parameters viz. the nebulizer gas, curtain gas, auxiliary gas and collision gas were set at 33, 15, 35 and 7 psi, respectively at 550 °C. The ion spray voltage was set at 4800 V.
Preparation of stock solutions of analytes and IS
Primary stock solutions of Rosuvastatin for preparation of standard and quality control samples were prepared. Primary stock solutions of Rosuvastatin and IS at 1000μg/ml were prepared in acetonitrile and these
A high performance liquid chromatographic method with mass detection was developed for determination of Rosuvastatin in human plasma. Rosuvastatin was extracted from an aliquot of human plasma using Solid Phase Extraction technique, and then injected into a liquid chromatography equipped with a tandem mass spectrometry detector; quantitation was done by peak area ratio method. The method was developed using C18 column (50 mm×4.6 mm, 3μm). A weighed (1/Conc2) linear regression was performed to determine the concentration of analyte. This method demonstrates acceptable performance and is suitable for the determination of Rosuvastatin in human plasma over the range of 0.5 to 512ng/ml respectively. As all the values obtained were within the limits as specified, the method has been successfully used to analyse the human plasma containing Rosuvastatin with good recoveries and proved to be robust.
Keywords:HPLC, LC/MS/MS, Human plasma, Rosuvastatin, ICH Guidelines.
ABSTRACT
B. Siddartha
1*Dr. I. Sudheer Babu
21Department of Pharmaceutical Analysis, Malla Reddy College of Pharmacy, Secunderabad-500014
2Sir C.R.Reddy College of Pharmaceutical Sciences
Eluru, A.P, India.
Journal of Global Trends in Pharmaceutical Sciences
Journal home page: www.jgtps.com
ISSN: 2230-7346
stocks were stored at 2–8 °C; they were found to be stable for 15 days. The stock solutions were suitably diluted with a mixture of acetonitrile and water (55:45v/v; diluent) to prepare working standard solutions for the purpose of plotting the calibration curve (CC). Another set of working solutions of Rosuvastatin, were made in diluent (from primary stock) at appropriate dilutions for preparation of quality control samples. A working IS-Carbamazepine solution (5 ng/ml) was also prepared with same diluent.
Preparation of calibration curve standards and quality control samples
Calibration samples were prepared by spiking 950μl of control human plasma with the appropriate
working standard solution of the analyte (25μl of
Rosuvastatin) and made up to 1000 μl. Calibration curve
(CC) standards of Rosuvastatin in blank plasma were prepared by spiking with an appropriate volume of the working solutions, giving final concentrations of 0.50 ng/ml, 1.00 ng/ml, 2.0 ng/ml, 4.0 ng/ml, 8.0 ng/ml, 16.0 ng/ml, 32.0 ng/ml, 64.0 ng/ml, 128.0 ng/ml, 256 ng/ml and 512.0 ng/ml for Rosuvastatin.
The Calibration curve samples were analyzed along with the quality control samples for each batch of plasma samples. The QC samples were prepared at five different concentration levels of 0.50ng/ml (lower limit of quantification, LLOQ), 4.0 ng/ml (low quality control, LQC), 16.0 ng/ml (middle quality control, MQC), and 64.0 ng/ml (high quality control, HQC) for Rosuvastatin, in blank plasma. All the prepared plasma samples were stored at −70°C.
Sample preparation
All frozen subject samples, calibration standards and quality control samples were thawed and allowed to equilibrate at room temperature prior to analysis. The samples were vortex-mixed for 10 s prior to spiking. 200μL aliquot of human plasma sample was mixed with
20μL of the IS working solution (5 μg/mL of
Carbamazepine). To this, 50μL of theammonia solution (25%) and 1.0 mL of acetonitrile were added. After vortex-mixing for 30 s and centrifugating at 4000 rpm for 10 min, the supernatant was transferred to another clean test tube and evaporated to dryness at 45 °C under a gentle stream of nitrogen. The residue was reconstituted with 500μL of the mobile phase and 25 μL was injected
into LC–MS/MS system.
METHOD VALIDATION
The described method has been validated for the assay of Rosuvastatin using following parameters.
Linearity
Linearity of this method was evaluated by linear regression analysis and calculated by least square method and studied by preparing standard solutions of Rosuvastatin at different concentration levels (0.5, 1, 2, 4, 8, 16, 32, 64, 128, 256 and 512ng/ml). Peak area of resulting solutions was measured and the calibration curve was plotted between peak area vs concentration of the drug.
Precision
Precision evaluation were assessed by analyzing three sets of QC samples, six replicates each of the LQC(4ng/ml), MQC(16ng/ml) and HQC(64ng/ml) run on the same day. The %RSD of LQC, MQC and HQC were observed.
Accuracy
Accuracy was performed by taking known amount of sample solution (16ng/ml). The various concentrations of Rosuvastatin standard solutions (8ng/ml, 16ng/ml and 32ng/ml) were spiked equivalent to 50%, 100% and 150% of the sample amount. The solutions were injected into the HPLC system in triplicate as per the test procedure. The average % recovery was calculated.
Robustness
Robustness was done by small deliberate changes in the chromatographic conditions of LQC and HQC solutions and retention time of Rosuvastatin and Carbamazepine was noted. The factors selected were change in flow rate (1.0ml/min and 1.2ml/min) and variation in the mobile phase composition (buffer: acetonitrile: 56:44% v/v and buffer: acetonitrile: 54:46% v/v). The results remained unaffected by small variations in these parameters.
Stability studies Short term – (8hours)
Stock solution stability was determined by comparing the peak areas of freshly prepared solutions (LQC and HQC) with stability samples. Main stock solutions of Rosuvastatin were freshly prepared and aliquots of stocks were kept at room temperature for 8 hours (stability sample). Areas of stability samples and freshly prepared samples were compared to determine mean % nominal concentration during stability period. The mean % change calculated. Similarly, Carbamazepine Internal standard was prepared freshly and were kept at room temperature for 8 hours. The areas of stability samples and freshly prepared samples were compared to determine mean % nominal concentration during stability period.
Long term – (for 6 days at -200C)
For the Long term stock solutions (LQC and HQC), the working solution of Rosuvastatin was prepared and stored in the refrigerator at 2-10°C for 6 days. Working solutions of Rosuvastatin was compared against fresh stock solution prepared. The mean % concentration calculated. Similarly, Carbamazepine internal standard was prepared and stored in the refrigerator at 2-10°C for 6 days. The mean % concentration was calculated by comparing freshly prepared and stability samples.
Bench top stability
In- Injector stability
LQC and HQC samples were prepared and processed. These processed samples were analyzed and kept in auto sampler for 51hours at 5°C and analyzed along with freshly prepared calibration standard samples. Concentrations were calculated to determine mean % change during stability period.
Stability of analyte (wet extract)
To qualify the stability of analytes in the biological matrix during transportation of the samples, the dry ice stability (coolant) was determined. Six sets of samples each of low (LQC) and (LQC) were kept in dry ice for approximately 27 hours at 2-80C. Stability samples at each level low (LQC) and high (HQC) were processed and they were analyzed along with freshly processed calibration and comparison samples (freshly processed LQC and HQC).
Freeze and thaw stability
Samples were prepared at LQC and HQC levels, aliquot and frozen at -20±5°C. Six samples from each concentration were subjected to three freezes and thaw cycles (stability samples). These samples were processed and analysed along with freshly prepared calibration standards, LQC and HQC samples (comparison samples). Concentrations were calculated to determine mean % change after four cycles.
RESULTS AND DISCUSSIONS Linearity
The retention times of Rosuvastatin was found to be 1.34 minutes. The overall chromatographic run time is 2 minutes. Mass spectrum of Rosuvastatin was present in Fig-1. During the validation, blank plasma samples from eight donors were evaluated and all plasma lots were found to be satisfactory. Fig-2and Fig-3expressed that there were no interfering peaks in the blank plasma at the retention times of Rosuvastatin or internal standard as seen in the chromatograms.
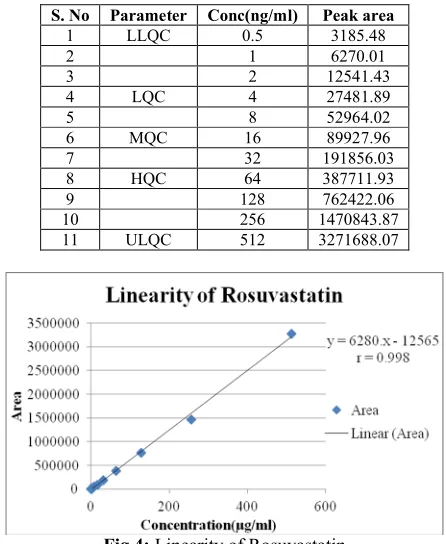
Calibration curve method
The summary of calibration curve method was shown in Table-1. Calibration curves were found to be consistently accurate and precise for Rosuvastatin over 0.5 to 512ng/ml for calibration range. The correlation coefficient was greater than or equal to 0.9989 for Rosuvastatin. The calibration curve to determine Rosuvastatin concentrations of each calibration standard was shown in Fig-4.
Precision
The %RSD of LQC, MQC and HQC for Rosuvastatin were found to be 1.89, 2.24 and 2.58 and the %RSD of LQC, MQC and HQC for Carbamazepine were found to be 2.31, 2.57 and 1.99. The results were shown in Table-2.
Recovery
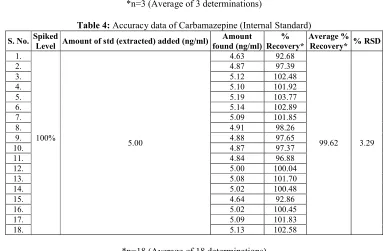
The % recovery for MQC sample of Rosuvastatin was found from 96.14 to 106.75% respectively. The % recovery for Carbamazepine internal standard was found from 92.68 to 103.77% respectively. The results were shown in Table-3and Table-4.
Robustness
Robustness was performed with deliberate changes in flow rate and mobile phase of LQC and HQC solutions. The %RSD of Rosuvastatin and Carbamazepine solutions, the LQC and HQC values for change in flow rate at 1.0ml/min was found to be 3.61 & 3.39 and 2.77 & 3.25. The %RSD of Rosuvastatin and Carbamazepine solutions, the LQC and HQC values for change in flow rate at 1.2ml/min was found to be 3.17 & 3.71 and 3.15 & 3.27. The results were shown in Table-5.
The %RSD of Rosuvastatin and Carbamazepine solutions, the LQC and HQC values for change in mobile phase (buffer: acetonitrile: 56:44) was found to be 3.60 & 3.39 and 3.50 & 3.07. The %RSD of Rosuvastatin and Carbamazepine solutions, the LQC and HQC values for change in mobile phase (buffer: acetonitrile: 54:46) was found to be 3.29 & 3.36 and 3.12 & 3.11. The results were shown in Table-6.
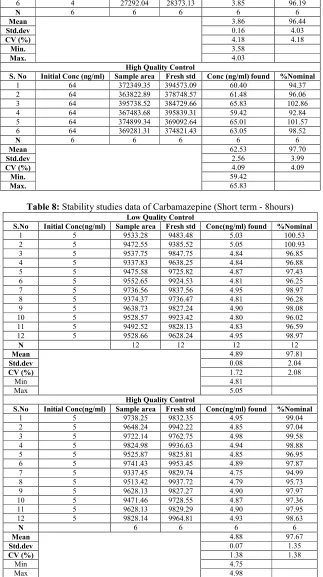
Stability studies Short term – 8hours
Rosuvastatin stock solution were found to be stable at room temperature for 8 hours with mean % nominal concentration was found to be 96.44% at LQC and 97.70% at HQC respectively. The mean % nominal concentration of Carbamazepine internal standard solution was found to be 98.14% at LQC and 98.39% at HQC respectively. The results were shown in Table-7 and Table-8.
Long term – (for 6 days at -200C)
Rosuvastatin stock solution was found to be stable at room temperature for 6 days at 2-100C with mean % nominal concentration was 93.07% at LQC and 92.56% at HQC respectively. Carbamazepine internal standard solution was found to be stable at room temperature for 6 days at 2-100C with mean % nominal concentration was 97.88% at LQC and 97.93% at HQC respectively. The results were shown in Table-9 and Table-10.
Bench top stability
Rosuvastatin was found to be stable in LQC and HQC samples for 27 hours 20 min at room temperature with mean % nominal concentration of 96.20 and 95.31 respectively. The results were shown in Table-11.
In-injector stability of LAM and ZID at 5 0C in auto
sampler
Rosuvastatin was found to be stable in LQC and HQC samples for 51 hours at 5°C in auto sampler with mean % nominal concentration of 97.83% and 98.24 % respectively. The results were shown in Table-12.
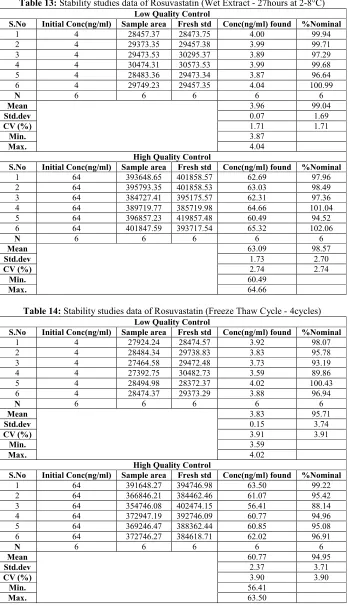
Stability of analyte (wet extract)
Rosuvastatin was found to be stable in LQC and HQC samples for 27 hours at 2-8°C in auto sampler with mean % nominal concentration of 99.04% and 98.57% respectively. The results were shown in Table-13.
CONCLUSION
The method stands validated and is suitable for estimation of plasma Rosuvastatin concentrations as a single analytical run, in clinical samples from Bioequivalence studies following oral administration of Rosuvastatin fixed dose (5/10/20mg) tablets in healthy human subjects.
Fig 1:Chromaogram of Blank Plasma
Fig 2: Chromatogram of Internal standard
Fig 3: Chromatogram of Rosuvastatin
Table 1:Linearity data of Rosuvastatin
S. No Parameter Conc(ng/ml) Peak area
1 LLQC 0.5 3185.48
2 1 6270.01
3 2 12541.43
4 LQC 4 27481.89
5 8 52964.02
6 MQC 16 89927.96
7 32 191856.03
8 HQC 64 387711.93
9 128 762422.06
10 256 1470843.87
11 ULQC 512 3271688.07
Fig 4: Linearity of Rosuvastatin
Table 2: Precision data of Rosuvastatin
Low Quality Control
S No (ng/ml)Conc Rt Rosuvastatin (ng/ml)Conc Rt StandardInternal
1 4 1.34 27481.83 5 0.99 9549.03 2 4 1.33 28739.57 5 0.99 10128.45 3 4 1.34 27394.33 5 0.99 9748.78 4 4 1.34 27802.09 5 0.99 10092.39 5 4 1.34 28018.34 5 0.99 10039.52 6 4 1.34 28422.86 5 0.98 9821.33
Mean 27977 9897
Std.Dev 529 228
%RSD 1.89 2.31
Middle Quality Control
S.No Conc(ng/ml) Rt Rosuvastatin Conc(ng/ml) Rt StandardInternal
1 16 1.34 89927.96 5 0.99 9676.89 2 16 1.34 91232.94 5 0.99 10087.82 3 16 1.33 87928.09 5 0.98 10154.32 4 16 1.34 93212.82 5 0.98 9923.19 5 16 1.34 89229.91 5 0.98 10153.43 6 16 1.34 88091.33 5 0.99 9562.11
Mean 89937 9926
Std.Dev 2018 255
%RSD 2.24 2.57
High Quality Control
S.No Conc(ng/ml) Rt Rosuvastatin Conc(ng/ml) Rt StandardInternal
1 64 1.34 389121.55 5 0.99 10174.07 2 64 1.34 387654.09 5 0.98 9657.34 3 64 1.34 384549.12 5 0.99 10076.54 4 64 1.34 396523.98 5 0.98 9912.87 5 64 1.34 367643.39 5 0.99 9756.98 6 64 1.33 378965.55 5 0.99 9808.65
Mean 384076 9898
Std.Dev 9895 197
Table 3: Accuracy data of Rosuvastatin
S. No SpikedLevel Amount of std (extracted) added(ng/ml) Amount found (ng/ml) Average %Recovery* Std. Dev %RSD
1 50% 8.00 7.81 97.57 2.05 2.10
2 100% 16.00 16.60 103.74 2.81 2.70
3 150% 24.00 25.07 104.47 1.20 1.15
*n=3 (Average of 3 determinations)
Table 4:Accuracy data of Carbamazepine (Internal Standard) S. No. Spiked
Level Amount of std (extracted) added (ng/ml)
Amount found (ng/ml)
% Recovery*
Average % Recovery* % RSD 1.
100% 5.00
4.63 92.68
99.62 3.29
2. 4.87 97.39
3. 5.12 102.48
4. 5.10 101.92
5. 5.19 103.77
6. 5.14 102.89
7. 5.09 101.85
8. 4.91 98.26
9. 4.88 97.65
10. 4.87 97.37
11. 4.84 96.88
12. 5.00 100.04
13. 5.08 101.70
14. 5.02 100.48
15. 4.64 92.86
16. 5.02 100.45
17. 5.09 101.83
18. 5.13 102.58
*n=18 (Average of 18 determinations)
Table 5: Robustness data relating to change in flow rate (1.0ml/min) Low Quality Control
S. No Rosuvastatin (4ng/ml) Carbamazepine (5ng/ml) Flow rate (ml/min) Average Peak Area* Std.dev %RSD Average Peak Area* Std.dev %RSD
1 1.0ml/min 27614 997 3.61 9882 335 3.39
2 1.2ml/min 388047 10733 2.77 9858 320 3.25
High Quality Control
S. No Rosuvastatin (64ng/ml) Carbamazepine (5ng/ml) Flow rate (ml/min) Average Peak Area* Std.dev %RSD Average Peak Area* Std.dev %RSD
1 1.0ml/min 27443 869 3.17 9944 369 3.71
2 1.2ml/min 10030 11907 3.15 10030 328 3.27
*n=6 (Average of 6 determinations)
Table 6: Robustness data relating to change in mobile phase (buffer: acetonitrile::55:45) LQC
S.No
Rosuvastatin(4ng/ml) Carbamazepine(5ng/ml) Mobile phase variation (%) Average Peak Area* Std.
dev % RSD
Average Peak Area*
Std. dev
% RSD
1 M.P-1-(BUFFER:ACN::56:44) 28167 1015 3.60 10026 340 3.39
2 M.P-2-(BUFFER:ACN::54:46) 383100 13394 3.50 10119 311 3.07
HQC
S.No
Rosuvastatin(4ng/ml) Carbamazepine(5ng/ml) Mobile phase variation (%) Average Peak Area* Std.dev RSD% Peak Area*Average Std.dev RSD%
1 M.P-1-(BUFFER:ACN::56:44) 28477 936 3.29 9957 334 3.36
2 M.P-2-(BUFFER:ACN::54:46) 382084 11921 3.12 10049 312 3.11
Table 7: Stability studies data of Rosuvastatin (Short term - 8hours)
Low Quality Control
S. No Initial Conc (ng/ml) Sample area Fresh std Conc (ng/ml) found %Nominal
1 4 26389.45 27647.78 3.82 95.45
2 4 27323.98 28372.22 3.85 96.31
3 4 25923.22 28928.38 3.58 89.61
4 4 26374.84 26282.42 4.01 100.35
5 4 27494.14 27294.98 4.03 100.73
6 4 27292.04 28373.13 3.85 96.19
N 6 6 6 6 6
Mean 3.86 96.44
Std.dev 0.16 4.03
CV (%) 4.18 4.18
Min. 3.58
Max. 4.03
High Quality Control
S. No Initial Conc (ng/ml) Sample area Fresh std Conc (ng/ml) found %Nominal
1 64 372349.35 394573.09 60.40 94.37
2 64 363822.89 378748.57 61.48 96.06
3 64 395738.52 384729.66 65.83 102.86
4 64 367483.68 395839.31 59.42 92.84
5 64 374899.34 369092.64 65.01 101.57
6 64 369281.31 374821.43 63.05 98.52
N 6 6 6 6 6
Mean 62.53 97.70
Std.dev 2.56 3.99
CV (%) 4.09 4.09
Min. 59.42
Max. 65.83
Table 8: Stability studies data of Carbamazepine (Short term - 8hours)
Low Quality Control
S.No Initial Conc(ng/ml) Sample area Fresh std Conc(ng/ml) found %Nominal
1 5 9533.28 9483.48 5.03 100.53
2 5 9472.55 9385.52 5.05 100.93
3 5 9537.75 9847.75 4.84 96.85
4 5 9337.83 9638.25 4.84 96.88
5 5 9475.58 9725.82 4.87 97.43
6 5 9552.65 9924.53 4.81 96.25
7 5 9736.56 9837.56 4.95 98.97
8 5 9374.37 9736.47 4.81 96.28
9 5 9638.73 9827.24 4.90 98.08
10 5 9528.57 9923.42 4.80 96.02
11 5 9492.52 9828.13 4.83 96.59
12 5 9528.66 9628.24 4.95 98.97
N 12 12 12 12
Mean 4.89 97.81
Std.dev 0.08 2.04
CV (%) 1.72 2.08
Min 4.81
Max 5.05
High Quality Control
S.No Initial Conc(ng/ml) Sample area Fresh std Conc(ng/ml) found %Nominal
1 5 9738.25 9832.35 4.95 99.04
2 5 9648.24 9942.22 4.85 97.04
3 5 9722.14 9762.75 4.98 99.58
4 5 9824.98 9936.63 4.94 98.88
5 5 9525.87 9825.81 4.85 96.95
6 5 9741.43 9953.45 4.89 97.87
7 5 9337.45 9829.74 4.75 94.99
8 5 9513.42 9937.72 4.79 95.73
9 5 9628.13 9827.27 4.90 97.97
10 5 9471.46 9728.55 4.87 97.36
11 5 9628.13 9829.29 4.90 97.95
12 5 9828.14 9964.81 4.93 98.63
N 6 6 6 6
Mean 4.88 97.67
Std.dev 0.07 1.35
CV (%) 1.38 1.38
Min 4.75
Table 9: Stability studies data of Rosuvastatin (Long term for 6-10 days at -200C)
Low Quality Control
S.No Initial Conc(ng/ml) Sample area Fresh std Conc(ng/ml) found %Nominal
1 4 24852.34 28319.23 3.51 87.76
2 4 25382.21 27389.76 3.71 92.67
3 4 26352.87 28369.23 3.72 92.89
4 4 24836.65 27381.11 3.63 90.71
5 4 26832.11 28397.44 3.78 94.49
6 4 27363.29 27381.37 4.00 99.93
N 6 6 6 6 6
Mean 3.72 93.07
Std.dev 0.16 4.08
CV (%) 4.38 4.38
Min. 3.51
Max. 4.00
High Quality Control
S.No Initial Conc(ng/ml) Sample area Fresh std Conc(ng/ml) found %Nominal
1 64 364728.27 384729.56 60.67 94.80
2 64 342875.37 382947.23 57.30 89.54
3 64 362491.18 398471.48 58.22 90.97
4 64 363292.57 371947.19 62.51 97.67
5 64 348749.88 382947.08 58.28 91.07
6 64 349774.31 382947.75 58.46 91.34
N 6 6 6 6 6
Mean 59.24 92.56
Std.dev 1.95 3.05
CV (%) 3.30 3.30
Min. 57.30
Max. 62.51
Table 10: Stability studies data of Carbamazepine (Long term – 6days at -200C)
Low Quality Control
S. No Initial Conc(ng/ml) Sample area Fresh std Conc(ng/ml) found %Nominal
1 5 9228.27 9932.25 4.65 92.91
2 5 9372.45 9932.87 4.72 94.36
3 5 9242.84 9861.11 4.69 93.73
4 5 9138.29 9736.24 4.69 93.86
5 5 9336.27 9527.24 4.90 98.00
6 5 9272.24 9972.85 4.65 92.97
7 5 9132.57 9816.98 4.65 93.03
8 5 9274.57 9713.67 4.77 95.48
9 5 9072.51 9913.42 4.58 91.52
10 5 9173.13 9718.13 4.72 94.39
11 5 9228.32 9816.64 4.70 94.01
12 5 9136.98 9928.82 4.60 92.02
N 12 12 12 12
Mean 4.69 93.86
Std.dev 0.08 1.69
CV (%) 1.80 1.80
Min. Max.
High Quality Control
S.No Initial Conc(ng/ml) Sample area Fresh std Conc(ng/ml) found %Nominal
1 5 9832.25 9962.25 4.93 98.70
2 5 9716.17 9628.87 5.05 100.91
3 5 9527.36 9632.12 4.95 98.91
4 5 9481.13 9856.67 4.81 96.19
5 5 9364.84 9846.37 4.76 95.11
6 5 9628.25 9846.28 4.89 97.79
7 5 9365.13 9834.24 4.76 95.23
8 5 9424.65 9723.24 4.85 96.93
9 5 9532.42 9972.13 4.78 95.59
10 5 9632.87 9862.28 4.88 97.67
11 5 9436.26 9927.28 4.75 95.05
12 5 9632.34 9726.97 4.95 99.03
N 12 12 12 12
Mean 4.86 97.26
Std.dev 0.09 1.89
CV (%) 1.94 1.94
Table 11: Stability studies data of Rosuvastatin (Bench Top - 27hours at Room Temperature)
Low Quality Control
S. No Initial Conc(ng/ml) Sample area Fresh std Conc(ng/ml) found %Nominal
1 4 27375.47 28374.21 3.86 96.48
2 4 26483.37 28294.47 3.74 93.60
3 4 26389.89 27394.38 3.85 96.33
4 4 27482.32 28494.34 3.86 96.45
5 4 27876.45 27943.32 3.99 99.76
6 4 27375.23 28942.77 3.78 94.58
N 6 6 6 6 6
Mean 3.85 96.20
Std.dev 0.08 2.11
CV (%) 2.19 2.19
Min. 3.74
Max. 3.99
High Quality Control
S. No Initial Conc(ng/ml) Sample area Fresh std Conc(ng/ml) found %Nominal
1 64 364837.23 384749.47 60.69 94.82
2 64 374518.11 382472.21 62.67 97.92
3 64 378747.38 397479.57 60.98 95.29
4 64 372947.74 382941.41 62.33 97.39
5 64 364827.38 389184.98 59.99 93.74
6 64 362947.49 391571.46 59.32 92.69
N 6 6 6 6 6
Mean 61.00 95.31
Std.dev 1.30 2.03
CV (%) 2.13 2.13
Min. 59.32
Max. 62.67
Table 12: Stability studies data of Rosuvastatin (Auto Sampler - 51 Hours at 5°C) Low Quality Control
S.No Initial Conc(ng/ml) Sample area Fresh std Conc(ng/ml) found %Nominal
1 4 27375.34 28737.33 3.81 95.26
2 4 26853.87 27483.75 3.91 97.71
3 4 28473.65 29475.47 3.86 96.60
4 4 27457.84 27847.63 3.94 98.60
5 4 28475.47 28939.43 3.94 98.40
6 4 28583.65 28473.11 4.02 100.39
N 6 6 6 6 6
Mean 3.91 97.83
Std.dev 0.07 1.77
CV (%) 1.80 1.80
Min. 3.81
Max. 4.02
High Quality Control
S.No Initial Conc(ng/ml) Sample area Fresh std Conc(ng/ml) found %Nominal
1 64 384563.57 395763.66 62.19 97.17
2 64 375839.37 379839.35 63.33 98.95
3 64 394737.33 395763.55 63.83 99.74
4 64 392747.13 405829.28 61.94 96.78
5 64 389759.34 392573.67 63.54 99.28
6 64 385935.24 395715.53 62.42 97.53
N 6 6 6 6 6
Mean 62.87 98.24
Std.dev 0.79 1.24
CV (%) 1.26 1.26
Min. 61.94
Table 13: Stability studies data of Rosuvastatin (Wet Extract - 27hours at 2-8°C) Low Quality Control
S.No Initial Conc(ng/ml) Sample area Fresh std Conc(ng/ml) found %Nominal
1 4 28457.37 28473.75 4.00 99.94
2 4 29373.35 29457.38 3.99 99.71
3 4 29473.53 30295.37 3.89 97.29
4 4 30474.31 30573.53 3.99 99.68
5 4 28483.36 29473.34 3.87 96.64
6 4 29749.23 29457.35 4.04 100.99
N 6 6 6 6 6
Mean 3.96 99.04
Std.dev 0.07 1.69
CV (%) 1.71 1.71
Min. 3.87
Max. 4.04
High Quality Control
S.No Initial Conc(ng/ml) Sample area Fresh std Conc(ng/ml) found %Nominal
1 64 393648.65 401858.57 62.69 97.96
2 64 395793.35 401858.53 63.03 98.49
3 64 384727.41 395175.57 62.31 97.36
4 64 389719.77 385719.98 64.66 101.04
5 64 396857.23 419857.48 60.49 94.52
6 64 401847.59 393717.54 65.32 102.06
N 6 6 6 6 6
Mean 63.09 98.57
Std.dev 1.73 2.70
CV (%) 2.74 2.74
Min. 60.49
Max. 64.66
Table 14: Stability studies data of Rosuvastatin (Freeze Thaw Cycle - 4cycles) Low Quality Control
S.No Initial Conc(ng/ml) Sample area Fresh std Conc(ng/ml) found %Nominal
1 4 27924.24 28474.57 3.92 98.07
2 4 28484.34 29738.83 3.83 95.78
3 4 27464.58 29472.48 3.73 93.19
4 4 27392.75 30482.73 3.59 89.86
5 4 28494.98 28372.37 4.02 100.43
6 4 28474.37 29373.29 3.88 96.94
N 6 6 6 6 6
Mean 3.83 95.71
Std.dev 0.15 3.74
CV (%) 3.91 3.91
Min. 3.59
Max. 4.02
High Quality Control
S.No Initial Conc(ng/ml) Sample area Fresh std Conc(ng/ml) found %Nominal
1 64 391648.27 394746.98 63.50 99.22
2 64 366846.21 384462.46 61.07 95.42
3 64 354746.08 402474.15 56.41 88.14
4 64 372947.19 392746.09 60.77 94.96
5 64 369246.47 388362.44 60.85 95.08
6 64 372746.27 384618.71 62.02 96.91
N 6 6 6 6 6
Mean 60.77 94.95
Std.dev 2.37 3.71
CV (%) 3.90 3.90
Min. 56.41
REFERENCES:
1. Indian Pharmacopoeia. Ghaziabad: The Indian Pharmacopoeia Commission, 2007; vol 3: 1676-1678.
2. Sweetman SC, Martindale The Complete Drug Reference. 34th ed. London: Royal Pharmaceuitical Society of Great Britain; 2005; p.996.
3. Dujuan Zhang et al, Validated LC-MS/MS Method for the Determination of Rosuvastatin in Human Plasma: Application to a Bioequivalence Study in Chinese Volunteers, Pharmacology & Pharmacy, 2011; 2: 341-346.
4. B. Mohammed Ishaq et al, Development and validation of LC-MS method for the determination of Rosuvastatin Hydrochloride in human plasma, Journal of Chemical and Pharmaceutical Research, 2010; 2(6): 324-333.
5. Sonu Sundd Singh et al, Estimation of Rosuvastatin in Human Plasma by HPLC Tandem Mass Spectroscopic Method and its Application to Bioequivalence Study, Journal of the Brazilian Chemical Society, 2005; 16(5): 944-950.
6. Safwan Ashour and Soulafa Omar, Validated High-Performance Liquid Chromatographic Method for the Estimation of Rosuvastatin Calcium in Bulk and Pharmaceutical Formulations, International Journal of Biomedical Science, 2011; 7(4): 283-288.
7. Sena Caglar and Sidika Toker, Determination of Rosuvastatin at Picogram Level in Serum by Fluorimetric Derivatization with 9-Anthryldiazomethane using HPLC, Journal of Chromatographic Science, 2012; 51(1): 53-58.
8. Joyce S. Macwan, Ileana A. Ionita, Fatemeh Akhlaghi, A simple assay for the simultaneous determination of rosuvastatin acid, rosuvastatin-5S-lactone, and N-desmethyl rosuvastatin in human plasma using liquid chromatography–tandem mass spectrometry (LC-MS/MS), Analytical and Bioanalytical Chemistry, 2012; 402(3): 1217-1227.
9. Mohammed Ishaq Beludari et al, RP-HPLC method for simultaneous estimation of Rosuvastatin and Ezetimibe from their combination tablet dosage form, International Journal of Chemical and Analytical Science, 2013; 4(4): 205-209.
10. Safwan Ashour and Soulafa Omar, Validated High-Performance Liquid Chromatographic Method for the Estimation of Rosuvastatin Calcium in Bulk and Pharmaceutical Formulations, International Journal of Biomedical Science, 2011; 7(4): 283-288.
11. HO Kaila et al, A new improved RP-HPLC method for assay of rosuvastatin calcium in tablets, Indian Journal of Pharmaceutical Sciences, 2010; 72(5): 592-598.
12. Chirag B. Pandya et al, Development and validation of RP-HPLC method for determination of rosuvastatin calcium in bulk and pharmaceutical dosage form, International Journal of Pharmaceutical Sciences Review and Research, 2010; 5(1): 82-86.
13. Sandhya Donthula et al, A new validated RP-HPLC method for determination of Rosuvastatin calcium in bulk and pharmaceutical dosage form, Der Pharmacia Lettre, 2011, 3(3): 350-356.
How to cite this article:
B. Siddartha,* Dr. I. Sudheer Babu: Estimation and Validation for determination of Rosuvastatin in Human Plasma by LC/MS/MS Method 5(3): 1979-1988. (2014)