www.biogeosciences.net/14/1333/2017/ doi:10.5194/bg-14-1333-2017
© Author(s) 2017. CC Attribution 3.0 License.
Modelling spatial and temporal dynamics of gross primary
production in the Sahel from earth-observation-based
photosynthetic capacity and quantum efficiency
Torbern Tagesson1,2, Jonas Ardö2, Bernard Cappelaere3, Laurent Kergoat4, Abdulhakim Abdi2, Stéphanie Horion1, and Rasmus Fensholt1
1Department of Geosciences and Natural Resource Management, University of Copenhagen, Øster Voldgade 10,
Ø 1350 Copenhagen, Denmark
2Department of Physical Geography and Ecosystem Science, Lund University, Sölvegatan 12, 223 62 Lund, Sweden 3HydroSciences Montpellier, IRD, CNRS, Univ. Montpellier, Montpellier, France
4Géosciences Environnement Toulouse, (CNRS/UPS/IRD), 14 av E Belin, 31400 Toulouse, France Correspondence to:Torbern Tagesson ([email protected])
Received: 27 September 2016 – Discussion started: 29 September 2016
Revised: 13 February 2017 – Accepted: 28 February 2017 – Published: 17 March 2017
Abstract.It has been shown that vegetation growth in semi-arid regions is important to the global terrestrial CO2sink,
which indicates the strong need for improved understanding and spatially explicit estimates of CO2uptake (gross primary
production; GPP) in semi-arid ecosystems. This study has three aims: (1) to evaluate the MOD17A2H GPP (collection 6) product against GPP based on eddy covariance (EC) for six sites across the Sahel; (2) to characterize relationships between spatial and temporal variability in EC-based pho-tosynthetic capacity (Fopt)and quantum efficiency (α)and
vegetation indices based on earth observation (EO) (normal-ized difference vegetation index (NDVI), renormal(normal-ized dif-ference vegetation index (RDVI), enhanced vegetation index (EVI) and shortwave infrared water stress index (SIWSI)); and (3) to study the applicability of EO upscaled Foptand α for GPP modelling purposes. MOD17A2H GPP (collec-tion 6) drastically underestimated GPP, most likely because maximum light use efficiency is set too low for semi-arid ecosystems in the MODIS algorithm. Intra-annual dynam-ics inFoptwere closely related to SIWSI being sensitive to
equivalent water thickness, whereasαwas closely related to RDVI being affected by chlorophyll abundance. Spatial and inter-annual dynamics inFoptandαwere closely coupled to
NDVI and RDVI, respectively. Modelled GPP based onFopt
and αupscaled using EO-based indices reproduced in situ GPP well for all except a cropped site that was strongly
im-pacted by anthropogenic land use. Upscaled GPP for the Sa-hel 2001–2014 was 736±39 g C m−2yr−1. This study indi-cates the strong applicability of EO as a tool for spatially ex-plicit estimates of GPP,Foptandα; incorporating EO-based Fopt andα in dynamic global vegetation models could
im-prove estimates of vegetation production and simulations of ecosystem processes and hydro-biochemical cycles.
1 Introduction
Vegetation growth in semi-arid regions is an important sink for fossil fuel emissions. Mean carbon dioxide (CO2)
up-take by terrestrial ecosystems is dominated by highly pro-ductive lands, mainly tropical forests, whereas semi-arid re-gions are the main biome driving its inter-annual variability (Ahlström et al., 2015; Poulter et al., 2014). Semi-arid re-gions contribute to 60 % of the long-term trend in the global terrestrial C sink (Ahlström et al., 2015). It is thus impor-tant to understand long-term variability of vegetation growth in semi-arid areas and the response of vegetation to environ-mental conditions to better quantify and forecast effects of climate change.
droughts over the last decades, which resulted in region-wide famines in 1972–1973 and 1984–1985 and localized food shortages across the region in 1990, 2002, 2004, 2011 and 2012 (Abdi et al., 2014; United Nations, 2013). Vege-tation production is thereby an important ecosystem service for livelihoods in the Sahel, but it is under threat. The region is experiencing strong population growth, increasing the de-mand on ecosystem services due to cropland expansion, in-creased pasture stocking rates and fuelwood extraction (Abdi et al., 2014).
At the same time as we have reports of declining vegeta-tion producvegeta-tion, we have contradicting reports of the green-ing of the Sahel based on earth observation (EO) data (Dardel et al., 2014; Fensholt et al., 2013). The greening of the Sa-hel has mainly been attributed to alleviated drought stress conditions due to increased precipitation since the mid-1990s (Hickler et al., 2005). Climate is thus another important fac-tor regulating vegetation production. Semi-arid regions, such as the Sahel, are particularly vulnerable to climate fluctua-tions due to their dependency on moisture.
Estimation of gross primary production (GPP), i.e. uptake of atmospheric CO2by vegetation, is still a major challenge
for the remote sensing of ecosystem services. Gross primary production is a main driver of ecosystem services such as climate regulation, carbon (C) sequestration, C storage, food production and livestock grassland production. Within EO, spatial quantification of GPP generally involves light use ef-ficiency (LUE), defined as the conversion efef-ficiency of ab-sorbed solar light into CO2uptake (Monteith, 1972, 1977). It
has been shown that LUE varies in space and time due to fac-tors such as plant functional type, drought and temperature, nutrient levels, and physiological limitations of photosynthe-sis (Garbulsky et al., 2010; Paruelo et al., 2004; Kergoat et al., 2008). The LUE concept has been applied through vari-ous methods, either by using a biome-specific LUE constant (Ruimy et al., 1994) or by modifying a maximum LUE using meteorological variables (Running et al., 2004).
An example of a LUE-based model is the standard GPP product from the Moderate Resolution Imaging Spectrora-diometer (MODIS) sensor (MOD17A2). Within the model, absorbed photosynthetically active radiation (PAR) is esti-mated as a product of the fraction of PAR absorbed by green vegetation (FPAR from MOD15A2) multiplied with daily PAR from the meteorological data of the Global Model-ing and Assimilation Office (GMAO). A set of maximum LUE parameters specified for each biome are extracted from a Biome Properties Look-Up Table (BPLUT). Then maxi-mum LUE is modified depending on air temperature (Tair)
and vapour pressure deficit (VPD; Running et al., 2004). Sjöström et al. (2013) evaluated the MOD17A2 product (col-lection 5.1) for Africa and showed that it underestimated GPP for semi-arid savannas in the Sahel. Explanations for this underestimation were that the assigned maximum LUE from BPLUT was set too low and that there were uncertain-ties in the FPAR product (MOD15A2). Recently, a new
col-lection of MOD17A2 at a 500 m spatial resolution was re-leased (MOD17A2H, collection 6) with an updated BPLUT, updated GMAO meteorological data, improved quality con-trol and gap-filling of the FPAR data from MOD15A2 (Run-ning and Zhao, 2015).
It has been shown that the LUE method does not perform well in arid conditions and at agricultural sites (Turner et al., 2005). Additionally, the linearity assumed by the LUE model is not usually found as the response of GPP to incoming light follows more of an asymptotic curve (Cannell and Thorn-ley, 1998). Investigating other methods for remotely deter-mining GPP is thus of great importance, especially for semi-arid environments. Therefore, instead of LUE, we focus on the light response function of GPP at the canopy scale, and spatial and temporal variation of its two main parameters: maximum GPP under light saturation (canopy-scale photo-synthetic capacity,Fopt)and the initial slope of the light
re-sponse function (canopy-scale quantum efficiency,α; Falge et al., 2001; Tagesson et al., 2015a). Photosynthetic capac-ity is a measure of the maximum rate at which the canopy can fix CO2 during photosynthesis (µmol CO2m−2s−1),
whereasα is the amount of CO2 fixed per incoming PAR
(µmol CO2µmol PAR−1). To clarify the difference in LUE
andα in this study, LUE (µmol CO2µmol APAR−1)is the
slope of a linear fit between CO2uptake and absorbed PAR,
whereasα(µmol CO2µmol PAR−1)is the initial slope of an
asymptotic curve against incoming PAR.
It has been proven thatFoptandα are closely related to
chlorophyll abundance due to their coupling with the elec-tron transport rate (Ide et al., 2010). Additionally, in semi-arid ecosystems, water availability is generally considered to be the main limiting factor affecting intra-annual dynamics of vegetation growth (Fensholt et al., 2013; Hickler et al., 2005; Tagesson et al., 2015b). Several remote sensing stud-ies have established relationships between remotely sensed vegetation indices and ecosystem properties such as chloro-phyll abundance and equivalent water thickness (Yoder and Pettigrew-Crosby, 1995; Fensholt and Sandholt, 2003). In this study, we will analyse whether EO vegetation indices can be used to upscaleFoptandαand investigate whether this
could offer a promising way to map GPP in semi-arid areas. This potential will be analysed by the use of detailed ground observations from six eddy covariance (EC) flux tower sites across the Sahel.
The three aims of this study are
1. to investigate whether the recently released MOD17A2H GPP (collection 6) product is better at capturing GPP for the Sahel than collection 5.1. We hypothesize that the MOD17A2H GPP (collection 6) product will estimate GPP well for the six Sahelian EC sites because of major changes made in comparison to collection 5.1 (Running and Zhao, 2015);
vegetation indices. We hypothesise that EO vegetation indices that are closely related to chlorophyll abundance will be most strongly coupled with spatial and inter-annual dynamics inFoptandα, whereas vegetation
in-dices closely related to equivalent water thickness will be most strongly coupled with intra-annual dynamics in Foptandαacross the Sahel;
3. to evaluate the applicability of a GPP model based on the light response function using EO vegetation indices and incoming PAR as input data.
2 Materials and methods 2.1 Site description
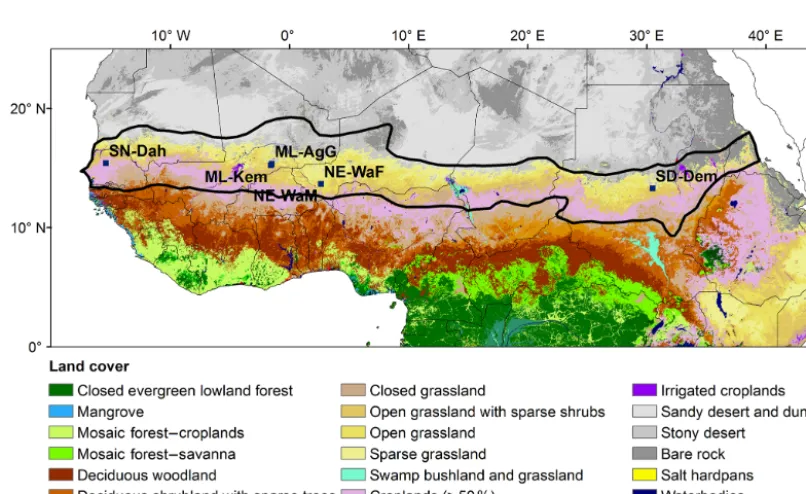
The Sahel stretches from the Atlantic Ocean in the west to the Red Sea in the east. The northern border towards the Sa-hara and the southern border towards the humid Sudanian savanna are defined by the 150 and 700 mm isohyets, respec-tively (Fig. 1; Prince et al., 1995). Tree and shrub canopy cover is now generally low (< 5 %) and dominated by species ofBalanites,Acacia, BosciaandCombretaceae(Rietkerk et al., 1996). Annual grasses such as Schoenefeldia gracilis,
Dactyloctenium aegyptium,Aristida mutabilisandCenchrus biflorusdominate the herbaceous layer, but perennial grasses such as Andropogon gayanus andCymbopogon schoenan-thuscan also be found (Rietkerk et al., 1996; de Ridder et al., 1982). From the FLUXNET database (Baldocchi et al., 2001) we selected six measurement sites with EC-based CO2flux
data from the Sahel (Table 1; Fig. 1). The sites represent a variety of ecosystems present in the region, from dry fallow bush savanna to seasonally inundated acacia forest. For a full description of the measurement sites, we refer to Tagesson et al. (2016a) and references in Table 1.
2.2 Data collection
2.2.1 Eddy covariance and hydrometeorological in situ data
Eddy covariance and hydrometeorological data originating from the years between 2005 and 2013 were collected from the principal investigators of the measurement sites (Tages-son et al., 2016a). The EC sensor set-up consisted of open-path CO2 and H2O infrared gas analysers and three-axis
sonic anemometers. Data were collected at 20 Hz and statis-tics were calculated for 30 min periods. For a full descrip-tion of the sensor set-up and post processing of EC data, see the references in Table 1. Final fluxes were filtered ac-cording to quality flags provided by FLUXNET and out-liers were filtered according to Papale et al. (2006). We extracted the original net ecosystem exchange (NEE) data without any gap-filling or partitioning of NEE to GPP and
ecosystem respiration. The hydrometeorological data col-lected were air temperature (Tair,◦C), rainfall (P, mm),
rela-tive air humidity (Rh, %), soil moisture at 0.1 m depth (SWC, % volumetric water content), incoming global radiation (Rg,
W m−2), incoming photosynthetically active radiation (PAR, µmol m−2s−1), VPD (hPa), peak dry weight biomass (g dry weight m−2), C3/C4 species ratio and soil conditions (ni-trogen and C concentration, %). For a full description of the collected data and sensor set-up, see Tagesson et al. (2016a). 2.2.2 Earth observation data and gridded ancillary
data
Composite products from MODIS/Terra covering the Sa-hel were acquired at Reverb ECHO (NASA, 2016). Col-lected products were GPP (MOD17A2H, collection 6), nadir bidirectional reflectance distribution function adjusted re-flectance (NBAR; 8-day composites; MCD43A4, collection 5.1) at 500×500 m2spatial resolution, the normalized dif-ference vegetation index (NDVI) and the enhanced vegeta-tion index (EVI; 16-day composites; MOD13Q1; collecvegeta-tion 6) at 250×250 m2 spatial resolution. The NBAR product was preferred over the reflectance product (MOD09A1) in order to avoid variability caused by varying sun and sen-sor viewing geometry (Huber et al., 2014; Tagesson et al., 2015c). We extracted the median of 3×3 pixels centred at the location of each EC tower. Time series of EO prod-ucts were filtered according to MODIS quality control data. MOD17A2H is a gap-filled and filtered product, and QC data from MCD43A2 were used for filtering of MCD43A4. Bit 2–5 (highest-decreasing quality) was used for MOD13Q1. Finally, data were gap-filled to daily values using linear in-terpolation.
We downloaded ERA Interim reanalysis PAR at the ground surface (W m−2) with a spatial resolution of 0.25◦×0.25◦accumulated for each 3 h period from 2000 to 2014 from the European Centre for Medium-Range Weather Forecasts (ECMWF) (Dee et al., 2011; ECMWF, 2016a). 2.3 Data handling
2.3.1 Intra-annual dynamics in photosynthetic capacity and quantum efficiency
To estimate daily values of EC-basedFoptandα, the
asymp-totic Mitscherlich light-response function was fitted between daytime NEE and incoming PAR using a 7-day moving win-dow with a 1-day time step:
NEE= −(Fopt)×(1−e
−α×PAR
Fopt
)+Rd, (1)
where Fopt is CO2 uptake at light saturation
(photosyn-thetic capacity; µmol CO2m−2s−1), Rd is dark respiration
(µmol CO2m−2s−1)andαis the initial slope of the light
Table 1.Description of the six measurement sites, including location, soil type, ecosystem type and dominant species.
Measurement site Coordinates Soil type Ecosystem Dominant species
Agoufoua 15.34◦N, Sandy ferruginous Open woody Trees:Acaciaspp., (ML-AgG, Mali) 1.48◦W Arenosol savanna (4 % Balanites aegyptiaca,
tree cover) Combretum glutinosum Herbs: Zornia glochidiata Cenchrus biflorus, Aristida mutabilis, Tragus berteronianus Dahrab 15.40◦N, Sandy luvic Grassland and/or shrubland Trees:Acaciaspp.,
(SN-Dah, Senegal) 15.43◦W Arenosol Savanna (3 % Balanites aegyptiaca tree cover) Herbs:Zornia latifolia,
Aristida adscensionis, Cenchrus biflorus Demokeyac 13.28◦N, Cambic Arenosol Sparse acacia Trees:Acaciaspp., (SD-Dem, Sudan) 30.48◦E savannah (7 % Herbs:Aristida pallida,
tree cover) Eragrostis tremula, Cenchrus biflorus Kelmaa 15.22◦N, Clay soil Open acacia forest Trees:Acacia seyal,
(ML-Kem, Mali) 1.57◦W depression (90 % tree cover) Acacia nilotica, Balanites aegyptiaca, Herbs:Sporobolus hevolvus
Echinochloa colona,Aeschynomene sensitive
Wankama Fallowd 13.65◦N, Sandy ferruginous Fallow bush Guiera senegalensis (NE-WaF, Niger) 2.63◦E Arenosol
Wankama Millete 13.64◦N, Sandy ferruginous Millet crop Pennisetum glaucum (NE-WaM, Niger) 2.63◦E Arenosol
aTimouk et al. (2009).bTagesson et al. (2015b).cSjöström et al. (2009).dVelluet et al. (2014).eBoulain et al. (2009).
[image:4.612.97.500.402.649.2]Falge et al., 2001). By subtractingRdfrom Eq. (1), the
func-tion was forced through zero and GPP was thereby estimated. To ensure a high quality of fitted parameters, parameters were excluded from the analysis when fitting was insignif-icant (pvalue > 0.05) and when they were out of range (Fopt
andα> peak value of the rainy season times 1.2). Addition-ally, outliers were filtered following the method by Papale et al. (2006) using a 30-day moving window with a 1-day time step.
2.3.2 Vegetation indices
The maximum absorption in red wavelengths generally oc-curs at 682 nm as this is the peak absorption for chlorophylla andb (Thenkabail et al., 2000), which makes vegetation in-dices that include the red band sensitive to chlorophyll abun-dance. By far the most common vegetation index is NDVI (Rouse et al., 1974):
NDVI=(ρNIR−ρred) (ρNIR+ρred)
, (2)
where ρNIR is the reflectance factor in the near-infrared
(NIR) band (band 2) andρredis the reflectance factor in the
red band (band 1). Near-infrared radiance is reflected by leaf cells since absorption of these wavelengths would result in overheating of the plant, whereas red radiance is absorbed by chlorophyll and its accessory pigments (Gates et al., 1965). Normalization is done to reduce effects of atmospheric er-rors, solar zenith angles and sensor viewing geometry, as well as to increase the vegetation signal (Qi et al., 1994; Inoue et al., 2008).
A well-known deficiency of NDVI is problems of index saturation at high biomass because absorption of red light at ∼670 nm peaks at higher biomass loads, whereas NIR re-flectance continues to increase due to multiple scattering ef-fects (Mutanga and Skidmore, 2004; Jin and Eklundh, 2014). By reducing atmospheric and soil background influences, EVI is designed to increase the signal from the vegetation and maintain sensitivity in high biomass regions (Huete et al., 2002).
EVI=G (ρNIR−ρred)
(ρNIR+C1ρred−C2ρblue+L)
, (3)
whereρblueis the reflectance factor in the blue band (band 3).
The coefficientsC1=6 andC2=7.5 correct for atmospheric
influences, while L=1 adjusts for the canopy background. The factorG=2.5 is a gain factor.
Another attempt to overcome problems of NDVI satura-tion was proposed by Roujean and Breon (1995), who sug-gested the renormalized difference vegetation index (RDVI), which combines advantages of DVI (NIR-red) and NDVI for low and high vegetation cover, respectively:
RDVI=√(ρNIR−ρred) (ρNIR+ρred)
. (4)
As a non-linear index, RDVI is not only less sensitive to vari-ations in geometrical and optical properties of unknown fo-liage but also less affected by solar and viewing geometry (Broge and Leblanc, 2001).
The NIR and shortwave infrared (SWIR) bands are af-fected by the same ground properties, except that SWIR bands are also strongly sensitive to equivalent water thick-ness. Fensholt and Sandholt (2003) proposed a vegetation in-dex, the shortwave infrared water stress index (SIWSI), using NIR and SWIR bands to estimate drought stress for vegeta-tion in semi-arid environments:
SIWSI12=
(ρNIR−ρSWIR12) (ρNIR+ρSWIR12)
(5) SIWSI16=
(ρNIR−ρSWIR16) (ρNIR+ρSWIR16)
, (6)
where ρSWIR12 is NBAR band 5 (1230–1250 nm) and ρSWIR16 is NBAR band 6 (1628–1652 nm). As the
vegeta-tion water content increases, reflectance in SWIR decreases, indicating that low and high SIWSI values point to sufficient water conditions and drought stress, respectively. The vege-tation indices RDVI, SIWSI12and SIWSI16were calculated
based on NBAR bands 1, 2, 5 and 6. 2.3.3 Incoming PAR across the Sahel
A modified version of the ERA Interim reanalysis PAR was used in the current study as there was an error in the code pro-ducing these PAR estimates; the estimates were generally too low (ECMWF, 2016b). Accordingly, incoming PAR at the ground surface from ERA Interim was systematically under-estimated even though it followed the pattern of PAR mea-sured at the six Sahelian EC sites (Fig. S1 in Supplement). In order to correct for this error, we fitted and applied an ordi-nary least squares linear regression between in situ PAR and ERA Interim PAR (Fig. S1). The PAR produced from this re-lationship is at the same level as in situ PAR and should be at a correct level even though the original ERA Interim PAR is actually produced from the red and near-infrared part of the spectrum.
2.4 Data analysis
2.4.1 Coupling temporal and spatial dynamics in photosynthetic capacity and quantum efficiency with explanatory variables
in-dices for all sites combined were also analysed. In the anal-ysis for all sites, data were normalized to avoid influence of spatial and inter-annual variability. Time series of ratios of Foptandα(Fopt_fracandαfrac)against the annual peak
val-ues (Fopt_peakandαpeak; see below for calculation of annual
peak values) were estimated for all sites: Fopt_frac=
Fopt Fopt_peak
(7) αfrac=
α αpeak
. (8)
The same standardization procedure was used for all vegeta-tion indices (VIfrac):
VIfrac=
VI VIpeak
, (9)
where VIpeak is the annual peak values of the vegetation
in-dices (14-day running mean with highest annual value). The αfrac and Fopt_frac were correlated with the different VIfrac
to investigate the coupling between intra-annual dynamics in Foptandαand the vegetation indices for all sites.
Regression trees were used to fill gaps in the daily esti-mates of Fopt and α. Based on 100 cross-validation runs,
100 tree sizes were chosen, and these trees were then used to estimate Fopt andαfollowing the method in De’ath and
Fabricius (2000). We used SWC, VPD, Tair, PAR and the
vegetation index with the strongest correlation with intra-annual dynamics as explanatory variables in the analysis. In the analysis for all sites, the same standardization procedure as done forFopt,αand the vegetation indices was done for
the hydrometeorological variables. The 100Foptandα
out-put subsets from the regression trees were averaged and used for filling gaps in the times series ofFoptandα. From these
time series, we estimated annual peak values of Foptandα
(Fopt_peak andαpeak)as the 14-day running mean with the
highest annual value. To investigate spatial and inter-annual variability inFoptandαacross the measurement sites of the
Sahel, Fopt_peak andαpeak were correlated with the annual
sum of P; yearly means of Tair, SWC, RH, VPD andRg;
annual peak values of biomass; soil nitrogen and C concen-trations; the C3/C4 ratio; and VIpeak.
2.4.2 Parameterization and evaluation of the GPP model and evaluation of the MODIS GPP
On the basis of Eq. (1) and the outcome of the statistical anal-ysis previously described under Sect. 2.4.1 (for results, see Sect. 3.2), a model for estimating GPP across the Sahel was created:
GPP= −Fopt×
1−e −
α×PAR
Fopt
. (10)
Firstly,Fopt_peakandαpeakwere estimated spatially and
inter-annually using linear regression functions fitted against the
vegetation indices, with the strongest relationships to spa-tial and inter-annual variability inFopt_peakandαpeakfor all
sites. Secondly, exponential regression functions were estab-lished forFopt_fracandαfracwith the vegetation index, with
the strongest relationships with intra-annual variability of Fopt_fracandαfracfor all sites. By combining these
relation-ships,Foptandαcan be calculated for any day of year and
for any point in space across the Sahel: Fopt=Fopt_peak×Fopt_frac
= kFopt×NDVIpeak+mFopt
nFopt×e
lFopt×RDVIfrac
(11) α=αpeak×αfrac= kα×RDVIpeak+mα
nα×e(lα×RDVIfrac)
, (12)
wherekFopt and kα are slopes and mFopt andmα are
inter-cepts of the linear regressions, givingFopt_peakandαpeak,
re-spectively;lFopt andlα are coefficients andnFopt andnα are
intercepts of the exponential regressions, givingFopt_fracand αfrac, respectively. Equations (11) and (12) were inserted into
Eq. (10), and GPP was thereby estimated as GPP= − Fopt_peak×Fopt_frac
×
1−e −
(αpeak×αfrac)×PAR
Fopt_peak×Fopt_frac
=
− kFopt×NDVIpeak+mFopt
nFopt×e
lFopt×RDV Ifrac
×
1−e
−(kα×RDVIpeak+mα)
nα×e(lα×RDVIfrac)×PAR
kFopt×NDVIpeak+mFopt
lFopt×RDVIfrac+nFopt
!
. (13)
A bootstrap simulation methodology was used when fitting the least squares regression functions for parameterization of the GPP model (Richter et al., 2012). For each of the itera-tions, some of the EC site years were included and some were omitted. The bootstrap simulations generated 200 sets of kFopt,kα,mFopt,mα,lFopt,lα,nFopt,nα and coefficient of
de-termination (R2). Possible errors (e.g. random sampling er-rors, aerosols, electrical sensor noise, filtering and gap-filling errors, clouds and satellite sensor degradation) can be present in both the predictor and the response variables. Hence, we selected reduced major axis regressions to account for er-rors in both predictor and response variables when fitting the regression functions. The regression models were validated against the omitted site years within the bootstrap simulation methodology by calculating the RMSE and by fitting an or-dinary least square linear regression between modelled and independent variables.
Figure 2. Evaluation of the MODIS-based GPP product MOD17A2H (collection 6) against eddy-covariance-based GPP from the six measurement sites (Fig. 1). The thick black line shows the one-to-one ratio and the grey dotted line, the fitted ordinary least squares regression.
sites by calculating the RMSE and by fitting an ordinary least square linear regression.
3 Results
3.1 Evaluation of the MODIS GPP product
There was a strong linear relationship between the MODIS GPP product (MOD17A2H; collection 6) and independent GPP (slope=0.17; intercept=0.11 g C m−2d−1;R2=0.69; n=598). However, MOD17A2H strongly underestimated independent GPP (Fig. 2), resulting in a high RMSE (2.69 g C m−2d−1). It can be seen that some points for the Kelma site were quite low for MOD17A2H, whereas they were relatively high for the independent GPP (Fig. 2). Kelma is an inundated Acacia forest located in a clay soil depres-sion. These differentiated values were found in the beginning of the dry season, when the depression was still inundated, whereas the larger area was turning dry.
3.2 Intra-annual dynamics in photosynthetic capacity and quantum efficiency
Intra-annual dynamics in Foptandαdiffered in amplitude,
[image:7.612.307.550.66.394.2]but were otherwise similar across the measurement sites in the Sahel (Fig. 3). There was no green ground vegetation during the dry season, and the low photosynthetic activity was due to few evergreen trees. This resulted in low values
Figure 3.Time series of photosynthetic capacity (Fopt)and quan-tum efficiency (α)for the six measurement sites. Also included are time series of the vegetation indices with highest correlation with Fopt(VIFopt)and quantum efficiency (VIα; Table 2). The sites are (a)Agoufou (ML-AgG),(b)Dahra (SN-Dah),(c)Demokeya (SD-Dem),(d)Kelma (ML-Kem),(e)Wankama Fallow (NE-WaF) and (f)Wankama Millet (NE-WaM).
for bothFoptandαduring the dry season. The vegetation
re-sponded strongly to rainfall, and bothFoptandαincreased
during the early phase of the rainy season. Generally,Fopt
peaked slightly earlier thanα(average±1 SD: 7±10 days; Fig. 3).
All vegetation indices described intra-annual dynamics in Foptreasonably well at all sites (Table 2). The vegetation
in-dex SIWSI12 had the highest correlation for all sites except
Wankama Millet, where it was RDVI. When all sites were combined, all indices described seasonality inFoptwell, but
RDVI had the strongest correlation (Table 2).
Table 2.Correlation between intra-annual dynamics in photosynthetic capacity (Fopt;Fopt_fracfor all sites), quantum efficiency (α;α_frac for all sites) and the different vegetation indices for the six measurement sites (Fig. 1). Values are averages±1 SD generated from 200 bootstrapping runs. The bold values are the indices with the strongest correlation. EVI is the enhanced vegetation index, NDVI is the normalized difference vegetation index, RDVI is the renormalized difference vegetation index and SIWSI is the shortwave infrared water stress index. SIWSI12is based on the MODIS NBAR bands 2 and 5, whereas SIWSI16is based on MODIS NBAR bands 2 and 6.
Fopt α
Measurement site EVI NDVI RDVI SIWSI12 SIWSI16 EVI NDVI RDVI SIWSI12 SIWSI16
ML-AgG 0.89±0.02 0.87±0.02 0.95±0.01 −0.95±0.01 −0.93±0.02 0.92±0.02 0.91±0.01 0.96±0.01 −0.94±0.01 −0.88±0.02 SN-Dah 0.92±0.005 0.91±0.01 0.96±0.003 −0.96±0.004 −0.93±0.01 0.89±0.01 0.90±0.01 0.93±0.01 −0.92±0.01 −0.87±0.01 SD-Dem 0.81±0.01 0.78±0.01 0.91±0.01 −0.93±0.01 −0.90±0.01 0.76±0.02 0.73±0.02 0.86±0.01 −0.82±0.02 −0.79±0.02 MA-Kem 0.77±0.02 0.83±0.02 0.95±0.01 −0.95±0.01 −0.90±0.02 0.69±0.05 0.73±0.04 0.80±0.03 −0.77±0.03 −0.76±0.03 NE-WaF 0.87±0.02 0.81±0.02 0.78±0.02 −0.90±0.01 −0.80±0.02 0.89±0.01 0.84±0.01 0.85±0.01 −0.88±0.01 −0.79±0.01 NE-WaM 0.41±0.05 0.50±0.04 0.72±0.03 −0.55±0.04 −0.43±0.05 0.72±0.02 0.76±0.02 0.81±0.01 −0.75±0.01 −0.72±0.01 All sites 0.86±0.0 0.79±0.0 0.90±0.0 0.75±0.0 0.70±0.0 0.83±0.01 0.80±0.01 0.86±0.01 0.62±0.01 0.54±0.01
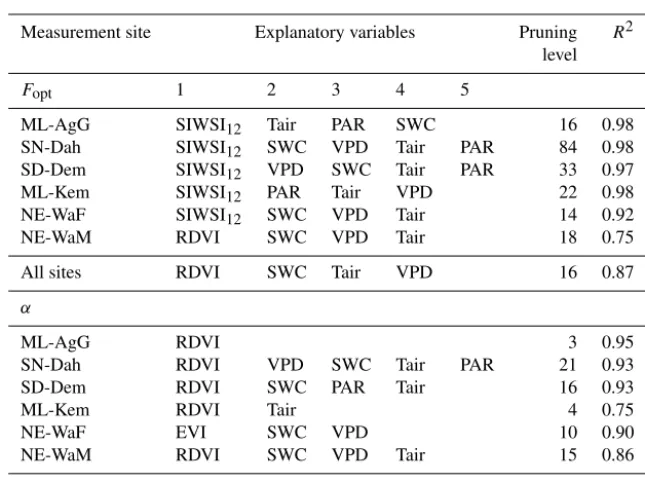
Table 3.Statistics for the regression tree analysis. Regression tree analysis was used to study relationships between intra-annual dynamics in photosynthetic capacity (Fopt;Fopt_fracfor all sites) and quantum efficiency (α;α_fracfor all sites) and explanatory variables. The pruning level is the number of splits of the regression tree and an indication of complexity of the system.
Measurement site Explanatory variables Pruning R2 level
Fopt 1 2 3 4 5
ML-AgG SIWSI12 Tair PAR SWC 16 0.98
SN-Dah SIWSI12 SWC VPD Tair PAR 84 0.98 SD-Dem SIWSI12 VPD SWC Tair PAR 33 0.97
ML-Kem SIWSI12 PAR Tair VPD 22 0.98
NE-WaF SIWSI12 SWC VPD Tair 14 0.92
NE-WaM RDVI SWC VPD Tair 18 0.75
All sites RDVI SWC Tair VPD 16 0.87
α
ML-AgG RDVI 3 0.95
SN-Dah RDVI VPD SWC Tair PAR 21 0.93
SD-Dem RDVI SWC PAR Tair 16 0.93
ML-Kem RDVI Tair 4 0.75
NE-WaF EVI SWC VPD 10 0.90
NE-WaM RDVI SWC VPD Tair 15 0.86
All sites RDVI SWC VPD Tair 16 0.84
The regression trees used for gap-filling explained the intra-annual dynamics in Fopt andαwell for all sites
(Ta-ble 3; Fig. S2). The regression trees explained intra-annual dynamics inFoptbetter than inα, and multi-year sites were
better predicted than single-year sites (Fig. S2). The main ex-planatory variables coupled to intra-annual dynamics inFopt
for all sites across the Sahel were on the order of RDVI, SWC, VPD, Tair and PAR. For α, they were RDVI, SWC,
VPD and Tair (Table 3). The strong relationship to SWC
and VPD indicates drought stress during periods of low rain-fall. For all sites across the Sahel, incorporating hydromete-orological variables increased the ability to determine intra-annual dynamics inFoptandαcompared to the ordinary least
square linear regressions against vegetation indices (Table 2, data given asr; Table 3; Figs. 3 and S2). For all sites,
incor-poration of these variables increasedR2 from 0.81 to 0.87 and from 0.74 to 0.84 forFoptandα, respectively.
3.3 Spatial and inter-annual dynamics in
photosynthetic capacity and quantum efficiency
Large spatial and inter-annual variability in Fopt_peak
and αpeak were found across the six measurement
sites; Fopt_peak ranged between 10.1 (Wankama
Mil-let 2005) and 50.0 µmol CO2m−2s−1 (Dahra 2010), and αpeak ranged between 0.020 (Demokeya 2007) and
0.064 µmol CO2µmol PAR−1 (Dahra 2010; Table 4).
The average 2-week running mean peak values of Fopt
and α for all sites were 26.4 µmol CO2m−2s−1 and
[image:8.612.136.459.279.520.2]Table 4. Annual peak values of quantum efficiency (αpeak; µmol CO2µmol PAR−1) and photosynthetic capacity (Fopt_peak; µmol CO2m−2s−1) for the six measurement sites (Fig. 1). The peak values are the 2-week running mean with highest annual value.
Measurement site Year αpeak Fopt_peak
ML-AgG 2007 0.0396 24.5 SN-Dah 2010 0.0638 50.0 2011 0.0507 42.3 2012 0.0480 39.2 2013 0.0549 40.0 SD-Dem 2007 0.0257 16.5 2008 0.0327 21.0 2009 0.0368 16.5 ML-Kem 2007 0.0526 33.5 NE-WaF 2005 0.0273 18.2 2006 0.0413 21.0 NE-WaM 2005 0.0252 10.6 2006 0.0200 10.1
Average 0.0399 26.4
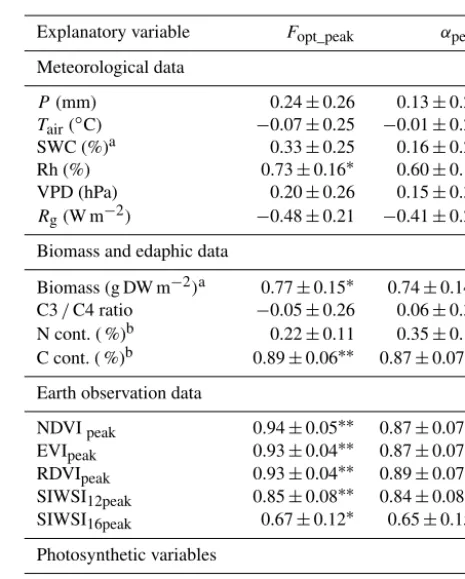
indices determined spatial and inter-annual dynamics well in bothFopt_peakandαpeak(Table 5);Fopt_peakwas most closely
coupled with NDVIpeak, whereas αpeak was more closely
coupled with RDVIpeak(Fig. 4).Fopt_peakalso correlated well
with peak dry weight biomass, C content in the soil and RH, whereasαpeak also correlated with peak dry weight biomass
and C content in the soil (Table 5).
3.4 Spatially extrapolated photosynthetic capacity, quantum efficiency and gross primary production across the Sahel and evaluation of the GPP model
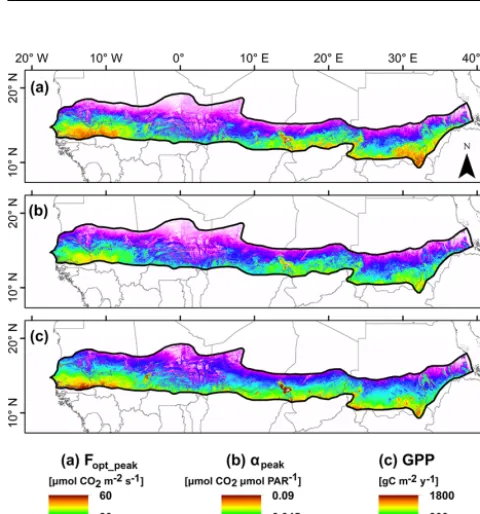
The spatially extrapolated Fopt, α and GPP averaged
over the Sahel for 2001–2014 were 22.5±1.7 µmol CO2
m−2 s−1, 0.030±0.002 µmol CO2 µmol PAR−1 and
736±39 g C m−2yr−1, respectively. At a regional scale, it can be seen thatFopt,αand GPP decreased substantially with
latitude (Fig. 5). The highest values were found in south-eastern Senegal, western Mali, in parts of southern Sudan and on the border between Sudan and South Sudan. The lowest values were found along the northernmost parts of the Sahel on the border to the Sahara in Mauritania, in northern Mali and in northern Niger.
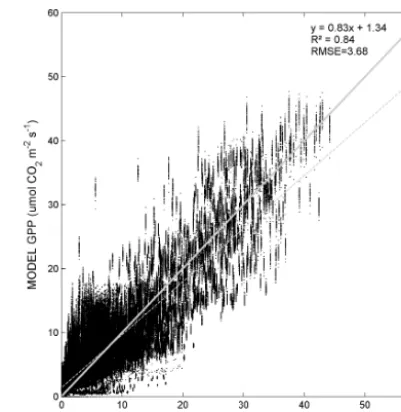
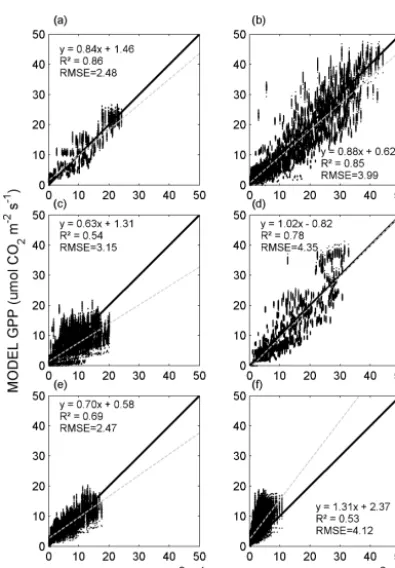
[image:9.612.310.543.227.517.2]Modelled GPP was similar to independent GPP on aver-age, and there was a strong linear relationship between mod-elled GPP and independent GPP for all sites (Fig. 6; Table 6). However, when separating the evaluation between measure-ment sites, it can be seen that the model reproduced some sites better than others (Fig. 7; Table 6). Wankama Millet was generally overestimated, whereas on average the model worked well for Demokeya but underestimated high values (Fig. 7; Table 6). Variability of independent GPP at the other
Table 5.Correlation matrix between annual peak values of photo-synthetic capacity (Fopt_peak)and quantum efficiency (αpeak)and measured environmental variables: annual rainfall (P); yearly av-erages of air temperature at 2 m height (Tair), soil water content measured at 0.1 m depth (SWC; % volumetric water content), rel-ative humidity (Rh), vapour pressure deficit (VPD) and incoming global radiation (Rg); soil nitrogen (N) and carbon (C) contents; and annual peak values of the normalized difference vegetation index (NDVIpeak), the enhanced vegetation index (EVIpeak), the renor-malized difference vegetation index (RDVIpeak), the shortwave in-frared water stress index based on MODIS NBAR bands 2 and 5 (SIWSI12peak), and the SIWSI based on MODIS NBAR bands 2 and 6 (SIWSI16peak). Sample size was 13 for all except the marked explanatory variables.
Explanatory variable Fopt_peak αpeak
Meteorological data
P (mm) 0.24±0.26 0.13±0.27
Tair(◦C) −0.07±0.25 −0.01±0.25 SWC (%)a 0.33±0.25 0.16±0.27 Rh (%) 0.73±0.16∗ 0.60±0.19 VPD (hPa) 0.20±0.26 0.15±0.30 Rg(W m−2) −0.48±0.21 −0.41±0.24
Biomass and edaphic data
Biomass (g DW m−2)a 0.77±0.15∗ 0.74±0.14∗ C3/C4 ratio −0.05±0.26 0.06±0.30 N cont. ( %)b 0.22±0.11 0.35±0.14 C cont. ( %)b 0.89±0.06∗∗ 0.87±0.07∗∗
Earth observation data
NDVIpeak 0.94±0.05∗∗ 0.87±0.07∗∗ EVIpeak 0.93±0.04∗∗ 0.87±0.07∗∗ RDVIpeak 0.93±0.04∗∗ 0.89±0.07∗∗ SIWSI12peak 0.85±0.08∗∗ 0.84±0.08∗∗ SIWSI16peak 0.67±0.12∗ 0.65±0.15∗
Photosynthetic variables
Fopt – 0.94±0.03∗∗
aSample size equals 11.bSample size equals 9.∗Significant at 0.05 level. ∗∗Significant at 0.01 level.
sites was reproduced by the model reasonably well (Fig. 7; Table 6). The final parameters of the GPP model (Eq. 13) are shown in Table 7.
4 Discussion
Our hypothesis that vegetation indices closely related to SI-WSI would be most strongly coupled with intra-annual dy-namics in Fopt and α was not rejected for Fopt since this
Figure 4.Scatter plots of annual peak values for the six measurement sites (Fig. 1) of(a)photosynthetic capacity (Fopt_peak)and(b)quantum efficiency (αpeak)against peak values of normalized difference vegetation index (NDVIpeak)and renormalized difference vegetation index (RDVIpeak), respectively. The annual peak values were estimated by taking the annual maximum of a 2-week running mean.
Table 6.Statistics regarding the evaluation of the gross primary production (GPP) model for the six measurement sites (Fig. 1). In situ and modelled GPP are averages±1 SD. RMSE is the root mean square error, and slope, intercept andR2are from the fitted ordinary least square linear regressions.
Measurement In situ GPP Modelled GPP RMSE Slope Intercept R2
site (µmol CO2m−2s−1) (µmol CO2m−2s−1) (µmol CO2m−2s−1) (µmol CO2m−2s−1)
ML-AgG 5.35±6.38 5.97±5.80 2.48±0.10 0.84±0.003 1.46±0.01 0.86±0.002 SN-Dah 9.39±10.17 8.87±9.67 3.99±1.34 0.88±0.002 0.62±0.01 0.85±0.001 SD-Dem 4.26±4.55 3.98±3.90 3.15±1.06 0.63±0.003 1.31±0.007 0.54±0.02 ML-Kem 11.16±8.02 10.52±9.22 4.35±1.23 1.02±0.003 −0.82±0.03 0.78±0.002 NE-WaF 5.77±4.17 6.63±3.53 2.47±1.05 0.70±0.005 2.58±0.02 0.69±0.003 NE-WaM 3.04±1.93 6.35±3.47 4.12±0.99 1.31±0.004 2.37±0.02 0.53±0.003 Average 6.73±7.72 7.02±7.39 3.68±0.55 0.83±0.07 1.34±0.82 0.84±0.07
Figure 5. Maps of (a) peak values of photosynthetic capacity (Fopt_peak)averaged for 2001–2014,(b)peak values of quantum efficiency (αpeak)averaged for 2001–2014 and(c)annual budgets of GPP averaged for 2001–2014.
Table 7.The parameters for Eq. (13) that were used in the final gross primary production (GPP) model. RMSE is the root mean square error, andR2is the coefficient of determination for the re-gression models predicting the different variables.
Parameter Value RMSE R2
kFopt 79.6±6.3 5.1±1.3 0.89±0.05 mFopt −7.3±3.2
lFopt 3.51±0.19 0.15±0.02 0.88±0.06 nFopt 0.03±0.006
α 0.16±0.02 0.0069±0.0021 0.81±0.10 mFopt −0.014±0.007
lFopt 3.75±0.27 0.20±0.02 0.80±0.10 nFopt 0.02±0.007
abundance (RDVI and EVI). In the Sahel, soil moisture con-ditions in the early rainy season are important for vegetation growth, and during this phase vegetation is especially vulner-able to drought conditions (Rockström and de Rouw, 1997; Tagesson et al., 2016a; Mbow et al., 2013). Photosynthetic capacity (Fopt)peaked earlier than α did in the rainy
sea-son (Fig. 3), thereby explaining the close relationship ofFopt
[image:10.612.47.287.383.640.2] [image:10.612.306.549.451.568.2]increase in leaf area index increased canopy level quantum efficiency (α), thereby explaining the closer relationship of αwith RDVI.
Our hypothesis that vegetation indices closely related to chlorophyll abundance would be most strongly coupled with spatial and inter-annual dynamics inFoptandαwas not
re-jected for eitherFoptorα; NDVI, EVI and RDVI all
corre-lated with spatial and inter-annual dynamics in Fopt andα
(Table 5). However, it was surprising that NDVIpeak had the
strongest correlation with spatial and inter-annual variability inFopt(Table 5). Both EVI and RDVI should be less sensitive
to saturation effects than NDVI (Huete et al., 2002; Roujean and Breon, 1995), and based on this it can be assumed that peak values of these indices should have stronger relation-ships with peak values of Fopt andα. However, vegetation
indices with a high sensitivity to changes in green biomass at high biomass loads become less sensitive to green biomass changes at low biomass loads (Huete et al., 2002). The peak leaf area index for ecosystems across the Sahel is generally ∼2 m2m−2 or less, whereas the saturation issue of NDVI generally starts at a leaf area index of about 2–5 m2m−2 (Haboudane et al., 2004).
TheFopt_peakestimates from Agoufou, Demokeya and the
Wankama sites were similar, whereas Dahra and Kelma val-ues were high in relation to previously reported canopy-scaleFopt_peakfrom the Sahel (∼ −8 to−23 µmol m−2s−1;
Hanan et al., 1998; Merbold et al., 2009; Moncrieff et al., 1997; Boulain et al., 2009; Levy et al., 1997; Monteny et al., 1997). These previous studies reported much lower Fopt at canopy scale than at leaf scale (e.g. Levy et al.,
1997: 10 vs. 44 µmol m−2s−1; Boulain et al., 2009: 8 vs. 50 µmol m−2s−1). The leaf area index at Dahra and Kelma
peaked at 2.1 and 2.7, respectively (Timouk et al., 2009; Tagesson et al., 2015a), and it was substantially higher than at the above-mentioned sites. A possible explanation for high Fopt estimates at Dahra and Kelma could therefore be the
higher leaf area index. Tagesson et al. (2016b) performed a quality check of the EC data due to the high net CO2
ex-change measured at the Dahra field site and explained the high values by a combination of moderately dense herba-ceous C4 ground vegetation, high soil nutrient availability and a grazing pressure resulting in compensatory growth and fertilization effects. Another possible explanation could be that the West African monsoon brings a humid layer of sur-face air from the Atlantic, possibly increasing vegetation pro-duction for the most western part of the Sahel (Tagesson et al., 2016a).
[image:11.612.326.527.64.270.2]Our model substantially overestimated GPP for Wankama Millet (Fig. 7f). Being a crop field, this site differed from the other sites in its species composition and ecosystem struc-ture, as well as land and vegetation management. Crop fields in southwestern Niger are generally characterized by rather low production, resulting from decreased fertility and soil loss caused by intensive land use (Cappelaere et al., 2009). These specifics of the Wankama Millet site may cause the
Figure 6. Evaluation of the modelled gross primary production (GPP; Eq. 13) against in situ GPP from all six measurement sites. The thick grey line shows the one-to-one ratio, whereas the thin dotted grey line is the fitted ordinary least square regression.
model, parameterized with observations from the other study sites without this strong anthropogenic influence, to overesti-mate GPP at this site. Similar results were found by Boulain et al. (2009) when applying an upscaling model using leaf area index for Wankama Millet and Wankama Fallow. It worked well for Wankama fallow, whereas it was less con-clusive for Wankama Millet. The main explanation for this difference was low leaf area index in millet fields because of a low density of millet stands due to agricultural practice. There is extensive savanna clearing for food production in the Sahel (Leblanc et al., 2008; Boulain et al., 2009; Cappelaere et al., 2009). To further understand impacts of this land cover change on vegetation production and land–atmosphere ex-change processes, there is an urgent need for more study sites covering cropped areas in this region.
In Demokeya, GPP was slightly underestimated for 2008 (Fig. 7c) because modelledFoptwas much lower than the
ac-tual measured value in 2008 (the thick black line in Fig. 4). An improvement of the model could be to incorporate some parameters that constrain or enhanceFoptdepending on
en-vironmental stress. Indeed, the regression tree analysis dicated that incorporating hydrometeorological variables in-creased the ability to predict bothFoptandα. Conversely, for
Figure 7. Evaluation of the modelled gross primary production (GPP; Eq. 13) against in situ GPP for the six sites across the Sahel (Fig. 1). The thick black lines show the one-to-one ratios, whereas the dotted thin grey lines are the fitted ordinary least square regres-sions. The sites are(a)Agoufou (ML-AgG),(b)Dahra (SN-Dah), (c)Demokeya (SD-Dem),(d)Kelma (ML-Kem),(e)Wankama Fal-low (NE-WaF) and(f)Wankama Millet (NE-WaM).
largest dryland areas in the world, which includes only a few sites of hydrometeorological observations.
The pattern seen in the spatially explicit GPP budgets (Fig. 5c) may be influenced by a range of biophysical and anthropogenic factors. The clear north–south gradient is ex-pected given the strong north–south rainfall gradient in the Sahel. The West African monsoon mentioned above could also be an explanation of high GPP values in the western part of the Sahel, where values were relatively high in relation to GPP at similar latitudes in the central and eastern Sahel (Fig. 5c). The areas with the highest GPP are sparsely popu-lated woodlands or shrubby savanna with a relatively dense tree cover (Brandt et al., 2016). However, the maps produced here should be used with caution as they are based on upscal-ing of data collected at only six EC sites available in the re-gion, especially given the issues related to the cropped fields discussed earlier. Still, the average GPP budget for the entire Sahel 2001–2014 was close to an average annual GPP budget estimated at these six sites (692±89 g C m−2yr−1; Tagesson et al., 2016a). The range of GPP budgets in Fig. 5c is also similar to previous annual GPP budgets reported from other
savannas across the world (Veenendaal et al., 2004; Chen et al., 2003, 2006; Kanniah et al., 2010).
Although MOD17A2 GPP has previously been shown to capture GPP in several ecosystems types well (Turner et al., 2006, 2005; Heinsch et al., 2006; Sims et al., 2006; Kanniah et al., 2009), it has been shown to underestimate it in others (Coops et al., 2007; Gebremichael and Bar-ros, 2006; Sjöström et al., 2013). Gross primary produc-tion of Sahelian drylands have not been captured well by MOD17A2 (Sjöström et al., 2013; Fensholt et al., 2006), and as we have shown, this underestimation persists in the latest MOD17A2H GPP (collection 6) product (Fig. 2). The main reason for this pronounced underestimation is that maximum LUE is set to 0.84 g C MJ−1 (open shrub-land, Demokeya) and 0.86 g C MJ−1 (grassland; Agoufou, Dahra, Kelma; Wankama Millet and Wankama Fallow) in the BPLUT, i.e. much lower than maximum LUE mea-sured at the Sahelian measurement sites of this study (av-erage: 2.47 g C MJ−1; range: 1.58–3.50 g C MJ−1; Sjöström et al., 2013; Tagesson et al., 2015a), a global estimate of ∼1.5 g C MJ−1 (Garbulsky et al., 2010) and a savanna site in Australia (1.26 g C MJ−1; Kanniah et al., 2009).
Several dynamic global vegetation models have been used for decades to quantify GPP at different spatial and temporal scales (Dickinson, 1983; Sellers et al., 1997). These models are generally based on the photosynthesis model of Farquhar et al. (1980), a model particularly sensitive to uncertainty in photosynthetic capacity (Zhang et al., 2014). This and several previous studies have shown that both photosynthetic capac-ity and efficiency (bothα and LUE) can vary considerably between seasons as well as spatially vary, and both within and between vegetation types (Eamus et al., 2013; Garbul-sky et al., 2010; Ma et al., 2014; Tagesson et al., 2015a). This variability is difficult to estimate using broad values based on land cover classes, yet most models apply a constant value, which can cause substantial inaccuracies in the esti-mates of seasonal and spatial variability in GPP. This is par-ticularly a problem in savannas that consist of several plant functional types (C3 and C4 species, and a large variability in tree and/or herbaceous vegetation fractions; Scholes and Archer, 1997). This study indicates the applicability of EO as a tool for parameterizing spatially explicit estimates of plant physiological variables, which could improve our ability to simulate GPP. Spatially explicit estimates of GPP at a high temporal and spatial resolution are essential for environmen-tal change studies in the Sahel and can contribute to increased knowledge regarding changes in GPP, its relationship to cli-matic change and anthropogenic forcing, and simulations of ecosystem processes and hydro-biochemical cycles.
levtype=sfc/). The data products from this study are available from the corresponding author upon request.
The Supplement related to this article is available online at doi:10.5194/bg-14-1333-2017-supplement.
Competing interests. The authors declare that they have no conflict of interest.
Acknowledgements. Data are available from Fluxnet (http://fluxnet.ornl.gov) and CarboAfrica (http://www.carboafrica. net/indexen.asp). Data for the Mali and Niger sites were made available by the AMMA-CATCH regional observatory (www.amma-catch.org), which is funded by the French Institut de Recherche pour le Développement (IRD) and Institut National des Sciences de l’Univers (INSU). The project was funded by the Danish Council for Independent Research (DFF) Sapere Aude programme. The Faculty of Science, Lund University supported the Dahra and Demokeya measurements with an infrastructure grant. Torbern Tagesson and Jonas Ardö received support from the Swedish National Space Board. We would like to thank the editor Charles Bourque, the reviewer Niall Hanan and the anonymous reviewer for a very constructive and thorough critique that significantly helped improve the paper.
Edited by: C. Bourque
Reviewed by: N. P. Hanan and one anonymous referee
References
Abdi, A., Seaquist, J., Tenenbaum, D., Eklundh, L., and Ardö, J.: The supply and demand of net primary production in the Sahel, Environ. Res. Lett., 9, 1–11, doi:10.1088/1748-9326/9/9/094003, 2014.
Ahlström, A., Raupach, M. R., Schurgers, G., Smith, B., Arneth, A., Jung, M., Reichstein, M., Canadell, J. G., Friedlingstein, P., Jain, A. K., Kato, E., Poulter, B., Sitch, S., Stocker, B. D., Viovy, N., Wang, Y. P., Wiltshire, A., Zaehle, S., and Zeng, N.: The dominant role of semi-arid ecosystems in the trend and variability of the land CO2 sink, Science, 348, 895–899, doi:10.1126/science.aaa1668, 2015.
Baldocchi, D., Falge, E., Gu, L., Olson, R., Hollinger, D., Running, S., Anthoni, P., Bernhofer, C., Davis, K., Evans, R., Fuentes, J., Goldstein, A., Katul, G., Law, B., Lee, X., Malhi, Y., Meyers, T., Munger, W., Oechel, W., Paw, K. T., Pilegaard, K., Schmid, H. P., Valentini, R., Verma, S., Vesala, T., Wilson, K., and Wofsy, S.: FLUXNET: A New Tool to Study the Temporal and Spatial Vari-ability of Ecosystem–Scale Carbon Dioxide, Water Vapor, and Energy Flux Densities, B. Am. Meteorol. Soc., 82, 2415–2434, doi:10.1175/1520-0477(2001)082<2415:fantts>2.3.co;2, 2001. Boulain, N., Cappelaere, B., Ramier, D., Issoufou, H. B. A.,
Halilou, O., Seghieri, J., Guillemin, F., Oï, M., Gignoux, J., and Timouk, F.: Towards an understanding of coupled phys-ical and biologphys-ical processes in the cultivated Sahel – 2.
Vegetation and carbon dynamics, J. Hydrol., 375, 190–203, doi:10.1016/j.jhydrol.2008.11.045, 2009.
Brandt, M., Hiernaux, P., Rasmussen, K., Mbow, C., Kergoat, L., Tagesson, T., Ibrahim, Y. Z., Wélé, A., Tucker, C. J., and Fen-sholt, R.: Assessing woody vegetation trends in Sahelian dry-lands using MODIS based seasonal metrics, Remote Sens. Envi-ron., 183, 215–225, doi:10.1016/j.rse.2016.05.027, 2016. Broge, N. H. and Leblanc, E.: Comparing prediction power and
sta-bility of broadband and hyperspectral vegetation indices for es-timation of green leaf area index and canopy chlorophyll den-sity, Remote Sens. Environ., 76, 156–172, doi:10.1016/S0034-4257(00)00197-8, 2001.
Cannell, M. and Thornley, J.: Temperature and CO2Responses of Leaf and Canopy Photosynthesis: a Clarification using the Non-rectangular Hyperbola Model of Photosynthesis, Ann. Bot., 82, 883–892, 1998.
Cappelaere, B., Descroix, L., Lebel, T., Boulain, N., Ramier, D., Laurent, J. P., Favreau, G., Boubkraoui, S., Boucher, M., Bouzou Moussa, I., Chaffard, V., Hiernaux, P., Issoufou, H. B. A., Le Breton, E., Mamadou, I., Nazoumou, Y., Oi, M., Ottlé, C., and Quantin, G.: The AMMA-CATCH experiment in the cultivated Sahelian area of south-west Niger – Investigating water cycle re-sponse to a fluctuating climate and changing environment, J. Hy-drol., 375, 34–51, doi:10.1016/j.jhydrol.2009.06.021, 2009. Chen, C., Cleverly, J., and Zhang, L.: Modelling Seasonal and
Inter-annual Variations in Carbon and Water Fluxes in an Arid-Zone Acacia Savanna Woodland, 1981–2012, Ecosystems, 19, 625– 644, 2016.
Chen, X., Hutley, L., and Eamus, D.: Carbon balance of a tropical savanna of northern Australia, Oecologia, 137, 405–416, 2003. Coops, N. C., Black, T. A., Jassal, R. S., Trofymow, J. A., and
Morgenstern, K.: Comparison of MODIS, eddy covariance de-termined and physiologically modelled gross primary production (GPP) in a Douglas-fir forest stand, Remote Sens. Environ., 107, 385–401, doi:10.1016/j.rse.2006.09.010, 2007.
Dardel, C., Kergoat, L., Hiernaux, P., Mougin, E., Grippa, M., and Tucker, C. J.: Re-greening Sahel: 30 years of remote sensing data and field observations (Mali, Niger), Remote Sens. Envi-ron., 140, 350–364, doi:10.1016/j.rse.2013.09.011, 2014. De’ath, G. and Fabricius, K. E.: Classification and regression trees:
A powerful yet simple technique for ecological data analysis, Ecology, 81, 3178–3192, doi:10.2307/177409, 2000.
de Ridder, N., Stroosnijder, L., and Cisse, A. M.: Productivity of Sahelian rangelands: a study of the soils, the vegetations and the exploitation of that natural resource, PPS course book, Primary Production in the Sahel, Agricultural University, Wageningen, 1982.
Dickinson, R. E.: Land Surface Processes and Climate–Surface Albedos and Energy Balance, in: Advances in Geophysics, edited by: Barry, S., Elsevier, 305–353, 1983.
Eamus, D., Cleverly, J., Boulain, N., Grant, N., Faux, R., and Villalobos-Vega, R.: Carbon and water fluxes in an arid-zone Acacia savanna woodland: An analyses of seasonal patterns and responses to rainfall events, Agr. Forest Meteorol., 182–183, 225–238, doi:10.1016/j.agrformet.2013.04.020, 2013.
ECMWF: ERA Interim Daily: http://apps.ecmwf.int/datasets/data/ interim-full-daily/levtype=sfc/, last access: 4 April 2016a. ECMWF: ERA-Interim: surface photosynthetically active radiation
(surface PAR) values are too low, available at: https://software. ecmwf.int/wiki/display/CKB, last access: 7 November 2016b. Falge, E., Baldocchi, D., Olson, R., Anthoni, P., Aubinet, M.,
Bern-hofer, C., Burba, G., Ceulemans, R., Clement, R., Dolman, H., Granier, A., Gross, P., Grunwald, T., Hollinger, D., Jensen, N. O., Katul, G., Keronen, P., Kowalski, A., Lai, C. T., Law, B. E., Meyers, T., Moncrieff, J. B., Moors, E., Munger, J. W., Pi-legaard, K., Rannik, U., Rebmann, C., Suyker, A., Tenhunen, J., Tu, K., Verma, S., Vesala, T., Wilson, K., and Wofsy, S.: Gap filling strategies for defensible annual sums of net ecosystem ex-change, Agr. Forest Meteorol., 107, 43–69, 2001.
Farquhar, G. D., Caemmerer, S., and Berry, J. A.: A biochemical model of photosynthetic CO2assimilation in leaves of C3 plants, Planta, 149, 78–90, 1980.
Fensholt, R. and Sandholt, I.: Derivation of a shortwave infrared wa-ter stress index from MODIS near- and shortwave infrared data in a semiarid environment, Remote Sens. Environ., 87, 111–121, doi:10.1016/j.rse.2003.07.002, 2003.
Fensholt, R., Sandholt, I., Rasmussen, M. S., Stisen, S., and Diouf, A.: Evaluation of satellite based primary production modelling in the semi-arid Sahel, Remote Sens. Environ., 105, 173–188, doi:10.1016/j.rse.2006.06.011, 2006.
Fensholt, R., Rasmussen, K., Kaspersen, P., Huber, S., Horion, S., and Swinnen, E.: Assessing Land Degradation/Recovery in the African Sahel from Long-Term Earth Observation Based Pri-mary Productivity and Precipitation Relationships, Remote Sens-ing, 5, 664–686, 2013.
Garbulsky, M. F., Peñuelas, J., Papale, D., Ardö, J., Goulden, M. L., Kiely, G., Richardson, A. D., Rotenberg, E., Veenendaal, E. M., and Filella, I.: Patterns and controls of the variability of radiation use efficiency and primary productivity across terrestrial ecosys-tems, Global Ecol. Biogeogr., 19, 253–267, doi:10.1111/j.1466-8238.2009.00504.x, 2010.
Gates, D. M., Keegan, H. J., Schleter, J. C., and Weidner, V. R.: Spectral Properties of Plants, Appl. Opt., 4, 11–20, 1965. Gebremichael, M. and Barros, A. P.: Evaluation of MODIS
Gross Primary Productivity (GPP) in tropical mon-soon regions, Remote Sens. Environ., 100, 150–166, doi:10.1016/j.rse.2005.10.009, 2006.
Haboudane, D., Miller, J. R., Pattey, E., Zarco-Tejada, P. J., and Strachan, I. B.: Hyperspectral vegetation indices and novel algo-rithms for predicting green LAI of crop canopies: Modeling and validation in the context of precision agriculture, Remote Sens. Environ., 90, 337–352, doi:10.1016/j.rse.2003.12.013, 2004. Hanan, N., Kabat, P., Dolman, J., and Elbers, J. A. N.:
Photosyn-thesis and carbon balance of a Sahelian fallow savanna, Glob. Change Biol., 4, 523–538, 1998.
Heinsch, F. A., Maosheng, Z., Running, S. W., Kimball, J. S., Ne-mani, R. R., Davis, K. J., Bolstad, P. V., Cook, B. D., Desai, A. R., Ricciuto, D. M., Law, B. E., Oechel, W. C., Hyojung, K., Hongyan, L., Wofsy, S. C., Dunn, A. L., Munger, J. W., Bal-docchi, D. D., Liukang, X., Hollinger, D. Y., Richardson, A. D., Stoy, P. C., Siqueira, M. B. S., Monson, R. K., Burns, S. P., and Flanagan, L. B.: Evaluation of remote sensing based terres-trial productivity from MODIS using regional tower eddy flux network observations, IEEE T. Geosci. Remote, 44, 1908–1925, doi:10.1109/TGRS.2005.853936, 2006.
Hickler, T., Eklundh, L., Seaquist, J. W., Smith, B., Ardö, J., Ols-son, L., Sykes, M. T., and Sjöström, M.: Precipitation con-trols Sahel greening trend, Geophys. Res. Lett., 32, L21415, doi:10.1029/2005GL024370, 2005.
Huber, S., Tagesson, T., and Fensholt, R.: An automated field spec-trometer system for studying VIS, NIR and SWIR anisotropy for semi-arid savanna, Remote Sens. Environ., 152, 547–556, 2014. Huete, A., Didan, K., Miura, T., Rodriguez, E. P., Gao, X., and Fer-reira, L. G.: Overview of the radiometric and biophysical perfor-mance of the MODIS vegetation indices, Remote Sens. Environ., 83, 195–213, 2002.
Ide, R., Nakaji, T., and Oguma, H.: Assessment of canopy photo-synthetic capacity and estimation of GPP by using spectral veg-etation indices and the light-response function in a larch forest, Agr. Forest Meteorol., 150, 389–398, 2010.
Inoue, Y., Penuelas, J., Miyata, A., and Mano, M.: Normalized dif-ference spectral indices for estimating photosynthetic efficiency and capacity at a canopy scale derived from hyperspectral and CO2 flux measurements in rice, Remote Sens. Environ., 112, 156–172, 2008.
Jin, H. and Eklundh, L.: A physically based vegetation index for improved monitoring of plant phenology, Remote Sens. Environ., 152, 512–525, doi:10.1016/j.rse.2014.07.010, 2014.
Kanniah, K. D., Beringer, J., Hutley, L. B., Tapper, N. J., and Zhu, X.: Evaluation of Collections 4 and 5 of the MODIS Gross Pri-mary Productivity product and algorithm improvement at a trop-ical savanna site in northern Australia, Remote Sens. Environ., 113, 1808–1822, doi:10.1016/j.rse.2009.04.013, 2009.
Kanniah, K. D., Beringer, J., and Hutley, L. B.: The comparative role of key environmental factors in determining savanna pro-ductivity and carbon fluxes: A review, with special reference to Northern Australia, Prog. Phys. Geogr., 34, 459–490, 2010. Kergoat, L., Lafont, S., Arneth, A., Le Dantec, V., and Saugier,
B.: Nitrogen controls plant canopy light-use efficiency in tem-perate and boreal ecosystems, J. Geophys. Res., 113, 1–19, doi:10.1029/2007JG000676, 2008.
Leblanc, M. J., Favreau, G., Massuel, S., Tweed, S. O., Loireau, M., and Cappelaere, B.: Land clearance and hydrological change in the Sahel: SW Niger, Global Planet. Change, 61, 135–150, doi:10.1016/j.gloplacha.2007.08.011, 2008.
Levy, P. E., Moncrieff, J. B., Massheder, J. M., Jarvis, P. G., Scott, S. L., and Brouwer, J.: CO2fluxes at leaf and canopy scale in mil-let, fallow and tiger bush vegetation at the HAPEX-Sahel south-ern super-site, J. Hydrol., 188, 612–632, doi:10.1016/S0022-1694(96)03195-2, 1997.
savanna GPP using MODIS EVI, Remote Sens. Environ., 154, 253–271, doi:10.1016/j.rse.2014.08.025, 2014.
Mayaux, P., Bartholomé, E., Massart, M., Cutsem, C. V., Cabral, A., Nonguierma, A., Diallo, O., Pretorius, C., Thompson, M., Cherlet, M., Pekel, J.-F., Defourny, P., Vasconcelos, M., Grego-rio, A. D., Fritz, S., Grandi, G. D., Elvidge, C., Vogt, P., and Bel-ward, A.: EUR 20665 EN, A Land-cover map of Africa, edited by: Centre, E. C. J. R., European Commisions Joint Research Centre, Luxembourg, 38 pp., 2003.
Mbow, C., Fensholt, R., Rasmussen, K., and Diop, D.: Can vege-tation productivity be derived from greenness in a semi-arid en-vironment? Evidence from ground-based measurements, J. Arid Environ., 97, 56–65, doi:10.1016/j.jaridenv.2013.05.011, 2013. Merbold, L., Ardö, J., Arneth, A., Scholes, R. J., Nouvellon, Y.,
de Grandcourt, A., Archibald, S., Bonnefond, J. M., Boulain, N., Brueggemann, N., Bruemmer, C., Cappelaere, B., Ceschia, E., El-Khidir, H. A. M., El-Tahir, B. A., Falk, U., Lloyd, J., Kergoat, L., Le Dantec, V., Mougin, E., Muchinda, M., Muke-labai, M. M., Ramier, D., Roupsard, O., Timouk, F., Veenen-daal, E. M., and Kutsch, W. L.: Precipitation as driver of carbon fluxes in 11 African ecosystems, Biogeosciences, 6, 1027–1041, doi:10.5194/bg-6-1027-2009, 2009.
Moncrieff, J. B., Monteny, B., Verhoef, A., Friborg, T., Elbers, J., Kabat, P., de Bruin, H., Soegaard, H., Jarvis, P. G., and Taupin, J. D.: Spatial and temporal variations in net car-bon flux during HAPEX-Sahel, J. Hydrol., 188–189, 563–588, doi:10.1016/s0022-1694(96)03193-9, 1997.
Monteith, J. L.: Solar radiation and productivity in tropical ecosys-tems, J. Appl. Ecol., 9, 747–766, 1972.
Monteith, J. L.: Climate and the efficiency of crop production in Britain, Philos. T. Roy. Soc. B., 281, 277–294, 1977.
Monteny, B. A., Lhomme, J. P., Chehbouni, A., Troufleau, D., Amadou, M., Sicot, M., Verhoef, A., Galle, S., Said, F., and Lloyd, C. R.: The role of the Sahelian biosphere on the water and the CO2cycle during the HAPEX-Sahel experiment, J. Hydrol., 188, 516–535, doi:10.1016/S0022-1694(96)03191-5, 1997. Mutanga, O. and Skidmore, A. K.: Narrow band
veg-etation indices overcome the saturation problem in biomass estimation, Int. J. Remote Sens., 25, 3999–4014, doi:10.1080/01431160310001654923, 2004.
NASA: Reverb ECHO: available at: http://reverb.echo.nasa.gov/ reverb/, last access: 14 June 2016.
Papale, D., Reichstein, M., Aubinet, M., Canfora, E., Bernhofer, C., Kutsch, W., Longdoz, B., Rambal, S., Valentini, R., Vesala, T., and Yakir, D.: Towards a standardized processing of Net Ecosys-tem Exchange measured with eddy covariance technique: algo-rithms and uncertainty estimation, Biogeosciences, 3, 571–583, doi:10.5194/bg-3-571-2006, 2006.
Paruelo, J. M., Garbulsky, M. F., Guerschman, J. P., and Job-bágy, E. G.: Two decades of Normalized Difference Vege-tation Index changes in South America: identifying the im-print of global change, Int. J. Remote Sens., 25, 2793–2806, doi:10.1080/01431160310001619526, 2004.
Poulter, B., Frank, D., Ciais, P., Myneni, R. B., Andela, N., Bi, J., Broquet, G., Canadell, J. G., Chevallier, F., Liu, Y. Y., Running, S. W., Sitch, S., and van der Werf, G. R.: Contribution of semi-arid ecosystems to interannual variability of the global carbon cycle, Nature, 509, 600–603, doi:10.1038/nature13376, 2014.
Prince, S. D., Kerr, Y. H., Goutorbe, J. P., Lebel, T., Tinga, A., Bessemoulin, P., Brouwer, J., Dolman, A. J., Engman, E. T., Gash, J. H. C., Hoepffner, M., Kabat, P., Monteny, B., Said, F., Sellers, P., and Wallace, J.: Geographical, biological and remote sensing aspects of the hydrologic atmospheric pilot experiment in the sahel (HAPEX-Sahel), Remote Sens. Environ., 51, 215– 234, doi:10.1016/0034-4257(94)00076-Y, 1995.
Qi, J., Chehbouni, A., Huete, A. R., Kerr, Y. H., and Sorooshian, S.: A modified soil adjusted vegetation index, Remote Sens. Envi-ron., 48, 119–126, 1994.
Richter, K., Atzberger, C., Hank, T. B., and Mauser, W.: Deriva-tion of biophysical variables from Earth observaDeriva-tion data: vali-dation and statistical measures, J. Appl. Remote Sens., 6, 1–23, doi:10.1117/1.JRS.6.063557, 2012.
Rietkerk, M., Ketner, P., Stroosnijder, L., and Prins, H. H. T.: Sahe-lian rangeland development; a catastrophe?, J. Range Manage., 49, 512–519, 1996.
Rockström, J. and de Rouw, A.: Water, nutrients and slope position in on-farm pearl millet cultivation in the Sahel, Plant Soil, 195, 311–327, doi:10.1023/A:1004233303066, 1997.
Roujean, J.-L. and Breon, F.-M.: Estimating PAR absorbed by vegetation from bidirectional reflectance measurements, Remote Sens. Environ., 51, 375–384, doi:10.1016/0034-4257(94)00114-3, 1995.
Rouse, J. W., Haas, R. H., Schell, J. A., Deering, D. W., and Harlan, J. C.: Monitoring the Vernal Advancement of Retrogradation of Natural Vegetation, Type III, Final Report, Greenbelt, MD, 1974. Ruimy, A., Saugier, B., and Dedieu, G.: Methodology for the es-timation of terrestrial net primary production from remotely sensed data, J. Geophys. Res., 99, 5263–5283, 1994.
Running, S. W. and Zhao, M.: User’s Guide, Daily GPP and Annual NPP (MOD17A2/A3) Products NASA Earth Observing System MODIS Land Algorithm, Version 3.0 For Collection 6., Univer-sity of Montana, USA, NASA, 2015.
Running, S. W., Nemani, R. R., Heinsch, F. A., Zhao, M., Reeves, M., and Hashimoto, H.: A Continuous Satellite-Derived Measure of Global Terrestrial Primary Pro-duction, BioScience, 54, 547–560, doi:10.1641/0006-3568(2004)054[0547:ACSMOG]2.0.CO;2, 2004.
Scholes, R. J. and Archer, S. R.: Tree-grass interactions in savannas, Annu. Rev. Ecol. Syst., 28, 517–544, 1997.
Sellers, P. J., Dickinson, R. E., Randall, D. A., Betts, A. K., Hall, F. G., Berry, J. A., Collatz, G. J., Denning, A. S., Mooney, H. A., Nobre, C. A., Sato, N., Field, C. B., and Henderson-Sellers, A.: Modeling the Exchanges of Energy, Water, and Carbon Be-tween Continents and the Atmosphere, Science, 275, 502–509, doi:10.1126/science.275.5299.502, 1997.
Sims, D. A., Rahman, A. F., Cordova, V. D., El-Masri, B. Z., Bal-docchi, D. D., Flanagan, L. B., Goldstein, A. H., Hollinger, D. Y., Misson, L., Monson, R. K., Oechel, W. C., Schmid, H. P., Wofsy, S. C., and Xu, L.: On the use of MODIS EVI to assess gross pri-mary productivity of North American ecosystems, J. Geophys. Res., 111, G04015, doi:10.1029/2006JG000162, 2006.
Kutsch, W., Merbold, L., Mougin, E., Nickless, A., Nouvel-lon, Y., Scholes, R. J., Veenendaal, E. M., and Ardö, J.: Eval-uation of MODIS gross primary productivity for Africa using eddy covariance data, Remote Sens. Environ., 131, 275–286, doi:10.1016/j.rse.2012.12.023, 2013.
Tagesson, T., Eklundh, L., and Lindroth, A.: Applicability of leaf area index products for boreal regions of Sweden, Int. J. Remote Sens., 30, 5619–5632, 2009.
Tagesson, T., Fensholt, R., Cropley, F., Guiro, I., Horion, S., Eham-mer, A., and Ardö, J.: Dynamics in carbon exchange fluxes for a grazed semi-arid savanna ecosystem in West Africa, Agr. Ecosyst. Environ., 205, 15–24, doi:10.1016/j.agee.2015.02.017, 2015a.
Tagesson, T., Fensholt, R., Guiro, I., Rasmussen, M. O., Huber, S., Mbow, C., Garcia, M., Horion, S., Sandholt, I., Rasmussen, B. H., Göttsche, F. M., Ridler, M.-E., Olén, N., Olsen, J. L., Eham-mer, A., Madsen, M., Olesen, F. S., and Ardö, J.: Ecosystem properties of semi-arid savanna grassland in West Africa and its relationship to environmental variability, Glob. Change Biol., 21, 250–264, doi:10.1111/gcb.12734, 2015b.
Tagesson, T., Fensholt, R., Huber, S., Horion, S., Guiro, I., Eham-mer, A., and Ardö, J.: Deriving seasonal dynamics in ecosys-tem properties of semi-arid savanna grasslands from in situ-based hyperspectral reflectance, Biogeosciences, 12, 4621–4635, doi:10.5194/bg-12-4621-2015, 2015c.
Tagesson, T., Fensholt, R., Cappelaere, B., Mougin, E., Horion, S., Kergoat, L., Nieto, H., Ehammer, A., Demarty, J., and Ardö, J.: Spatiotemporal variability in carbon exchange fluxes across the Sahel, Agr. Forest Meteorol., 226–227, 108–118, 2016a. Tagesson, T., Fensholt, R., Guiro, I., Cropley, F., Horion,
S., Ehammer, A., and Ardö, J.: Very high carbon ex-change fluxes for a grazed semi-arid savanna ecosystem in West Africa, Danish Journal of Geography, 116, 93–109, doi:10.1080/00167223.2016.1178072, 2016b.
Thenkabail, P. S., Smith, R. B., and De Pauw, E.: Hyperspec-tral Vegetation Indices and Their Relationships with Agricul-tural Crop Characteristics, Remote Sens. Environ., 71, 158–182, doi:10.1016/S0034-4257(99)00067-X, 2000.
Timouk, F., Kergoat, L., Mougin, E., Lloyd, C. R., Ceschia, E., Co-hard, J. M., Rosnay, P. d., Hiernaux, P., Demarez, V., and Taylor, C. M.: Response of surface energy balance to water regime and vegetation development in a Sahelian landscape, J. Hydrol., 375, 12–12, doi:10.1016/j.jhydrol.2009.04.022, 2009.
Turner, D. P., Ritts, W. D., Cohen, W. B., Maeirsperger, T. K., Gower, S. T., Kirschbaum, A. A., Running, S. W., Zhao, M., Wofsy, S. C., Dunn, A. L., Law, B. E., Campbell, J. L., Oechel, W. C., Kwon, H. J., Meyers, T. P., Small, E. E., Kurc, S. A., and Gamon, J. A.: Site-level evaluation of satellite-based global terrestrial gross primary production and net primary production monitoring, Glob. Change Biol., 11, 666–684, 2005.
Turner, D. P., Ritts, W. D., and Cohen, W. B.: Evaluation of MODIS NPP and GPP products across multiple biomes, Remote Sens. Environ., 102, 282–293, 2006.
United Nations: Sahel Regional Strategy Mid-Year Review 2013, New York, 1–59, 2013.
Veenendaal, E. M., Kolle, O., and Lloyd, J.: Seasonal variation in energy fluxes and carbon dioxide exchange for a broadleaved semi-arid savanna (Mopane woodland) in Southern Africa, Glob. Change Biol., 10, 318–328, 2004.
Velluet, C., Demarty, J., Cappelaere, B., Braud, I., Issoufou, H. B.-A., Boulain, N., Ramier, D., Mainassara, I., Charvet, G., Boucher, M., Chazarin, J.-P., Oï, M., Yahou, H., Maidaji, B., Arpin-Pont, F., Benarrosh, N., Mahamane, A., Nazoumou, Y., Favreau, G., and Seghieri, J.: Building a field- and model-based climatology of local water and energy cycles in the cultivated Sahel – annual budgets and seasonality, Hydrol. Earth Syst. Sci., 18, 5001–5024, doi:10.5194/hess-18-5001-2014, 2014. Yoder, B. J. and Pettigrew-Crosby, R. E.: Predicting nitrogen and
chlorophyll content and concentrations from reflectance spectra (400–2500 nm) at leaf and canopy scales, Remote Sens. Envi-ron., 53, 199–211, doi:10.1016/0034-4257(95)00135-N, 1995. Zhang, Y., Guanter, L., Berry, J. A., Joiner, J., van der Tol, C., Huete,