Quantifying Protein Function Specificity in the Gene
Ontology
Brenton Louie1,2, Silas Bergen1,3, Roger Higdon1,2, and Eugene Kolker1,2,4,*
1Bioinformatics and High-throughput Analysis Laboratory, Seattle Children’s Research Institute, Seattle, WA, USA
2Predictive Analytics, Seattle Children’s Hospital
3Department of Biostatistics, University of Washington School of Public Health 4Biomedical and Health Informatics Division, Department of Medical Education and
Biomedical Informatics, University of Washington School of Medicine, Seattle, WA, USA *Corresponding author: [email protected]
Keywords: protein annotation, protein function, function specificity
Quantitative or numerical metrics of protein function specificity made possible by the Gene Ontology are useful in that they enable development of distance or similarity measures be-tween protein functions. Here we describe how to calculate four measures of function speci-ficity for GO terms: 1) number of ancestor terms; 2) number of offspring terms; 3) proportion of terms; and 4) Information Content (IC). We discuss the relationship between the metrics and the strengths and weaknesses of each.
Abbreviations: DAG- Directed Acyclic Graph, GO- Gene Ontology, IC- Information Content
Introduction
Genomic sciences and biological understanding can be greatly enriched by quantitative compari-sons between the descriptions of protein func-tions [1-5]. To achieve this, numerical descripfunc-tions of protein function specificity must be defined. This is now possible using the Gene Ontology (GO [6,7], ). The GO is a standardized description of protein function structured as a hierarchy of “par-ent-child” relationships, formally called a directed acyclic graph (DAG). DAGs have long been used in computer science as a mathematical formalism for describing complex objects. Modeling protein function as a DAG provides a means of more pre-cisely defining protein function and the relation-ship between functions as opposed to traditional natural language descriptions which are informa-tion-rich but unfortunately not amenable to com-puters.
The use of the GO provides a conception of func-tion specificity that has immediate implicafunc-tions in the automated annotation of proteins [4,6]. Mil-lions of proteins in public databases have their functions inferred from proteins with similar se-quences. The meaningful transfer of those
func-tions is made possible in part by the standardized organization of the GO. The GO is organized so that as one traverses away from the root node function, definitions become narrower; examples of broad functional terms are “catalytic activity”
(GO:0003824) or “transporter activity” (GO:0005215),
while narrower functions would be “adenylate cyc-lase activity” (GO:0004016) or “peptidoglycan transporter activity” (GO:0015647) [6].
Requirements
The methods described here utilize the R pro-gramming language with the Bioconductor R package installed and a dataset of associations between gene or protein identifiers and GO terms, e.g. the gene2go file available described here are available for free.
Procedure
Number of Ancestors
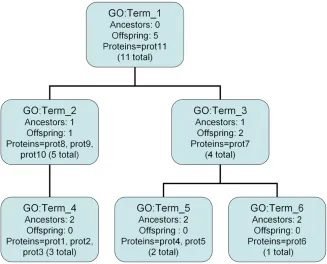
One of the original ways to describe the function specificity of a given GO term is through the num-ber of ancestor nodes a term has which is a meas-ure of how “deep” a GO term is in the GO hierarchy. This is calculated by counting the number of ances-tor terms for a given GO term up to and including the root term; in general one would expect a more specific function to have a greater number of GO ancestors. Refer to Figure. 1 : the GO term GO:Term_1 has no ancestors; the GO terms GO:Term_2 and GO:Term_3 each have one ancestor, etc. This approach appeals to the nature of the GO since as one traverses down the GO away from the
root node one expects the specificity of terms to increase. Pseudocode for this process can be seen in Figure 2. Note that in determining ancestors, the “neighbors” of a GO term would only include parent nodes (not child nodes).
Number of Offspring
A second method of measuring GO term specificity is the number of offspring nodes a GO term has. As with the number of GO ancestors, this is a useful metric in that it takes under immediate considera-tion the hierarchical nature of the GO with more specific terms tending to have fewer offspring. We created an adjusted, more normalized measure-ment of GO offspring (OffspN) in order to have the
measure increase with specificity in the same man-ner as GO ancestors by considering the maximum number of offspring (i.e., the number of offspring of the root node, which is 8267 for the version of the GO molecular function ontology concurrent with this paper), and calculated this measure as follows:
N
Offsp =log(8267+1) - log(offsp+1)
The interpretation of this measure is that higher OffspN indicates more specific function. This
main-tains the same “higher is better” idea consistent with other GO specificity metrics such as GO an-cestors. Pseudocode for this calculation is also ex-emplified in Figure 2. Note however that the neighbors of a node would only include its child nodes – not its parents.
GO Proportion
In order to take under consideration both the number of ancestor nodes and the number of offspring nodes of a particular GO term we created a measure of function specificity that incorporates both measures. This measure is a proportion of the offspring of a term over the total number of “reachable” terms, or offspring + ancestors. In or-der to have the same interpretation as the above GO ancestor and offspring measures, we took 1 minus the proportion, as follows:
t
#Offspring
P =1- #Offspring+#Ancestors
Where Pt is the GO proportion of the reachable terms for term t. The 0-1 range of this proportion,
with 0 indicating non-specific function and 1 indi-cating high specificity, is useful for a readily-understood interpretation when comparing terms.
Information Content
Information content (IC) provides an alternate measure of function specificity. Unlike the pre-vious specificity metrics IC is a function of a data set. In particular, it is related to the probability of the occurrence of a particular GO term in a data-base of protein annotations. GO terms that occur less frequently have higher IC and are assumed to be more specific. The formula for calculating IC is:
2
IC(t)=-log (p(t))
Where t is a particular GO term and p is the
prob-ability of that term occurring in a data set. The probability of a term occurring is the frequency with which that particular term or any of its an-cestors occur in a data set [9,10]. For any GO term in the ontology, p(t) is calculated as follows:
Step 1: Count the number of proteins assigned to the term.
Step 2: Count the number of proteins assigned to all offspring of the term.
Step 3: Add the counts from Steps 1 and 2 and di-vide by the total number of proteins in the data set.
Consider, for example, Figure 2. To calculate p(t)
and IC for GO:Term_3, we follow these steps: Step 1: Count the proteins assigned to GO:Term_3 (one).
Step 2: Count the proteins assigned to the offspring of GO:Term_3 (three).
Step 3: Calculate p(t) for GO:Term_3, in this case
4/11. Its IC is therefore 1.5.
The appealing part IC is that it implicitly accounts for the hierarchical structure of the GO. The root node, or “molecular function” (GO:0003674), has
IC of 0.0, creating an appealing baseline measure-ment of the most non-specific function. As the GO is traversed away from the root node one general-ly expects IC for terms to increase.
Implementation
Calculating GO Ancestors/Offspring
The GO.db package from the Bioconductor library written for the R statistical software provides a quick and easy way of obtaining the ancestor and offspring terms of any given GO term [11]. The library contains the GO DAG and outputs descrip-tions of GO term reladescrip-tionships with a few simple commands. The Bioconductor library can be
ob-tained free of charg
the GO.db package have been installed, these commands are what would be used to obtain all the ancestor GO terms of, for example, the GO term “collagen binding” (GO:0005518):
> GOMFANCESTOR[[“GO:0005518”]]
[1] “all” “GO:0005515” “GO:0003674” “GO:0005488”
This returns the ancestors of the term GO:0005518, which in this case are “binding” (GO:0005488),
“protein binding” (GO:0005515), and the root term
“molecular function” (GO:0003674). The length
function in R can be used to count the terms in the returned vector from the GOMFANCESTOR func-tion. Analogously, to obtain the offspring of a spe-cific term, one would use the command
> GOMFOFFSPRING[[“GO:0005518”]] [1] “GO:0070052”
Which returns the lone offspring of GO:0005518, which is the term “collagen V binding”
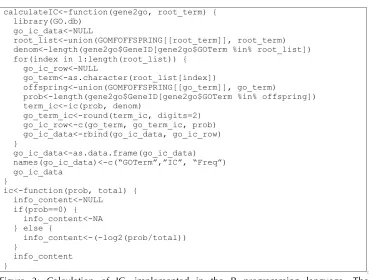
Calculating Information Content
As discussed above, IC is related to the probability of a specific GO term occurring in a data set. The below R code that calculates IC takes as input the “gene2go” file which is a data set that contains
as-sociation of proteins with GO terms (the gene2go
file can be found
is “GO:0003674” for the molecular function ontol-ogy. Code, implemented in the R programming language, can be seen in Figure 3.
Figure 2. Pseudocode for determining ancestors or offspring in the GO. The “g” and “t” ar-guments to the TermSpecificity function are the GO structured as a DAG, and the particular term in question respectively. This routine is similar to a standard “depth-first-search” graph algorithm that searches for a specific node in a subgraph [8], however its purpose is to count the visited nodes rather than to locate a specific node. An “unvisited” neighbor is ei-ther a parent or child node, depending on wheei-ther offspring or ancestors are being counted. For the implementation of these methods see the “Implementation” section.
Discussion
The methods described above provide a useful toolkit of varied approaches to measuring function specificity using the Gene Ontology. The goal is to develop a metric of specificity that is comparable among all GO terms, which is not an easy task. Each method has information about the specificity of any particular GO term that another might not have (see Figure 4), and each has their own strengths and weaknesses. The number of GO an-cestors of a term as discussed above is useful in that it directly reflects the DAG nature of the GO, is easy to calculate, and has an intuitively appealing interpretation. The problem with this measure-ment is that there are idiosyncrasies in the GO that can cause the path length between any given GO term and the root node to be highly variable. For instance, the GO term GO:0000102 “catalysis of the transfer of L-methionine from one side of a mem-brane to the other, up its concentration gradient”
(GO:0000102) has no offspring and 17 ancestors, while the term “the action of a molecule that con-tributes to the structural integrity of a cytoskeletal structure” (GO:0005200) has no offspring and two
ancestors. The variability inherent in the number of ancestors of a term makes it difficult to accu-rately assess and compare specificity between GO terms, making it the least useful specificity metric in our opinion.
The measurement based on the normalized num-ber of GO offspring also is a function purely of the GO, like that of GO ancestors, but is more reliable due to its lower variability. The GO offspring mea-surement will also remain consistent across data sets, providing a non-data-dependent option of measuring and comparing function specificity in contrast to IC (see below). Note that GO offspring does in fact correlate fairly strongly with IC (Fig-ure 4). The caveat to the use of this normalized offspring metric as a measure of function specifici-ty is that there are GO terms seemingly quite spe-cific by other metrics still have many offspring as well as some seemingly non-specific terms by oth-er metrics that have few or no offspring (see Table 1).
The GO proportion is useful in that it considers the implications of both the number of ancestors and the number of offspring. It is also on a 0-1 scale, which allows a readily accessible min-max inter-pretation. However, the concerns with this pro-portion measure are similar to those pertaining to GO ancestors and GO offspring.
The most unique aspect of IC is that it is calculated from data. The strength of IC, however, doubles as a caveat: since it is data dependent, the IC of a par-ticular GO term may fluctuate from data set to da-ta set. In our experience however the IC calcula-tion is generally robust for most terms, especially common ones as their probability of occurrence in a data set changes little. Very scarce GO terms can be impacted more significantly if more instances of the term are added to a dataset, although we have found this to be a rare event. Also, if a GO term does not occur in a data set then calculating its IC is impossible. This is undesirable, especially if that GO term is of some interest to the research project at hand. Also, occurrence of GO terms in a data set might be due to bias in the way proteins are annotated which may not be representative of the natural state of function specificity, i.e. more specific IC may not be truly indicative of more specific function.
There is also some “divergence” between the vari-ous specificity metrics for some GO terms. Concrete examples of where the various specificity measures may diverge can be seen in Table 1. For instance the GO term “interacting selectively and non-covalently with ATP, adenosine 5'-triphosphate”
(GO:0005524) has the maximum value of the GO offspring measurement (OffspN=9.02) and the GO
proportion is 1.0, both indications of very specific function. The IC however is only 6.64, an indication of relatively non-specific function. This exemplifies a case where two of the measures indicate specific function while another indicates moderately-specific function. A reversal of sorts can be seen with the GO term “the action of a molecule that con-tributes to the structural integrity of a cuticle”
(GO:0042302). This GO term is very specific by IC (15.18), yet middling specificity is indicated by OffspN (7.23), and low specificity as indicated by GO
proportion (0.29) and GO ancestors (2). The GO term “the function of binding to a specific DNA se-quence in order to modulate transcription”
to be represented to some degree idiosyncratically between different types of functions. In contrast, IC, which only considers the current distribution of GO terms in a database and may be biased due to the experimental methodologies used to annotate
pro-teins. Certainly no metric is perfect, each has strengths and weaknesses, and considering all of them provides a more holistic knowledge of a GO term to enable specificity comparisons across terms.
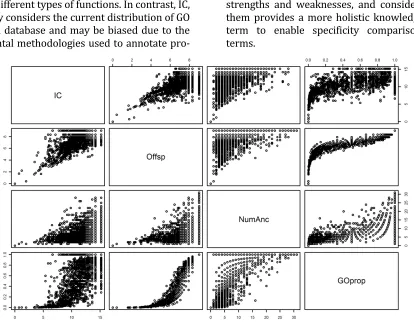
Figure 4: Correlation between different measurements of function specificity. This scatter-plot matrix of each pair of specificity measures shows the ways in which they are correlated with each other. Each individual row and column contains comparisons for the particular variables with the rows corresponding to the y-axis and columns to the x-axis. For instance, for the IC and Offsp plot in the lower quadrant, the y-axis is Offsp (0-8) and the x-axis is IC (0-15). In the upper quadrant this is reversed. The variables in the pairs plot are the aforementioned IC and Offsp (normalized); as well as NumAnc (the number of GO ancestors of a term); and GOprop (the proportion considering both number of ancestors and number of offspring of a term). As is shown in this graph, there is strong correlation between each of the variables but not exactly, indicating each one has information about specificity another might not have.
Table 1: Examples of GO terms and their specificity metrics.
GO Offspring OffspN GO Anc GO Prop IC
Max Specificity Value 0 9.02 31 1 15.18
Min Specificity Value 8267 0 0 0 0
GO:0005524 0 9.02 8 1 6.64
GO:0003700 1 8.33 5 0.83 5.85
GO:0042302 5 7.23 2 0.29 15.18
References
1. Kolker E, Purvine S, Galperin MY, Stolyar S, Goodlett DR, Nesvizhskii AI, Keller A, Xie T, Eng JK, Yi E, et al. Initial Proteome Analysis of Model Microorganism Haemophilus influenzae Strain Rd KW20. J Bacteriol 2003; 185:4593-4602
2. Raghunathan A, Price ND, Galperin MY, Maka-rova KS, Purvine S, Picone AF, Cherny T, Xie T, Reilly TJ, Munson R, et al. In Silico Metabolic Model and Protein Expression of Haemophilus in-fluenzae Strain Rd KW20 in Rich Medium. OM-ICS 2004; 8:25-41
3. Kolker E, Makarova KS, Shabalina S, Picone AF, Purvine S, Holzman T, Cherny T, Armbruster D, Munson RS, Kolesov G, et al. Identification and functional analysis of 'hypothetical' genes ex-pressed in Haemophilus influenzae. Nucleic Acids Res 2004; 32:2353-2361
4. Kolker E, Picone AF, Galperin MY, Romine MF, Higdon R, Makarova KS, Kolker N, Anderson GA, Qiu X, Auberry KJ, et al. Global profiling of She-wanella oneidensis MR-1: Expression of hypothet-ical genes and improved functional annotations.
Proc Natl Acad Sci USA 2005; 102:2099-2104
5. Louie B, Higdon R, Kolker E. A Statistical Model of Protein Sequence Similarity and Function Simi-larity Reveals Overly-Specific Function Predic-tions. PLoS ONE 2009; 4:e7546
6. Ashburner M, Ball CA, Blake JA, Botstein D, But-ler H, Cherry JM, Davis AP, Dolinski K, Dwight SS, Eppig JT, et al. Gene ontology: tool for the un-ification of biology. The Gene Ontology Consor-tium. Nat Genet 2000; 25:25-29
7. The Gene Ontology Consortium. The Gene On-tology in 2010: extensions and refinements.
Nucleic Acids Res 2010;38:D331-D335.
8. Chang S. Data structures and algorithms. Univer-sity of Pittsburg, USA: World Scientific; 2003. 9. Lord PW, Stevens RD, Brass A, Goble CA.
Inves-tigating semantic similarity measures across the Gene Ontology: the relationship between se-quence and annotation. Bioinformatics 2003; 19:1275-1283
10. Pesquita C, Faria D, Bastos H, Ferreira AE, Falcão AO, Couto FM. Metrics for GO based protein se-mantic similarity: a systematic evaluation. BMC Bioinformatics 2008; 9:S4-S4
11. Gentleman RC, Carey V, Bates D, Bolstad B, Det-tling M, Dudoit S, Ellis B, Gautier L, Ge Y, Gentry J, et al. Bioconductor: open software development for computational biology and bioinformatics.
Genome Biol 2004; 5:R80